July 29, Gaithersburg MD. I just walked to the grocery store to get some lunch, and it is cold outside.
The overheated atmosphere acts in strange and mysterious ways.
July 29, Gaithersburg MD. I just walked to the grocery store to get some lunch, and it is cold outside.
The overheated atmosphere acts in strange and mysterious ways.
Trenberth is trying to blame a lightning storm in LA on carbon dioxide.
“On the West Coast,” Trenberth said, “you don’t have the complex vertical structure and wind shear typically associated with lightning storms.”
But a changing climate may alter those weather patterns, making such “freak” occurrences more common. California’s historic drought, for example, has the potential to set up conditions for extreme weather. “With the drought, the contrast between the ocean and land is much greater than it otherwise would be,” said Trenberth. “It’s those contrasts that can help set up circulation and make the weather a little bit more vigorous than it otherwise would be.
Lightning at Venice Beach? California faces really weird – and deadly – weather — The Daily Climate
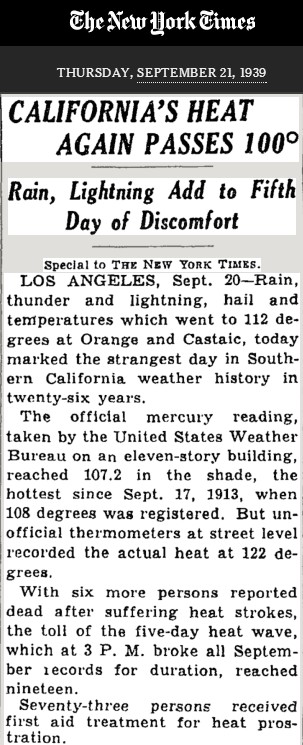
During the summer of 1939, LA was 107 degrees with lightning and hail. CO2 was 310 PPM at the time.
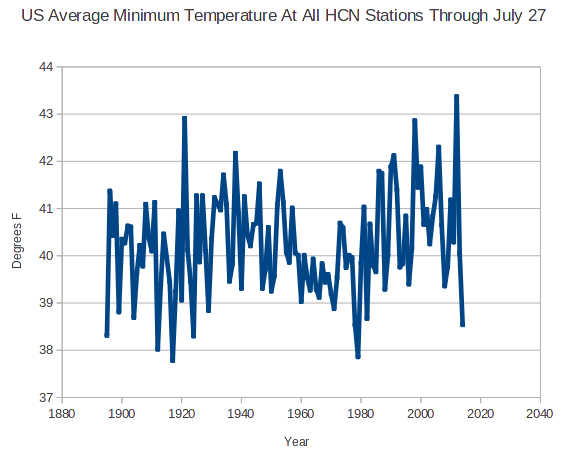
Through July 27th, nighttime temperatures in the US this year have been the coldest since 1979, and the sixth coldest on record. This is quite remarkable considering that UHI is warming nighttime temperatures by several degrees.
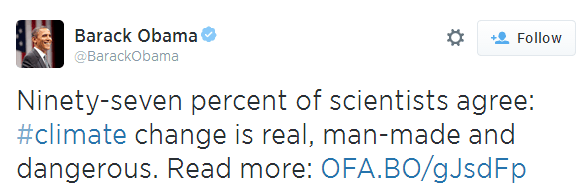
Alarmists have no facts to deal with any more, and are now completely dependent on repeating a few nonsensical big lies.
Few people other than Obama could pack so much bullshit into one sentence.
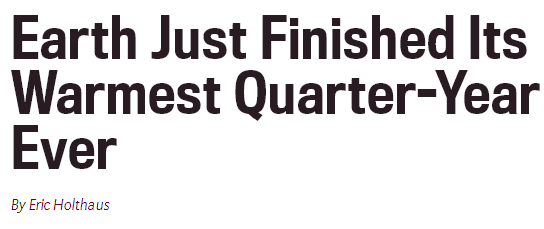
Besides all the other idiocy in Holthaus’ claim, only a complete imbecile would believe that the hottest quarter ever could occur between April and June.
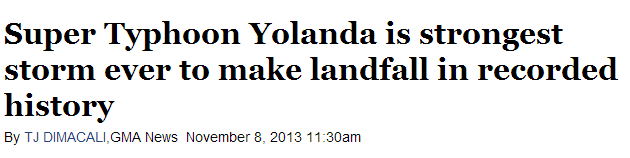
Jeff Masters cranked that BS out about two hours before the storm made landfall. The Philippines Weather Bureau immediately refuted it, but once the big lie is out there progressives will repeat it forever.
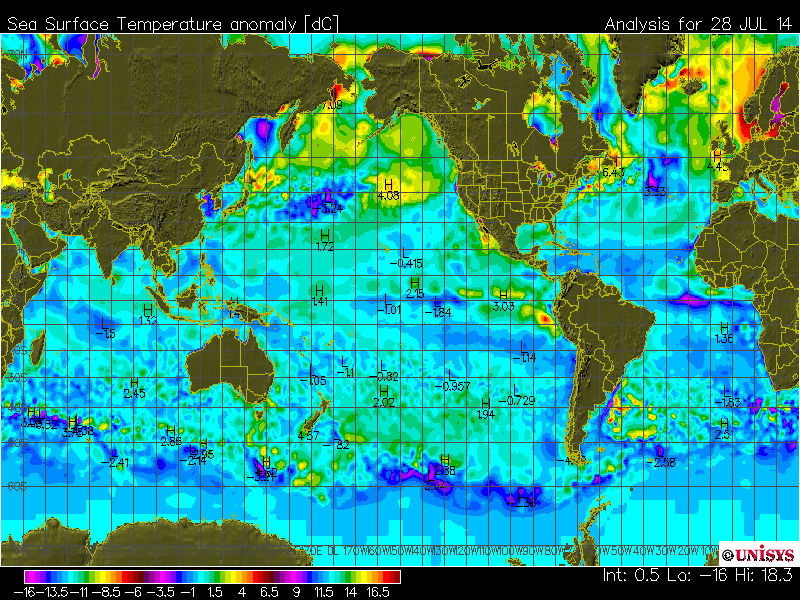
It would be difficult to imagine a more insidious color scale than used by the new Unisys SST anomaly maps.
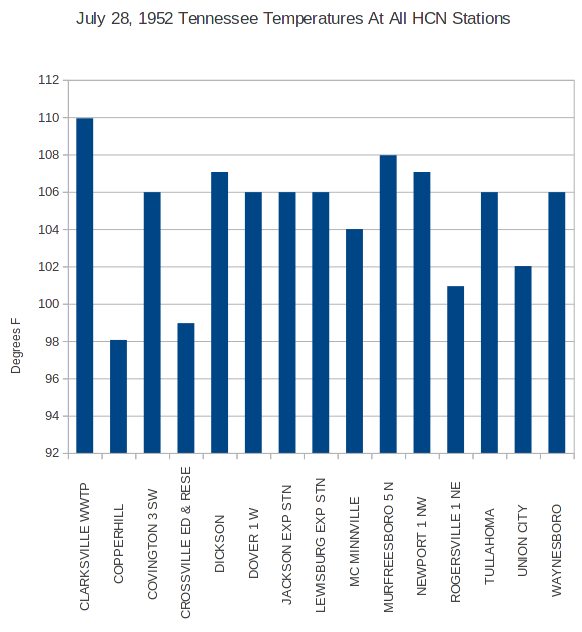
Yesterday was 84F in Clarksville, TN – but in 1952 it was 110F on the same date.
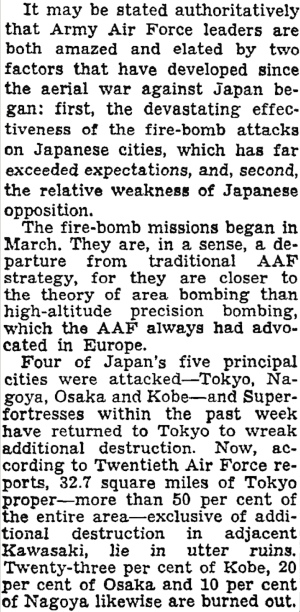
Teaming up with Hitler didn’t work out very well for the Japanese.
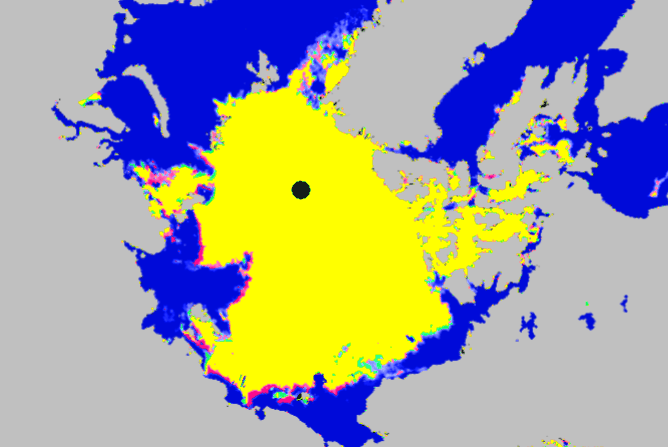
I mentioned a few days ago that high pressure over the East Siberian Sea was going to cause ice compaction in that region. The map below shows the three day reduction in extent there in red, and an increase in extent in the Beaufort Sea as green.
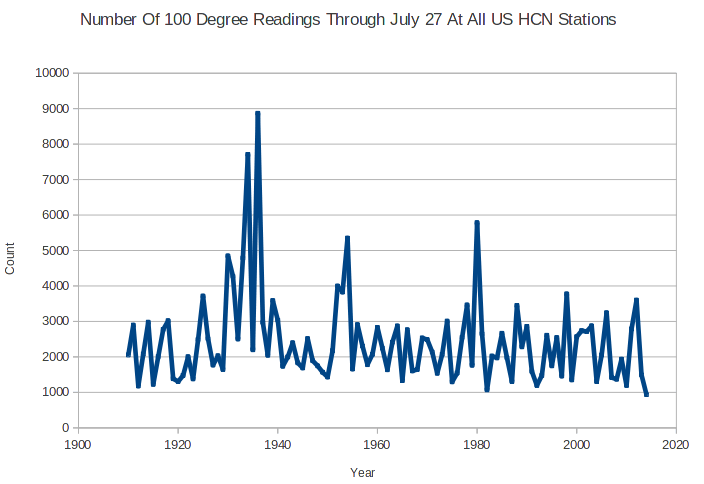
Through July 27, NOAA US HCN stations have reported the fewest number of 100 degree readings, since at least 1910. In 1936, almost 10 times as many 100 degree readings were reported.
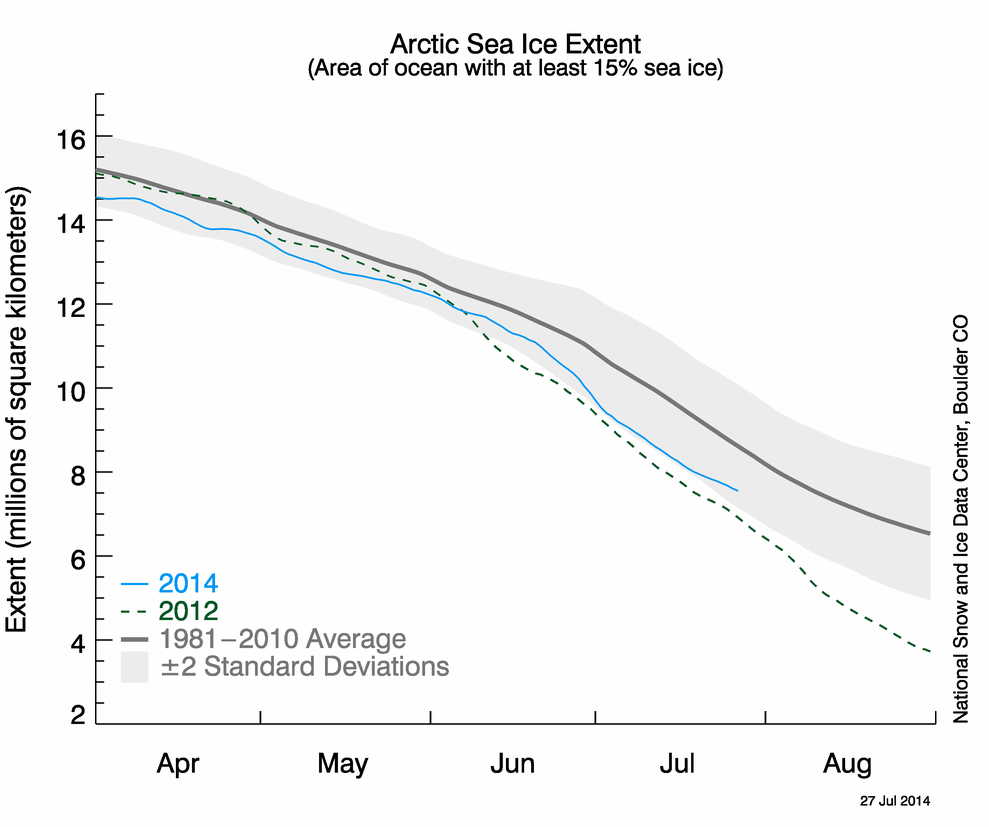
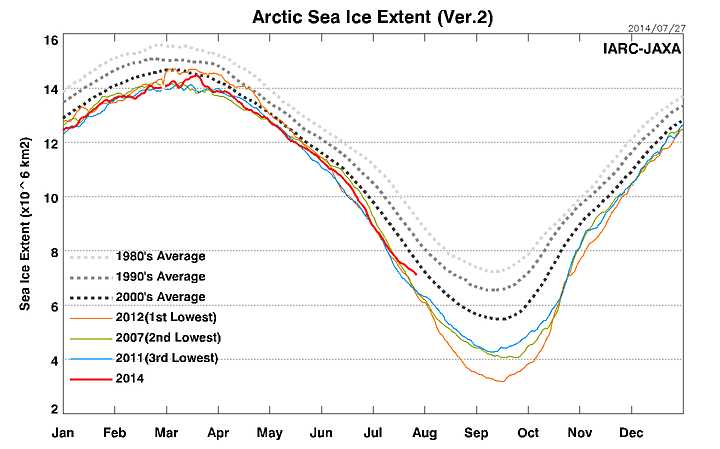
Last week, ClimateCrocks started the latest round of conspiracy theorizing – when they implied that DMI’s Arctic graphs (which showed a sharp decrease in ice loss rates) were somehow different from the other groups measuring the same data.
It is difficult to understand where such world beating paranoid stupidity comes from. All of the groups measuring Arctic sea ice show exactly the same thing – ice loss has dropped off sharply over the past few weeks.