Another Nail In The TOBS Coffin

Someone was suggesting earlier that the graph below showing NCDC TOBS adjustments are unwanted, might just be a coincidence.

ScreenHunter_1047 Jul. 17 07.06

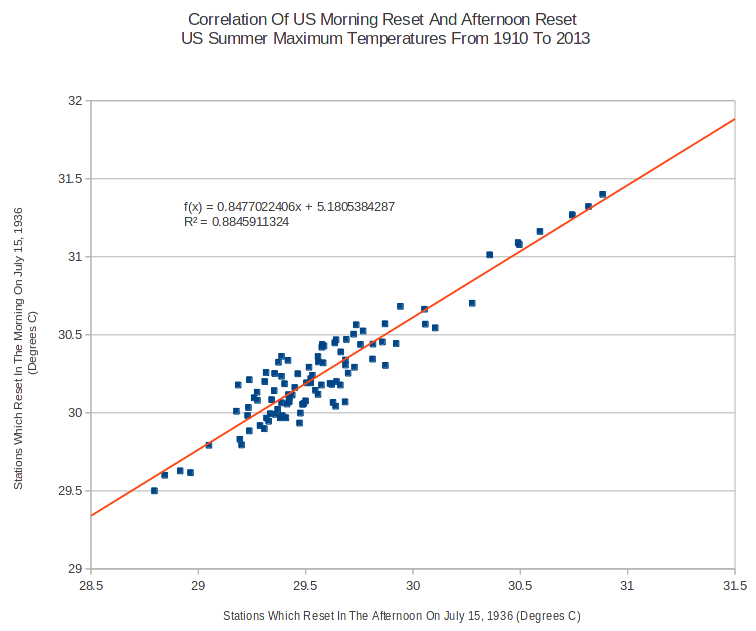
So I did a correlation between the two data sets, and found it is excellent.

ScreenHunter_1063 Jul. 17 21.50

The important thing to remember is these two data sets consist of a completely different set of US stations, with different time of day observations as of July 1936, yet they show excellent correlation.

This shows us that both the NCDC TOBS adjustments and the infilling adjustments are completely unnecessary, and destructive to the US temperature record. They cool the past and create a fake warming trend.

Posted in Uncategorized | 5 Comments

NASA Hacking Australia

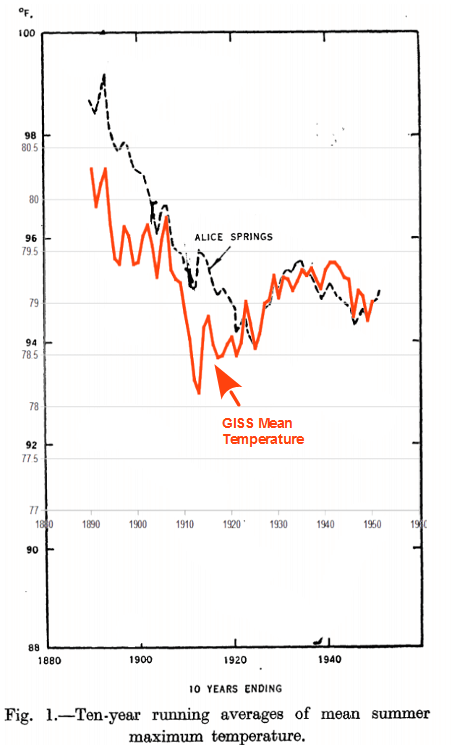
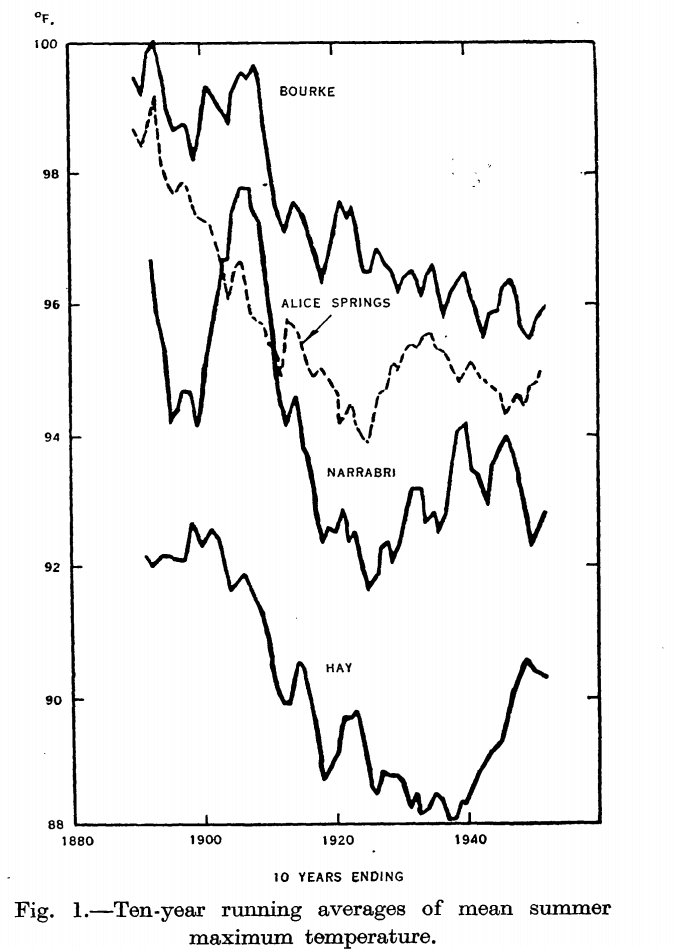
Jennifer Marohasy dug up a 1952 CSIRO paper, which shows sharp Australian cooling from the hot 1890s to the 1920s. I overlaid the GISS average summer temperature 10 year ending mean for Alice Springs, on the equivalent CSIRO maximum temperature graph for Alice Springs.

The comparison isn’t perfect (average temperature vs. maximum) but it does show how NASA has dramatically cooled Australia’s pre-1930 past, and have in fact turned a 1910-1925 cooling trend into a warming trend.

ScreenHunter_1062 Jul. 17 21.19

Deacon_EL_ClimateChangeinAustralia_1952.pdf

Data.GISS: GISS Surface Temperature Analysis

We know that the raw Alice Springs data was correct, because many other stations showed the same 1910-1925 cooling – which NASA has erased. Once again, NASA is destroying temperature records to suit a political agenda.

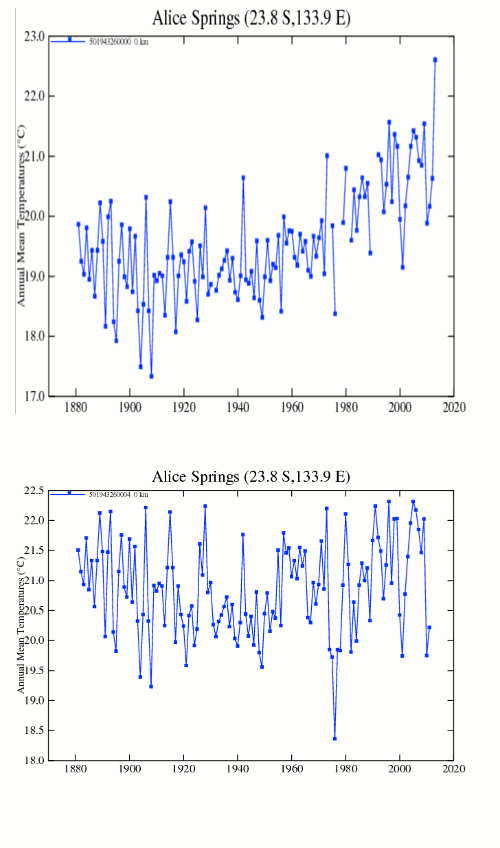
ScreenHunter_1058 Jul. 17 21.02

This is what NASA did to Alice Springs between GISS V2 and GISS V3

AliceSprings

Posted in Uncategorized | 13 Comments

Playing Whack A Mole With The Scamsters

One thing you can say for the climate scamsters, is that they are well organized. It is impressive watching them trying to keep the scam alive on a planet which isn’t cooperating.

A few examples.

  1. The US is having one of its coldest years on record, so they are taking a two pronged approach
    1. Have NASA/NOAA/JMA jack up fake global warming numbers, to make recent months the hottest ever – of course ignoring more accurate satellite data which shows no warming for 18 years and temperatures close to the median in 2014. This gives pundits talking points like “Hottest May ever”
    2. Make up fake studies to blame US cold weather on global warming
  2. Last year was one of the quietest years on record for Atlantic hurricanes. Not a problem – they simply made up fake statistics about the Philippines typhoon, which gave pundits a talking point.
  3. Scientific consensus falling apart – no problem. They took care of that by having Kook and Nutter create a fake study showing 97% consensus. I remember being contacted by Kook at the start of that “study” and could sense his excitement. He must have gotten a lot of money for that particular fraud. Now the pundits have a talking point.
  4. Not much extreme weather. Not a problem, just declare mild weather to be extreme. They did that during winter 2012, and are doing it again in summer 2014.

We see this over and over again. The constant generation of propaganda in an attempt to head off the inevitable collapse of their scam.

VOA News
July 16, 2014 12:34 PM

Scientific evidence about the rising of average global temperatures seems to be piling up.

According to the Japan Meteorological Agency, average global temperatures in April, May and June this year were the highest since the beginning of official records, in 1891.

The Japanese records, released on Monday, show that this year’s second quarter was about 0.68 degrees Celsius warmer than the average for the whole 20th century.

U.S. space agency NASA uses different method for calculating average temperature, but its records, released Monday, show almost identical results

Global Warming Reaches New Records

Posted in Uncategorized | 14 Comments

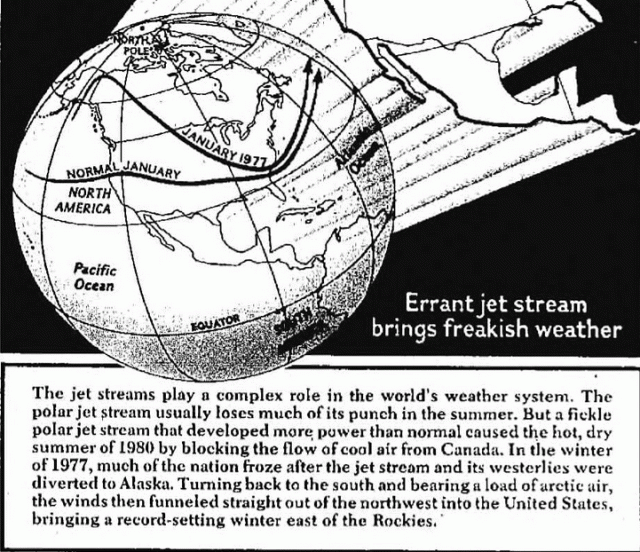
Nuttercelli Recycles 1977 Global Cooling Map To Prove Global Warming

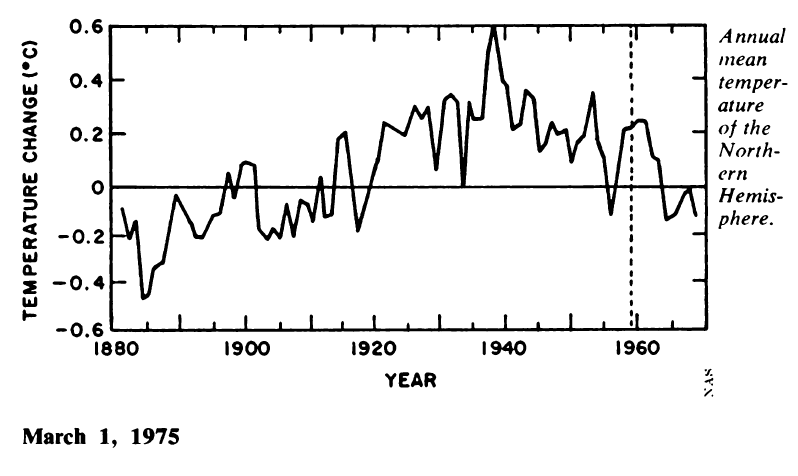
Climate experts said that global cooling caused deep dips in the jet stream in 1977, which in turn caused extreme weather.

screenhunter_224-jan-21-20-19

The Lewiston Journal – Google News Archive Search

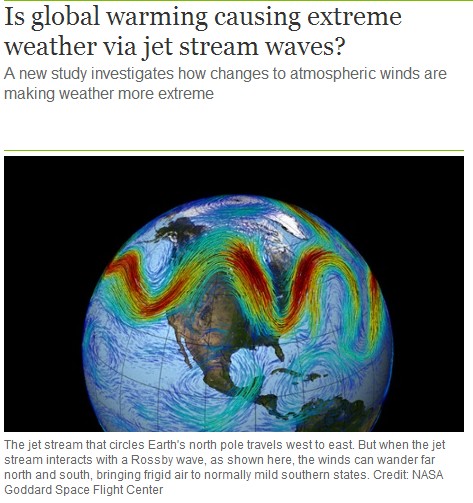
Now, Nuttercelli says that global warming is producing deep dips in the jet stream in 2014, which is causing “extreme” weather.

ScreenHunter_53 Jul. 17 14.00

Is global warming causing extreme weather via jet stream waves? | John Abraham | Environment | theguardian.com

Note the identical dip towards Florida caused by both global warming and global cooling.

Also note that Dana considers a nice cool summer day to be “extreme” weather.

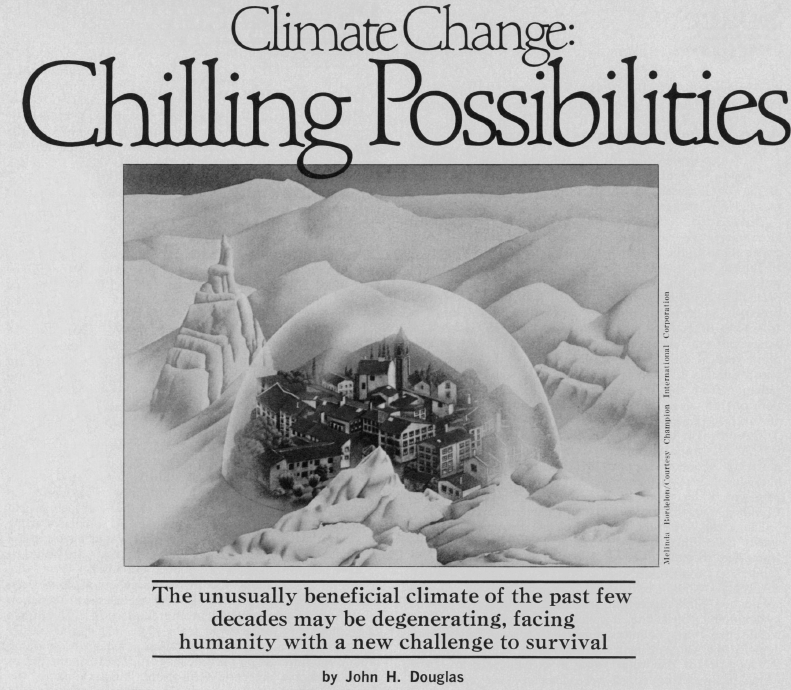
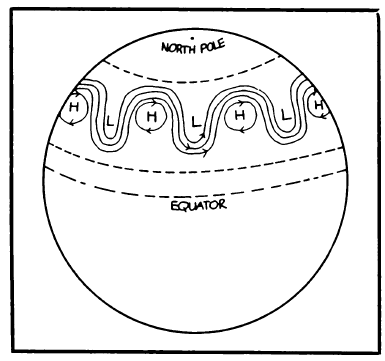
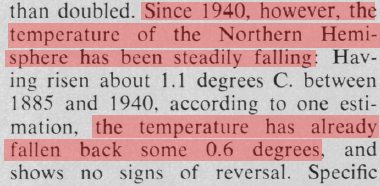
Science News explained the relationship between global cooling and jet stream dips in 1975

ScreenHunter_1072 Jul. 18 06.21

ScreenHunter_1069 Jul. 18 06.19 ScreenHunter_1071 Jul. 18 06.21

ScreenHunter_1081 Jul. 18 07.37

ScreenHunter_1075 Jul. 18 06.38

ScreenHunter_1076 Jul. 18 06.39


Posted in Uncategorized | 29 Comments

Wisconsin Having Their Coldest Year On Record

Wisconsin is having their coldest year on record – by a wide margin.

ScreenHunter_1053 Jul. 17 09.37

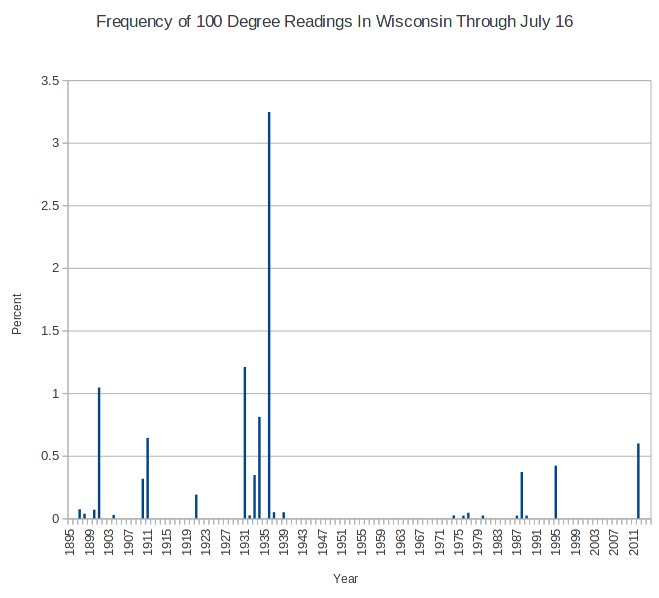
One hundred degree readings were common in Wisconsin prior to 1940, but almost never happen any more.

ScreenHunter_1054 Jul. 17 09.39

Posted in Uncategorized | 14 Comments

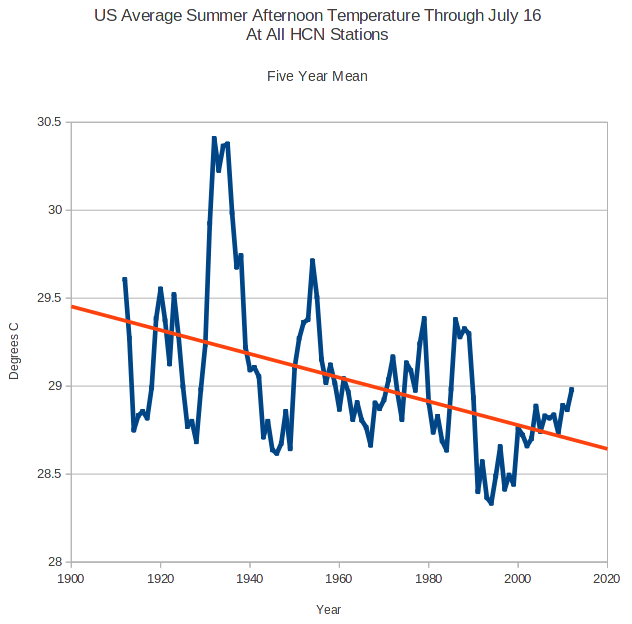
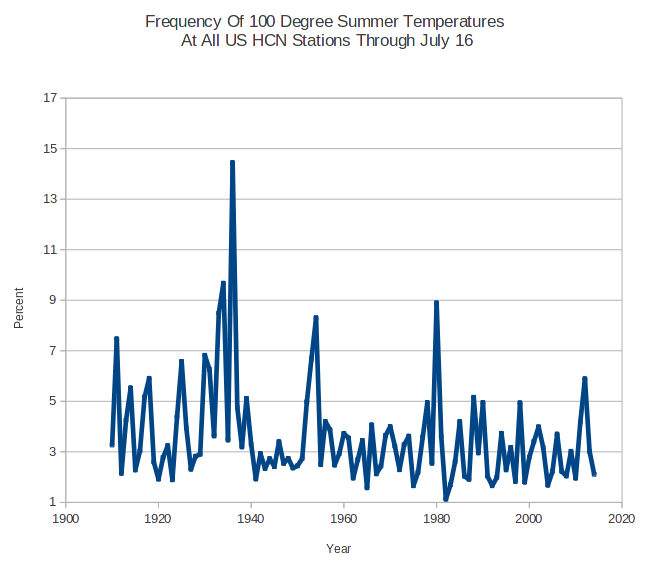
US Summer Maximum Temperatures Plummeting For Over 100 Years

ScreenHunter_1050 Jul. 17 09.22

One hundred degree readings in 1936 occurred seven times as frequently as this summer.

ScreenHunter_1051 Jul. 17 09.28

Posted in Uncategorized | 10 Comments

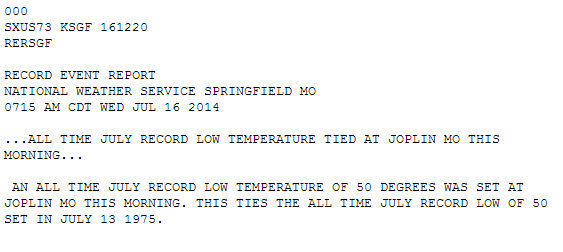
Joplin Missouri Records Their Coldest July Temperature Ever

ScreenHunter_1048 Jul. 17 09.01

Public Information – NOAA’s National Weather Serviceh/t to Andy DC

Posted in Uncategorized | 12 Comments

Climate Joke Of The Day

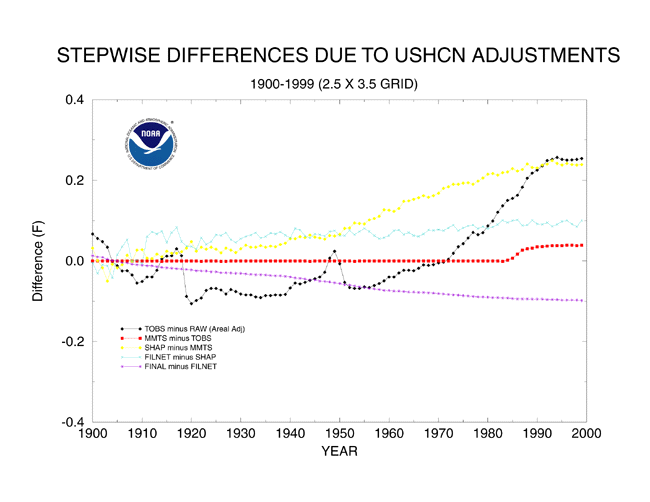
USHCN UHI adjustments are less than 0.1F – about 0.05C.

This is a complete joke, and the result of confirmation bias. The National Weather Service reports eight degrees UHI in Phoenix and four degrees in New York. On my bicycle I typically see 5-10 degrees UHI between open space and a nearby neighborhood.

ts.ushcn_anom25_diffs_pg (2)

Posted in Uncategorized | 12 Comments

US Summer Afternoons Cooling For 120 Years – TOBS Has No Effect

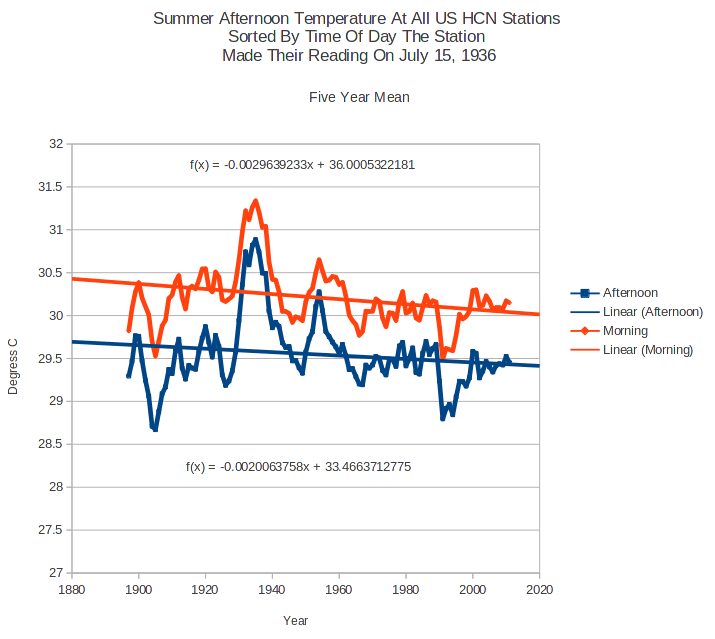
The graph below shows US summer afternoon temperatures since 1895, sorted into two groups based on the time of day when their reading was taken on July 15, 1936.

The time of day data was taken from this 2008 archived USHCN metadata file, which has been deleted from the current USHCN web site.

Archived from : http://cdiac.ornl.gov/ftp/ushcn_monthly/station_history
ScreenHunter_1047 Jul. 17 07.06

Note that both sets of data show the same cooling trend since 1895, and that the 1936 morning recorded stations are cooling slightly faster than the afternoon recorded stations. This is the opposite of the assumptions made by USHCN in their TOBS “correction” – indicating that TOBS adjustment severely corrupts the US temperature record.

Last night I was remembering what I did when I was seven years old, I religiously recorded temperatures on my min/max thermometer and always did the right thing – I reset the maximum in the morning, and reset the minimum in the afternoon. Otherwise the data is tainted. This is the obvious way to avoid TOBS problems, and most likely what many station operators did. In fact you would have to be very stupid and irresponsible to not do something similar.

People have asked why the morning stations are warmer than the afternoon stations. My guess is that people in hotter climates are more motivated to report morning readings than people in cooler climates.

Here is the list of stations used for morning and afternoon readings.

Continue reading

Posted in Uncategorized | 6 Comments

Dictator Obama’s Bill Of Rights Destruction For Today

the Obama administration has banned the import of Saiga (Izhmash & Kalashnikov) firearms in the United States.

BREAKING: Obama Bans Import of Saiga Firearms With Executive Order

Posted in Uncategorized | 20 Comments