Patrick Moore and John Coleman were awesome, but this guy stole the show.
[youtube=https://www.youtube.com/watch?v=AybBEuIpy44]
Patrick Moore and John Coleman were awesome, but this guy stole the show.
[youtube=https://www.youtube.com/watch?v=AybBEuIpy44]
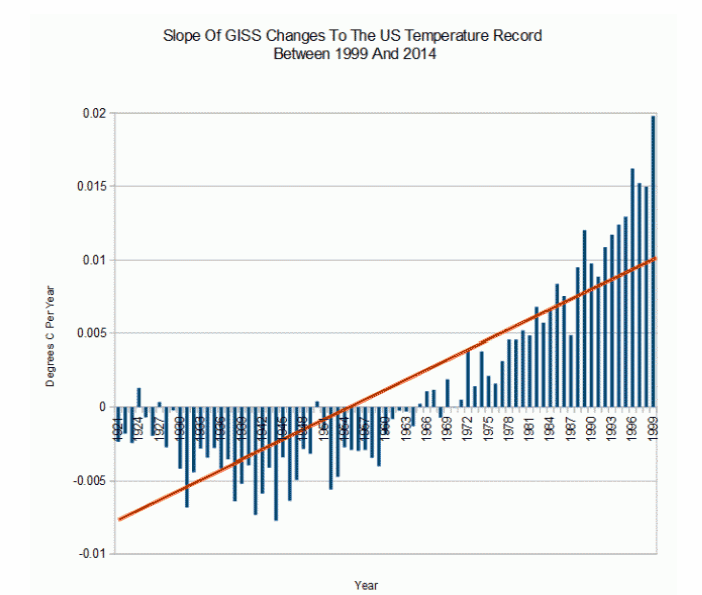
No graph is more damning of NASA/NOAA temperature adjustments than this one. This is the rate of change to the NASA US temperature record since 1999.
On average, 1999 gets 0.02C warmer every year, and the 1940s get about 0.005C colder every year. The pre-1960 past continually gets colder with almost each new NASA data release, and the post-1960 past continuously gets warmer.
If the present refuses to get warmer, then the past must become cooler. How could anyone possibly believe these adjustments are legitimate?
I’m used to working on very difficult problems, like the most complicated electronic circuitry on the planet.
This award was from the IBM/Motorola/Apple Power PC design team in Austin, Texas, which developed the brain of Macs and Playstations for many years.
Microprocessor designs have to be perfect. They can’t make any mistakes, ever. Modern designs contain billions of transistors, and every one of them has to work perfectly – all the time. The way you become a “Debug God” is by analyzing the design through many different approaches. Any single methodology is inadequate and doomed to failure, so I developed and utilized dozens of different methodologies to make sure that no bugs slipped through. During my 20 year career designing microprocessors, no silicon bug was ever found in any part of any design which I worked on.
By contrast, finding flaws with adjustments to the temperature record is like shooting fish in a barrel. The work being done would fail any reasonable high school science class. It is a complete joke, and doesn’t even vaguely resemble science.
The mistake people keep making is using the same broken methodology to verify the original broken methodology. In order to find problems, you need to analyze the data from many different angles.
No methodology is perfect, but a straight up average of raw temperatures is the simplest, cleanest and most effective way to spot trouble. It may be less precise than other methods, but exposes potential fundamental issues related to accuracy. Once you start gridding, adjusting and infilling, you can no longer see the forest for the trees – and you are lost.
[youtube=https://www.youtube.com/watch?v=nvlTJrNJ5lA&feature=kp]
No one makes strikers like Argentina does.
[youtube=https://www.youtube.com/watch?v=lqTsB04M0eE#t=67]
[youtube=https://www.youtube.com/watch?v=jk-kXwjASEE]
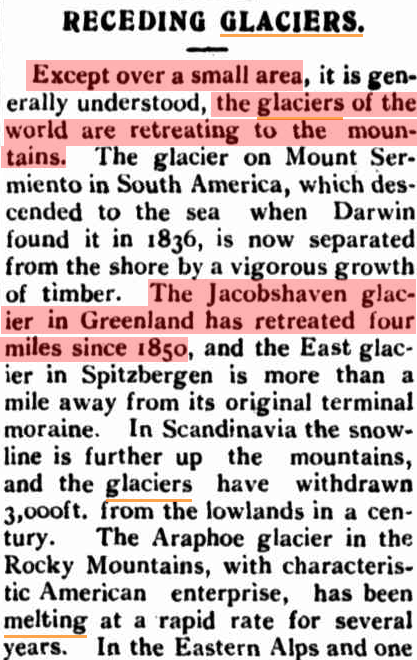
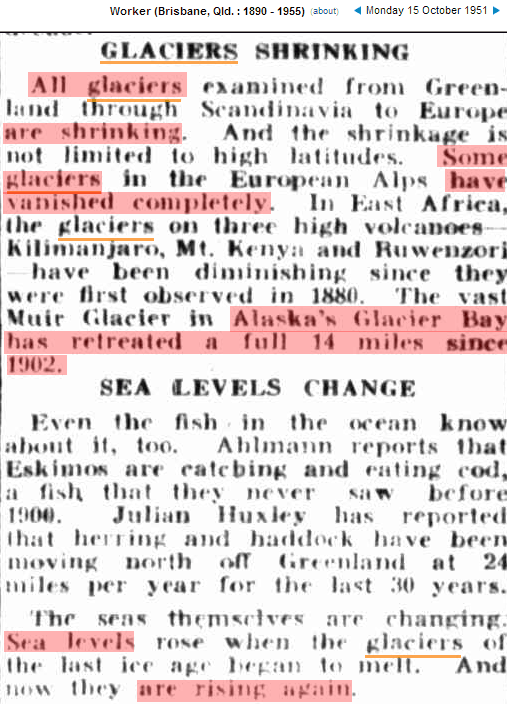
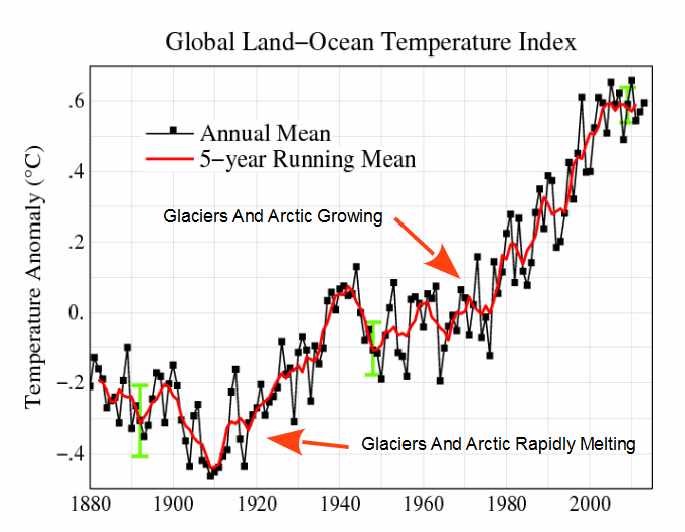
NASA says that 1910 was the coldest year ever, yet almost all of the worlds glaciers were retreating.
The Braidwood Dispatch and Mining Journal Wednesday 28 September 1910
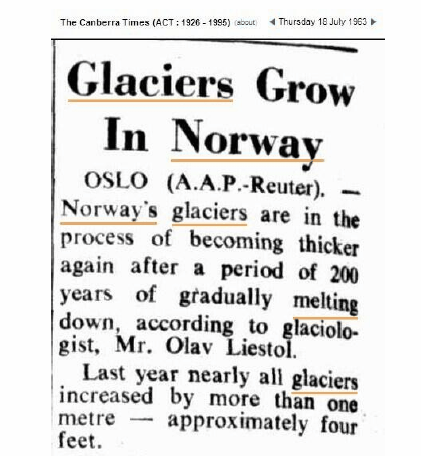
During NASA’s much warmer year of 1963, Norwegian glaciers were growing for the first time in 200 years.
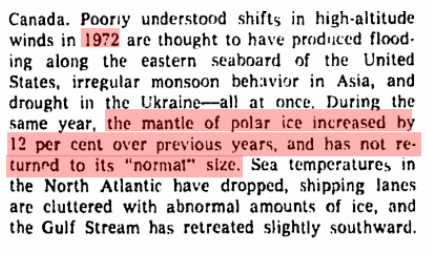
By 1974, Arctic ice had grown 12%.
NASA temperatures are credible, if you have the IQ of a turnip.
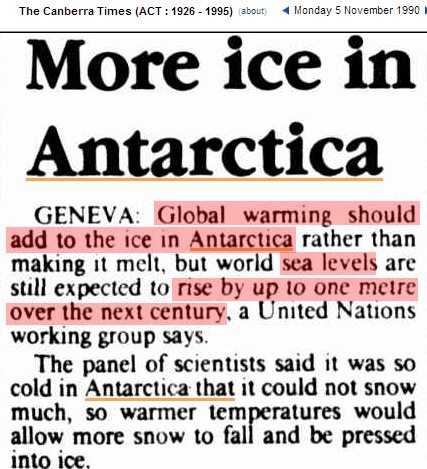
In 1990, brilliant climate scientists said that global warming would cause the Antarctic ice sheet to gain mass, and cause sea levels to rise one metre. (Balancing equations is apparently not part of the climate science curriculum.)