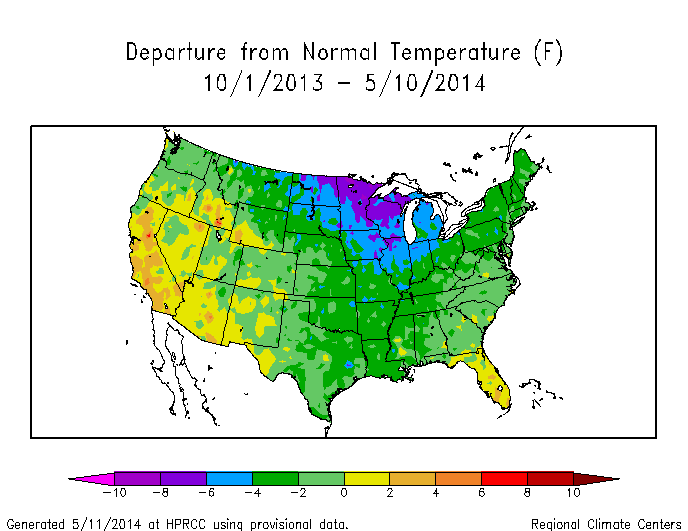
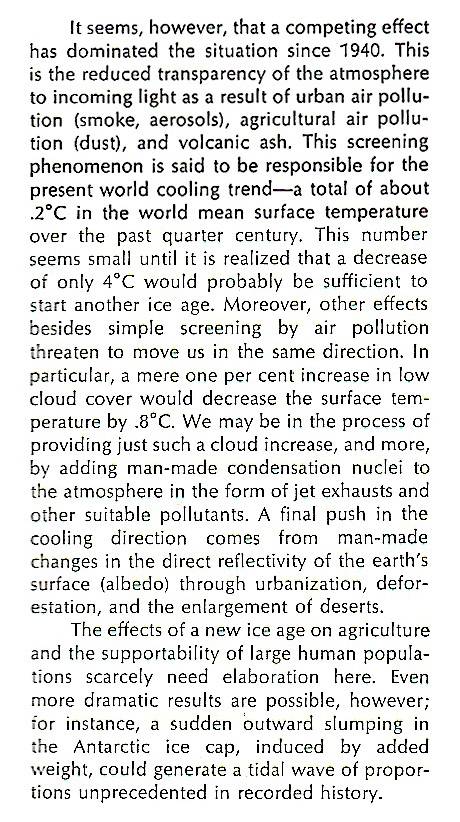
In 1961, there was 100% consensus that the world was cooling.
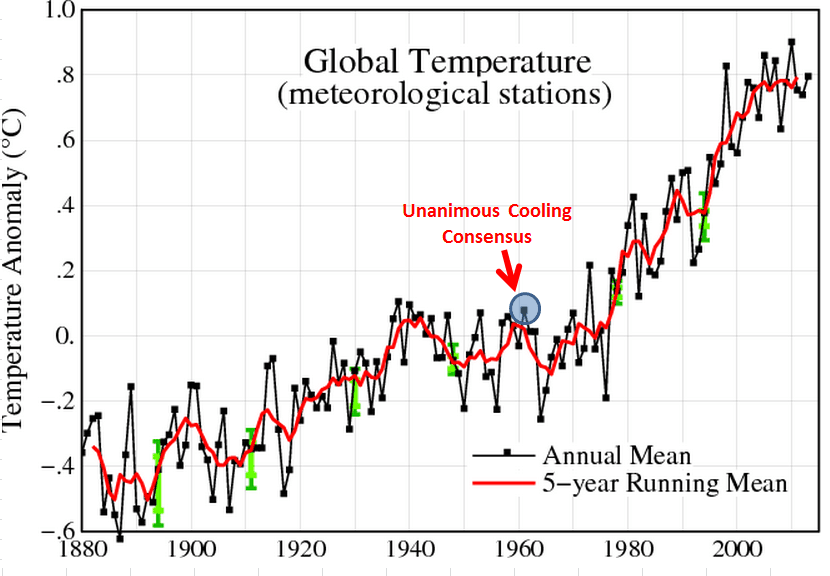
Government scientists now get paid to push warming, so they have erased the inconvenient cooling before 1961.
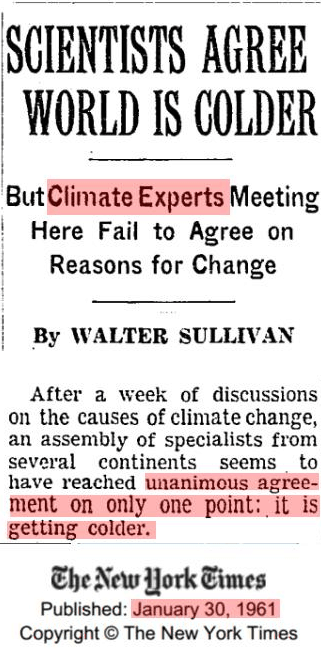
In 1961, there was 100% consensus that the world was cooling.
Government scientists now get paid to push warming, so they have erased the inconvenient cooling before 1961.
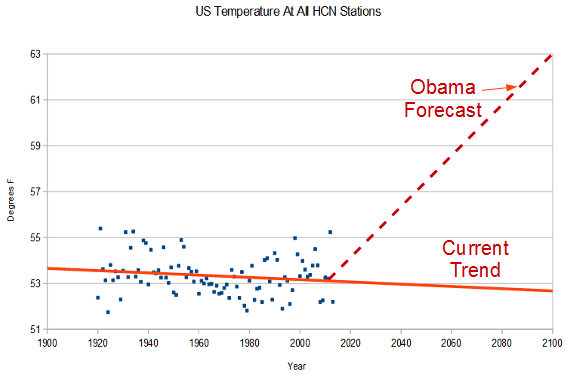
Last week, the White House predicted 10 degrees warming in the US by 2100 – based on top line research from John Holdren.
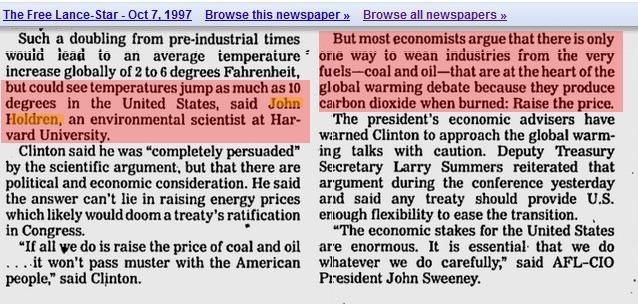
In 1997, Holdren also predicted ten degrees warming
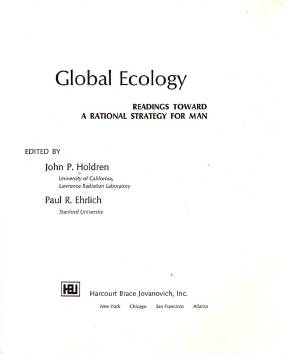
Since he made that forecast in 1997, Earth has warmed 0.0 degrees, meaning we only have ten degrees left to go. This is more in line with Holdren’s 1971 forecast for a new ice age.
In order to become the top scientist in the land, you have to demonstrate conclusively that you are both completely incompetent and a total flake.
Climate experts say that warm water is melting the freshwater ice shelves around Antarctica, causing the salt water to lose salinity, and freeze at a higher temperature.
The logic is simple. The water is warm enough to melt ice shelves at 0C, and is also cold enough to freeze sea water when its freezing point is raised from -3C to -2C.
The main qualification for being a climate expert is having an IQ lower than a turnip.
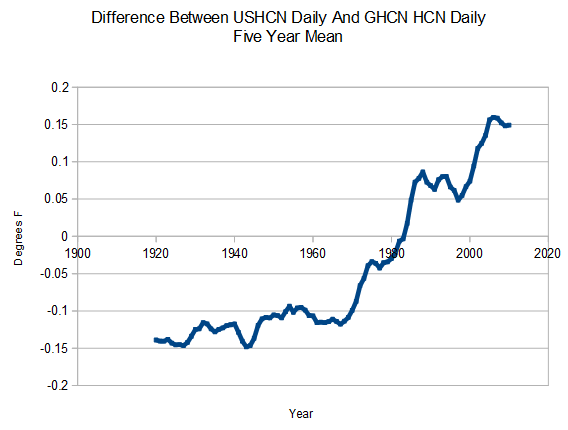
This graph shows the difference between USHCN daily and GHCN HCN daily temperature. USHCN created a hockey stick just by selectively picking US stations which show more warming.
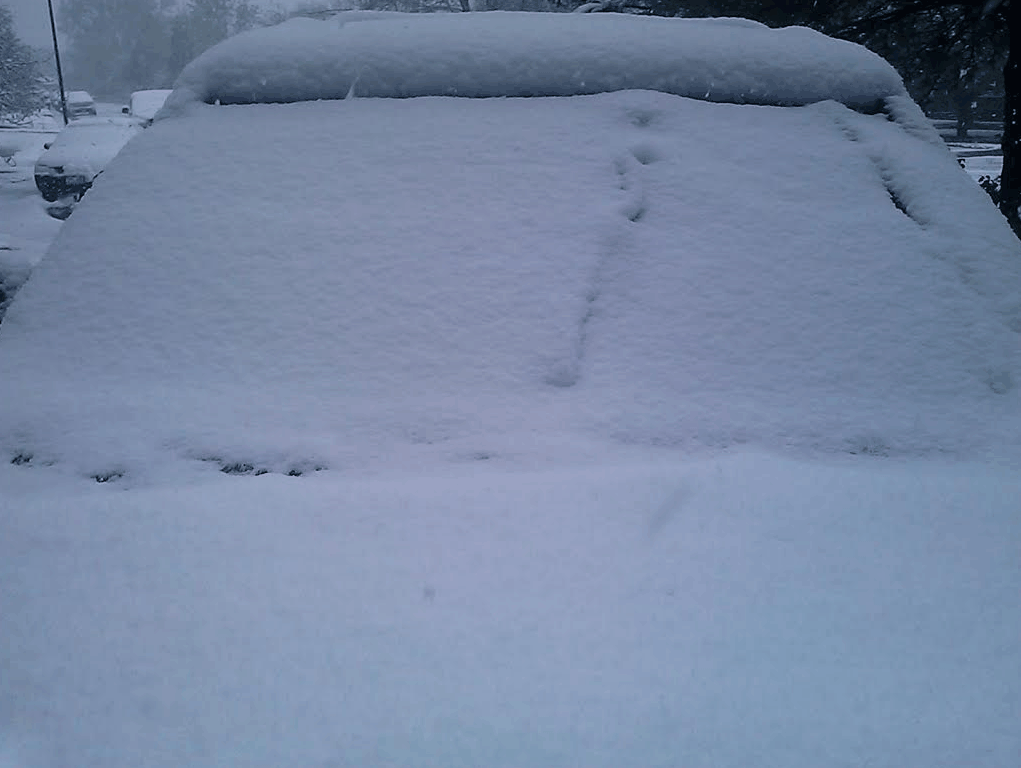
My SUV caused global warming. Global warming melted the Arctic, and made the missing heat sink to the bottom of the sea. This disrupted the Polar Vortex and made it cold and snowy on my SUV in the middle of May.
Only a bitter clinger young earth creationist planet hating flat earther would fail to understand how excess heat causes cold. The President says so. Period.
Earth is not warming any more. The poles are not melting. Sea level rise has not accelerated. Hurricanes are not getting worse. Tornadoes are not getting worse. Heatwaves are not getting worse. Droughts are not getting worse. Every single basis for this scam is complete nonsense.
Global warming has nothing to do with science anymore. It has been hijacked by politicians.
Prof Stavins, Harvard’s Professor of Business and Government, was one of two ‘co-ordinating lead authors’ of a key report published by the UN Intergovernmental Panel on Climate Change (IPCC) earlier this month.
Prof Stavins told The Mail on Sunday yesterday that he had been especially concerned by what happened at a special ‘contact group’. He was one of only two scientists present, surrounded by ‘45 or 50’ government officials.
Three quarters of the original version of the document ended up being deleted.
Top climate expert’s sensational claim of government meddling in crucial UN report | Mail Online
I wonder why journalists like Andy Rekvin continue to pretend this is something other than a massive scam.
Obama’s choice of associates speaks volumes about his intelligence.
Biden, Kerry, Holdren, McCarthy, etc.
None of these people have the mental capacity to hold any kind of real job, much less be in the White House.
As mentioned earlier, I changed my USHCN methodology to match my GHCN methodology – averaging by month for all stations, and then averaging all months for the year. This fixed the discrepancy between my 2014 spike and Anthony’s.
Nick Stokes keeps talking about anomalies, which are necessary when trying to do an absolute comparison of partial years. I wasn’t attempting to do that – I was measuring temperature differences, so his point is irrelevant to what I am doing.
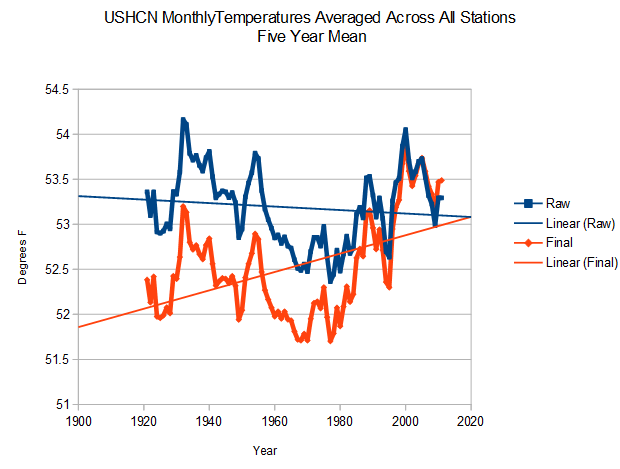
Here are the USHCN final and raw temperatures using the new method. It is almost identical to the old method. They are turning a 95 year cooling trend into a warming trend.
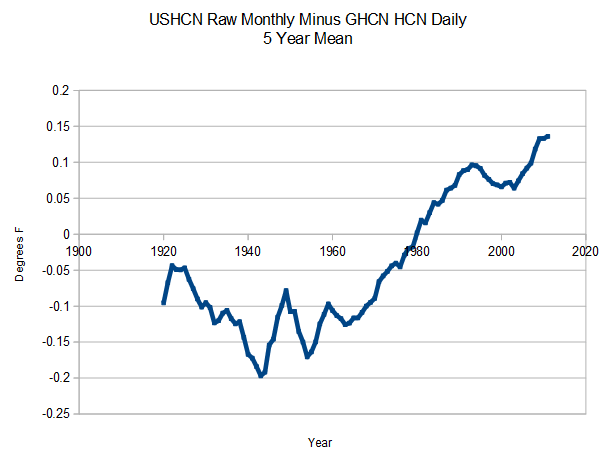
But it is worse than seems. The USHCN “raw monthly data” isn’t really raw. The graph below shows the discrepancy between GHCN monthly “raw” and actual GHCN HCN daily station data – which is truly raw. As you can see, USHCN “raw” data is already adjusted to create a warming trend, and then they do their own adjustments on top of that.
The next graph shows the total adjustments from GHCN HCN daily to USHCN final.
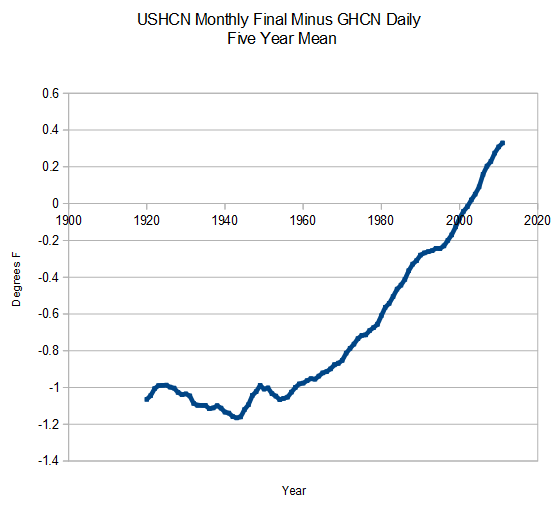
But it is worse than even that seems. NCDC adds additional warming on to the USHCN adjustments. Unfortunately their web site is dead, so I can’t generate that graph right now.