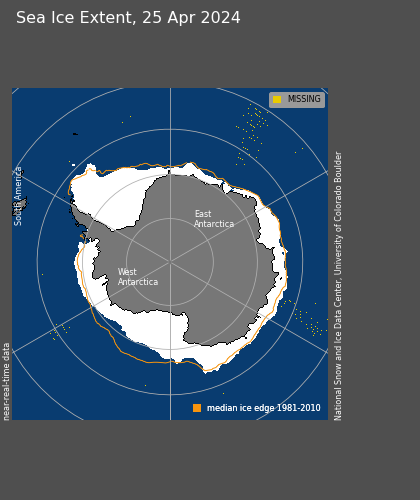
As Antarctic sea ice area soars to record highs, the geniuses at Time Magazine say that penguins are threatened by melting sea ice.

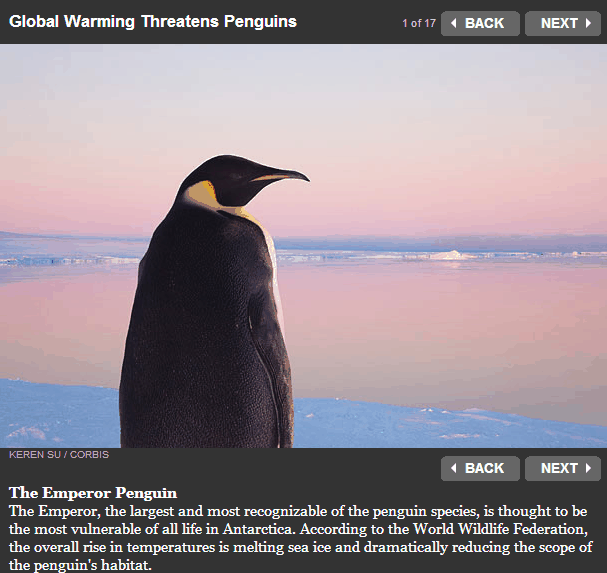
http://content.time.com/time/photogallery/0,29307,1938690_1988641,00.html
As Antarctic sea ice area soars to record highs, the geniuses at Time Magazine say that penguins are threatened by melting sea ice.
http://content.time.com/time/photogallery/0,29307,1938690_1988641,00.html
One of the standard claims of global warming hysterics, is that global warming makes DC cherry blossoms bloom earlier. Sadly for them, the past two years were both very late – and only the volcano cooled year of 1993 beat 2014, by one day.
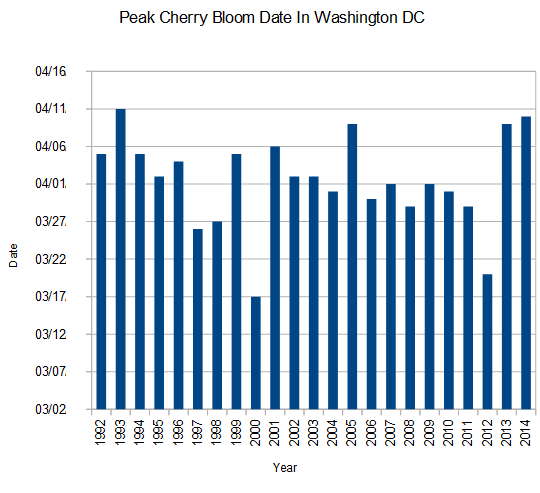
http://www.nationalcherryblossomfestival.org/about/bloom-watch/
In 2005, hurricane expert and National Hurricane Center Science Officer Chris Landsea, quit the IPCC over bogus claims Trenberth made – which were in direct conflict with the actual science.
January 17, 2005
Shortly after Dr. Trenberth requested that I draft the Atlantic hurricane section for the AR4’s Observations chapter, Dr. Trenberth participated in a press conference organized by scientists at Harvard on the topic “Experts to warn global warming likely to continue spurring more outbreaks of intense hurricane activity” along with other media interviews on the topic. The result of this media interaction was widespread coverage that directly connected the very busy 2004 Atlantic hurricane season as being caused by anthropogenic greenhouse gas warming occurring today. Listening to and reading transcripts of this press conference and media interviews, it is apparent that Dr. Trenberth was being accurately quoted and summarized in such statements and was not being misrepresented in the media. These media sessions have potential to result in a widespread perception that global warming has made recent hurricane activity much more severe.
I found it a bit perplexing that the participants in the Harvard press conference had come to the conclusion that global warming was impacting hurricane activity today. To my knowledge, none of the participants in that press conference had performed any research on hurricane variability, nor were they reporting on any new work in the field. All previous and current research in the area of hurricane variability has shown no reliable, long-term trend up in the frequency or intensity of tropical cyclones, either in the Atlantic or any other basin. The IPCC assessments in 1995 and 2001 also concluded that there was no global warming signal found in the hurricane record.
Over the past 10 years it appears that Trenberth’s misbehavior has gotten even worse. Now he just skips the science and goes directly to the politics.
I have made quite a few updates to my GHCN code, which is primarily targeted at the US HCN database – though it will work with any GHCN data set. The release includes seven files, compressed into file ghcn.tgz
getdaily GHCN.cpp GHCN.h ghcnd-stations.txt Main.cpp Makefile stations.txt
getdaily is a tcsh script for downloading and organizing the latest HCN daily temperature database from NOAA. It takes about an hour to run over a very fast link. It generates 49 .txt files – one for the US and one for each of Obama’s 57 states.
The code is C++ and consists of three files : Main.cpp GHCN.cpp GHCN.h. It should compile without warnings on g++ or Visual Studio compilers. The Makefile works on any gnu system, like Linux. On Cygwin, the suffix “.exe” gets added. To use Visual Studio, you will have to create a project and import the three code files.
There are a lot of new options
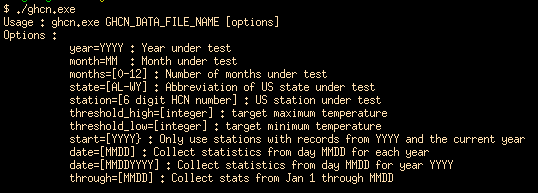
stations.txt must be in the same directory as the executable. Typical usage would be
./ghcn.exe NY.txt > NY.csv
That reads all NY records and outputs the results to a NY.csv file
The rest comes in the category of “either you can figure it out now, or you need two years of education to figure it out”
My critics will enjoy looking through this and seeing that (unlike them) I am not doing anything to bias the output data one way or another. That is because (unlike them) I am an actual scientist – and an honest person.
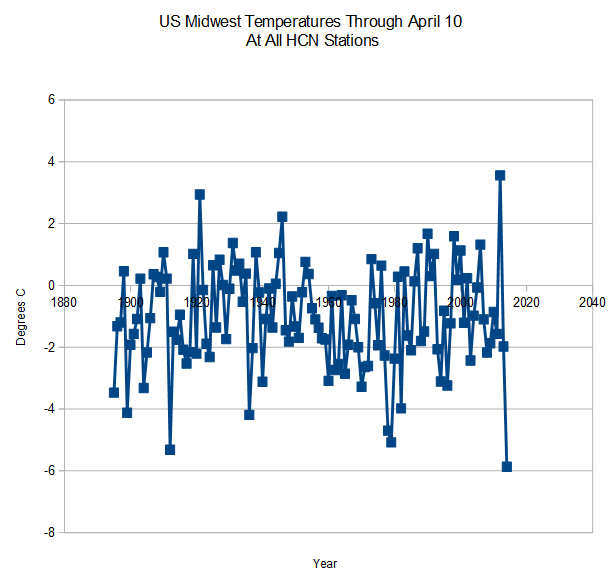
Midwest temperatures through April 10 have been the coldest on record so far, with lots more cold in the forecast for the rest of the month.
The leaves are just starting to come out on the trees, and we are expecting 10 inches of very heavy, wet snow today. This means broken branches everywhere.
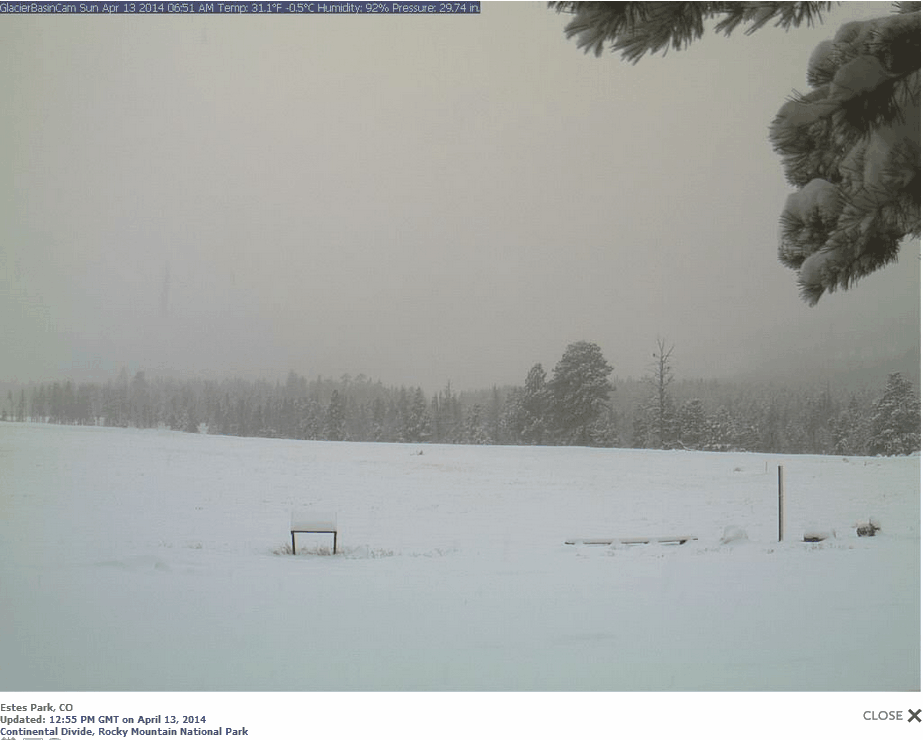
http://www.wunderground.com/webcams/index.html?qlat=39.26628426150451&qlon=-96.94335937&qzoom=4
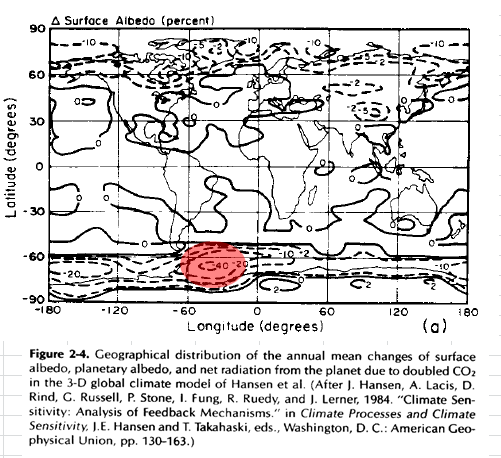
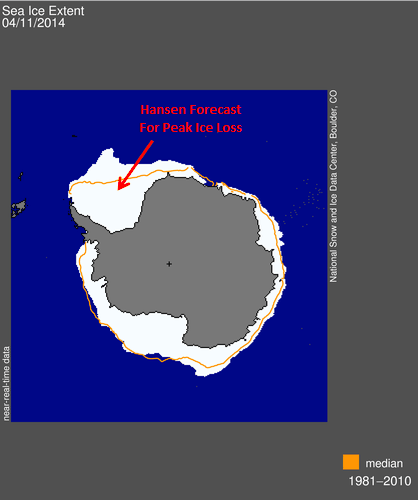
James Hansen has made many forecasts over the last 30 years, with close to 0% success rate. Betting on the opposite of what he predicts, is almost a sure thing. Thirty years ago he forecast peak sea-ice loss (40%) in the Weddell Sea of Antarctica.
http://www.epa.gov/climatechange/effects/downloads/Challenge_chapter2.pdf
So how did that forecast work out? The Weddell Sea is where the peak sea ice gain has occurred. The exact opposite of what Hansen forecast.
http://nsidc.org/data/seaice_index/images/daily_images/S_daily_extent.png
Climate scientists are certain that recent global warming is caused only by man, and can not occur naturally.
Odds that global warming is due to natural factors:slim to none
Saturday, April 12, 2014
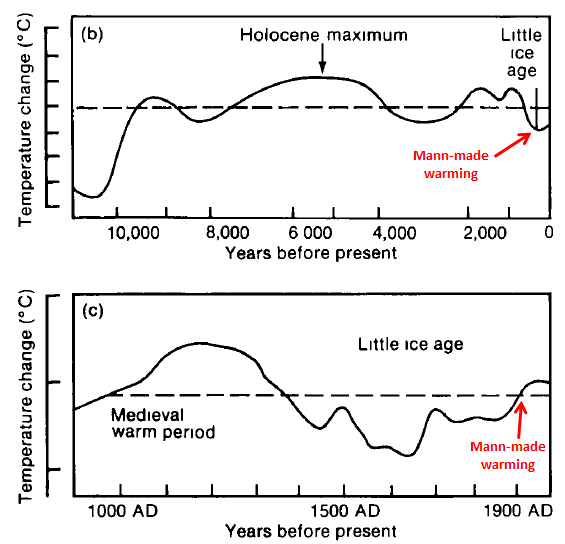
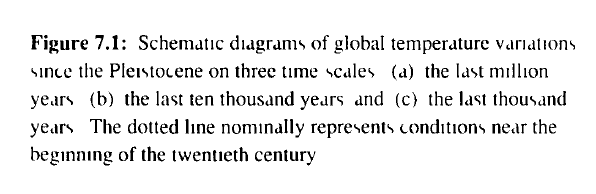
The graphs below are taken from the 1990 IPCC report, and annotate what the author claims is unequivocal proof of Mann-made global warming.
Now let’s look at ice core data, where recent warming is completely invisible in a background of 14C temperature swings.
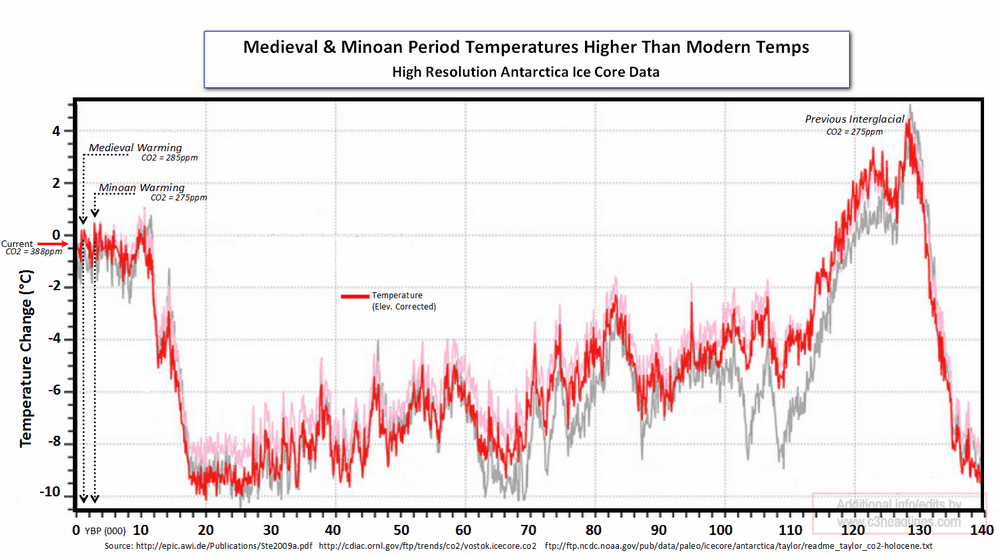
The new normal for climate scientists is to fabricate nonsensical reports containing zero science, and to assert very high degrees of certainty.
h/t to Dave G
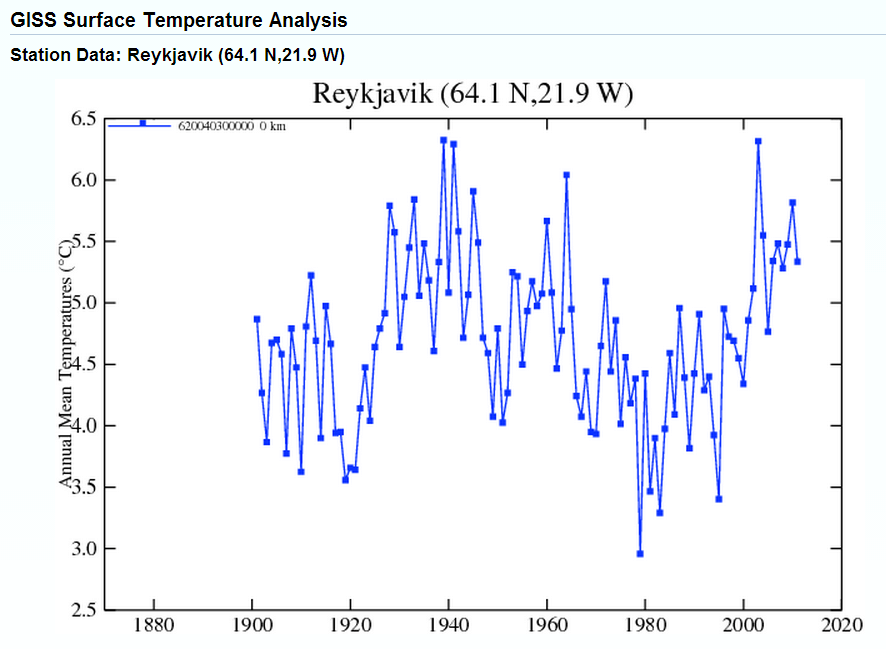
As of 2011, NASA showed a large spike in eastern Arctic temperatures around the year 1940
http://data.giss.nasa.gov/cgi-bin/gistemp/show_station.cgi?id=620040300000&dt=1&ds=1
During the previous year, climategate scientists discussed their desire to get rid of the 1940s spike
From: Tom Wigley <[email protected]>
To: Phil Jones <[email protected]>
Subject: 1940s
Date: Sun, 27 Sep 2009 23:25:38 -0600
Cc: Ben Santer <[email protected]>It would be good to remove at least part of the 1940s blip, but we are still left with “why the blip”.
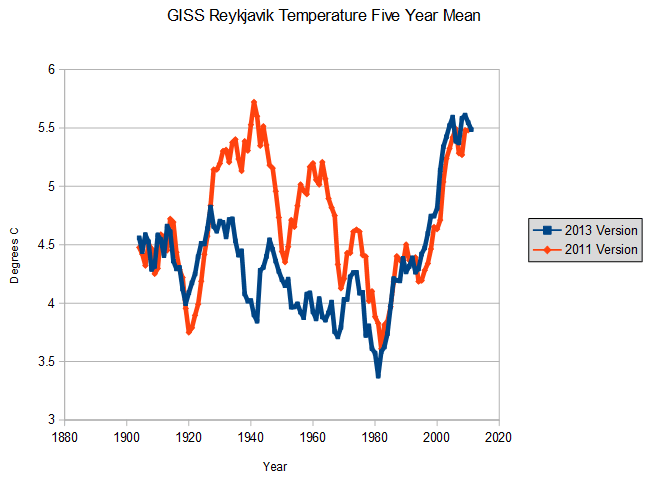
By 2013, they had done exactly what they wanted to – removed the 1930s-1940s blip
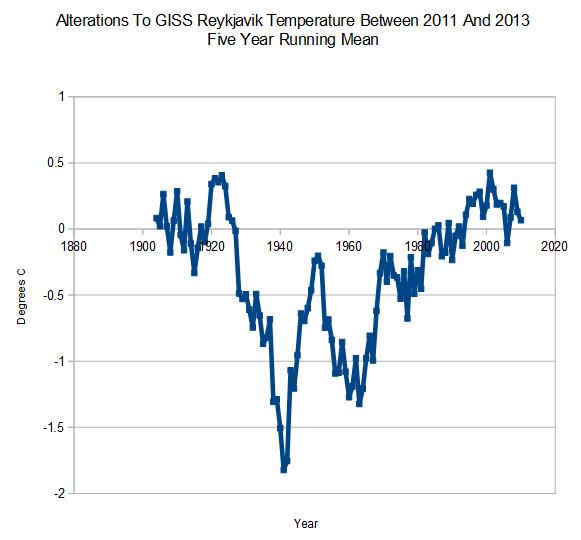
They accomplished this by an impressive 2 degrees (3.6F) of data tampering, lowering 1940 temperatures and increasing present temperatures.
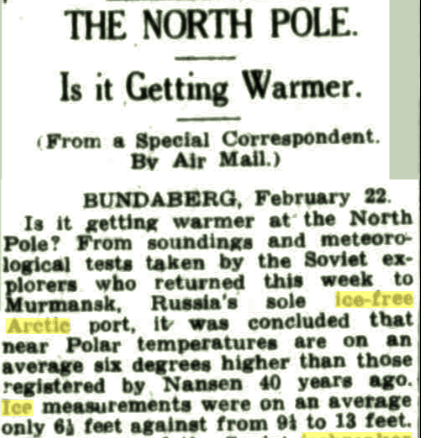
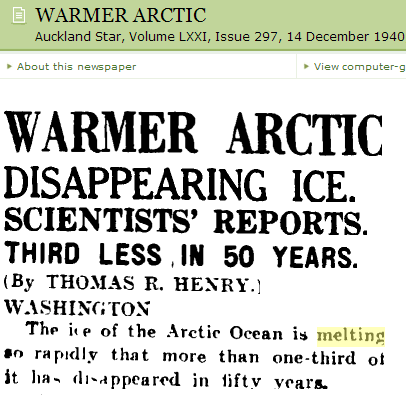
So were the Climategate scientists justified in removing the 1940s Arctic spike? Scientists in 1940 reported 6C warming and rapidly disappearing ice. The warming was real, and modern climate scientists are trying to rewrite history.
Papers Past — Auckland Star — 14 December 1940 — WARMER ARCTIC
Today, the IPCC says greenhouse gases have accelerated to unprecedented levels and are going to overheat the atmosphere and kill us all.
April 13, 2014
A rapid shift to less-polluting energy will be needed to avoid catastrophic global warming because global emissions of heat-trapping greenhouse gases have accelerated to unprecedented levels, the United Nations reports today.
http://www.usatoday.com/story/news/nation/2014/04/13/ipcc-report-touts-clean-energy/7593073/
Five months ago, the story was the exact opposite. The lack of global warming was due to a slowdown in greenhouse gas buildup.
Nov. 10, 2013
Climate deniers like to point to the so-called global warming “hiatus” as evidence that humans aren’t changing the climate. But according a new study, exactly the opposite is true: The recent slowdown in global temperature increases is partially the result of one of the few successful international crackdowns on greenhouse gases
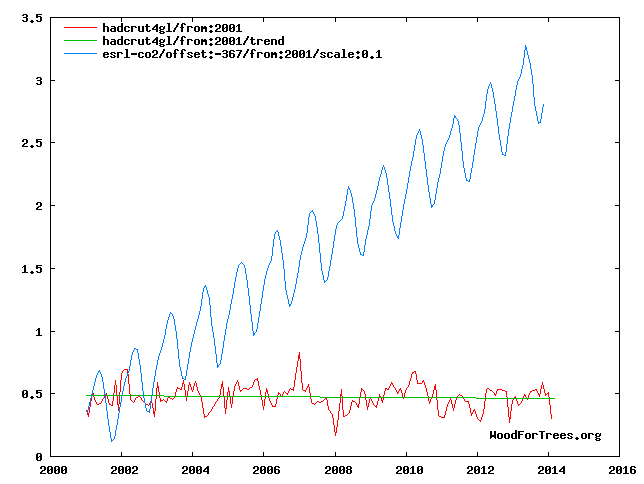
The real story is that greenhouse gases continue to increase, while temperatures continue to decrease. Indicating that their theory is broken.
This madness is being driven by people completely devoid of integrity.
It doesn’t make any difference how smart you are, who made the guess, or what his name is. If it disagrees with experiment, it’s wrong. That’s all there is to it.
– Richard Feynman