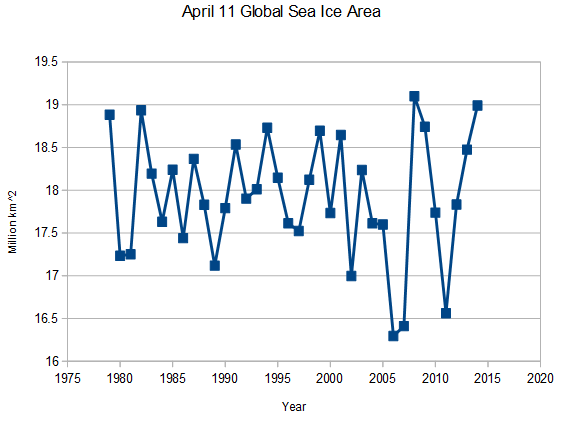
http://arctic.atmos.uiuc.edu/cryosphere/timeseries.global.anom.1979-2008
Disrupting the Borg is expensive and time consuming!
Google Search
-
Recent Posts
- Vandalism At The Reflecting Pool
- Fifty Years Ago Today
- Truth Or Consequences
- US Climate Trend Maps
- Declining Spring Snow Cover In Northern New Mexico
- You Can’t Fool Mother Nature
- Cattle And The Climate
- One Atomic Bomb Per Hour
- New Video : Analyzing Oil And Gas
- Is Antarctica Melting?
- High Speed Analysis And Visualization
- El Nino To The Rescue?
- Fake News Update
- Growth Of Antarctic Sea Ice
- 65 Years Of Progress!
- El Nino To The Rescue?
- Worst March Drought On Record
- ChartGL Process Control Demo
- The Biggest Money Laundering Scam
- Drought In The Headwaters Of Lake Powell
- Unrealistic Expectations Of Water Availability
- Did Bill Gates Do This?
- Worst March Drought On Record In The US
- The Real Hockey Stick Graph
- Analyzing The Western Water Crisis
Recent Comments
- Robertvd on Fifty Years Ago Today
- Chuck on Truth Or Consequences
- Gerald Machnee on Fifty Years Ago Today
- conrad ziefle on Fifty Years Ago Today
- Bob G on Truth Or Consequences
- Weylan McAnally on One Atomic Bomb Per Hour
- conrad ziefle on Declining Spring Snow Cover In Northern New Mexico
- Bob G on You Can’t Fool Mother Nature
- Ivan G Wainwright on You Can’t Fool Mother Nature
- conrad ziefle on You Can’t Fool Mother Nature


Wither the death spiral.
Why does your data different from this site’s which shows it below the avg.?
https://nsidc.org/arcticseaicenews/
Global sea ice area.
They measure several different parameters. Which ever one can grab the headlines as “Oh My, God, I’m MELTING…” gets the press.