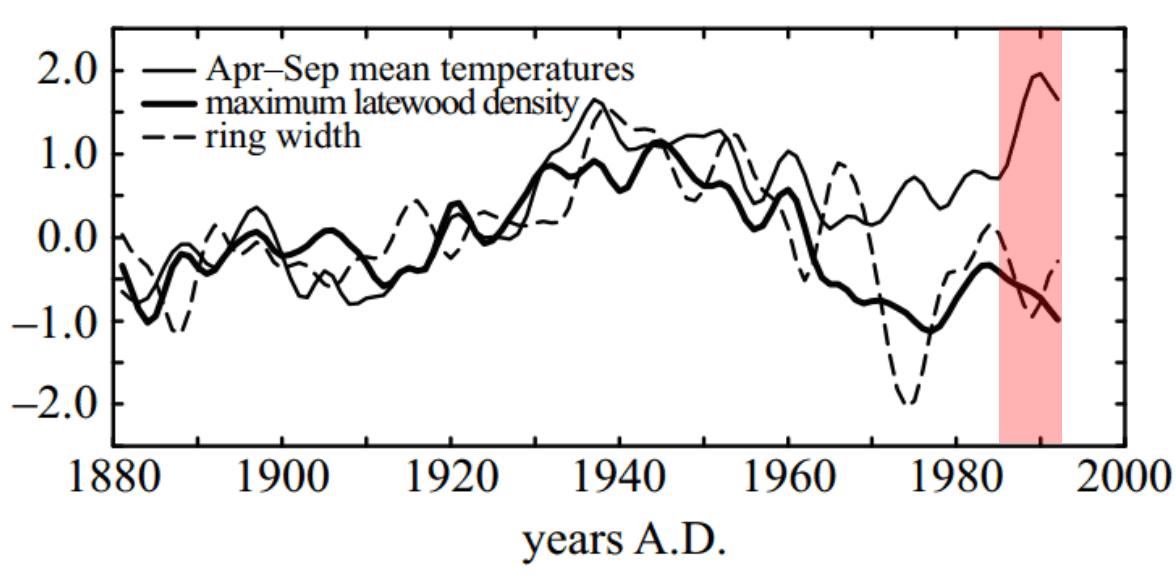
In Briffa, 1998 – he reported that an apparent post-1960 divergence between tree ring density (thick solid line) and surface data (thin solid line) was likely due to some unknown anthropogenic effect like CO2 or acid rain.
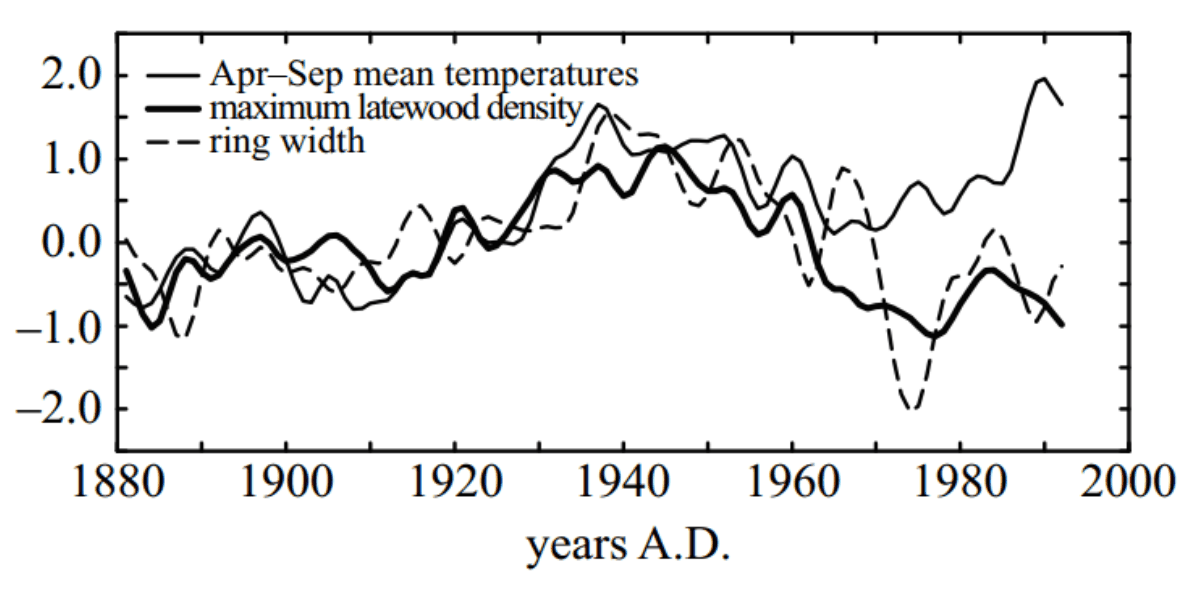
eas8001.eas.gatech.edu/papers/Briffa_et_al_PTRS_98.pdf
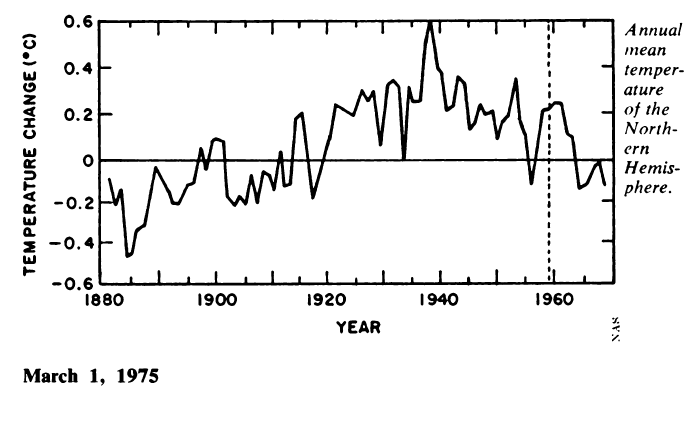
He was correct that it was a Mann-made problem, but it had nothing to do with the trees or the “ecology.” The problem was that the surface data had been altered. The temperature graph below is from the 1975 National Academy of Sciences, and shows a 0.5C drop in temperature after 1940, and a large drop from 1960 to 1965.
The next graph overlays the 1975 temperature data (red) on Briffa’s tree ring data. (Note that the scale on the left of Briffa’s graph is not degrees C.)
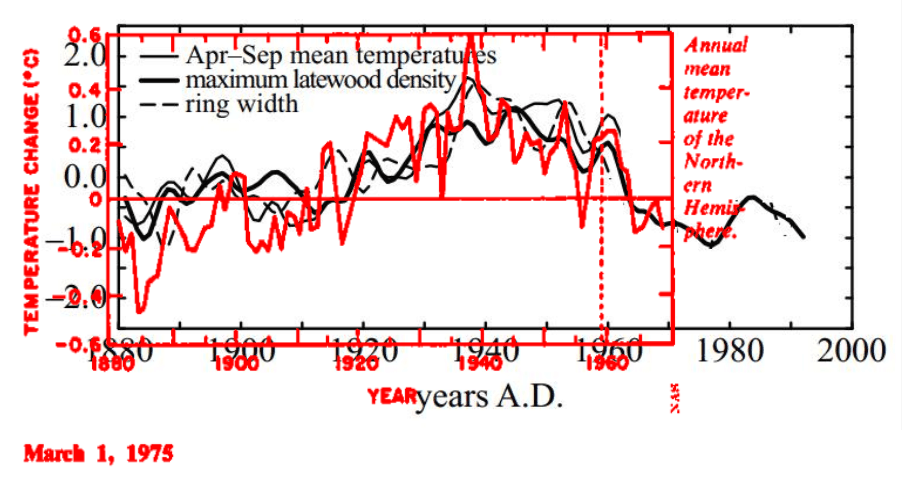
Note that there isn’t any post-1960 divergence. The divergence only appeared in later NOAA/NASA data.
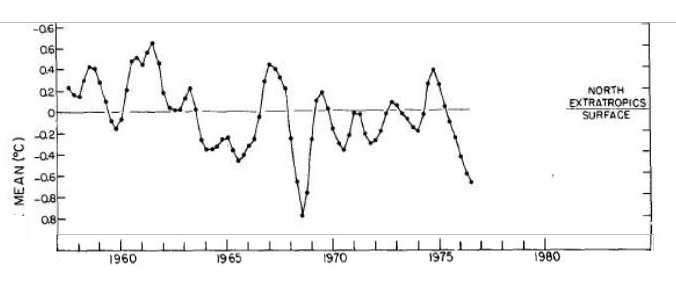
In 1978, NOAA was still reporting a 0.5C drop in temperature from 1960-1965, and a large drop from 1958-1976.

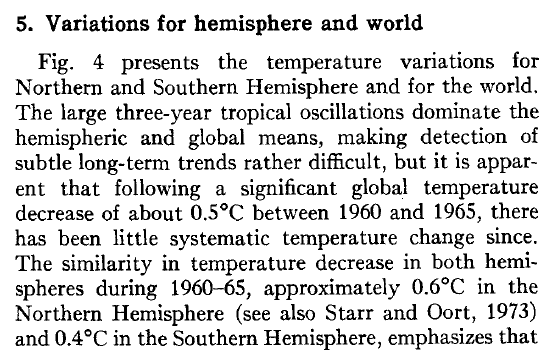
journals.ametsoc.org/doi/pdf/10.1175/1520-0493(1978)106<0755%3AGTVSMA>2.0.CO%3B2
But at some point later on, NOAA and NASA made the drop in temperatures nearly disappear. Now let’s look at the divergence between 1985 and 1992, the end of Briffa’s data. Briffa showed a small decline, while the “thermometer data” showed a large increase.
Which one was correct? Satellite data shows that the tree rings were correct. Mt. Pinatubo erupted in 1991, causing a major cooling which was not seen in the fake surface temperature data.
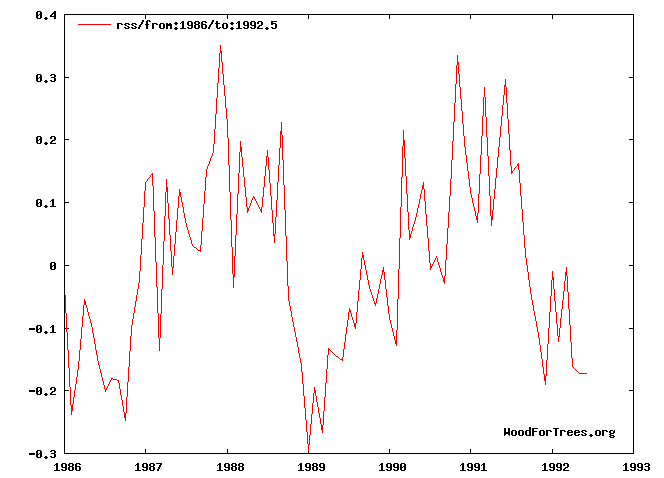
Wood for Trees: Interactive Graphs
The “divergence” is due to data tampering by the hockey team, not some inexplicable change in tree behavior which magically occurred in 1960. This tampering led to the hockey stick and 15 years of wildly corrupt, irrational science.
In a rational field of science, people would suspect the half dozen data tamperers, rather than the 50 trillion trees.