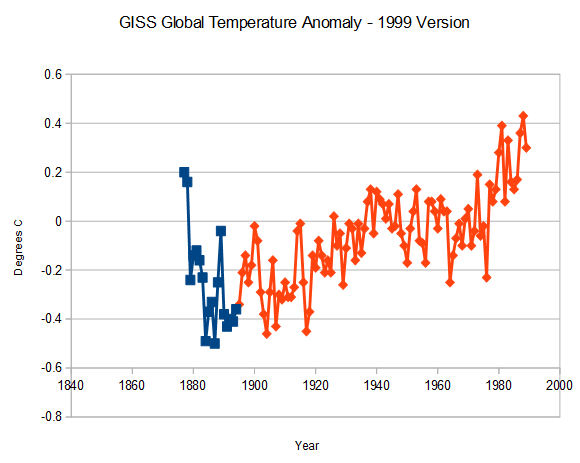
Graph below overlays GISS 1999 version in blue, on current GISS in red. Normalized to 1998.
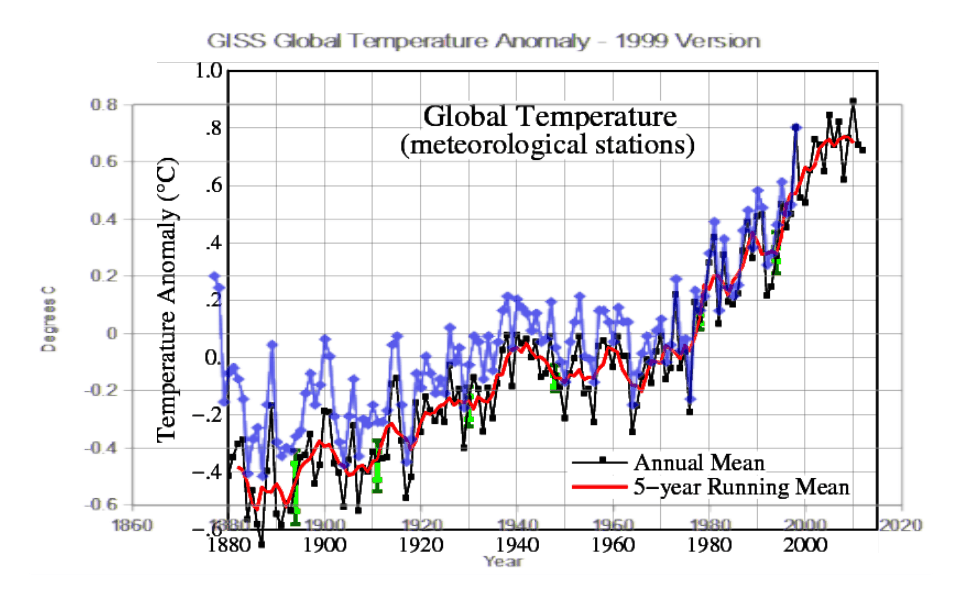
web.archive.org/web/19990220235952/http://www.giss.nasa.gov/data/gistemp/GLB.Ts.txt
Graph below overlays GISS 1999 version in blue, on current GISS in red. Normalized to 1998.
web.archive.org/web/19990220235952/http://www.giss.nasa.gov/data/gistemp/GLB.Ts.txt
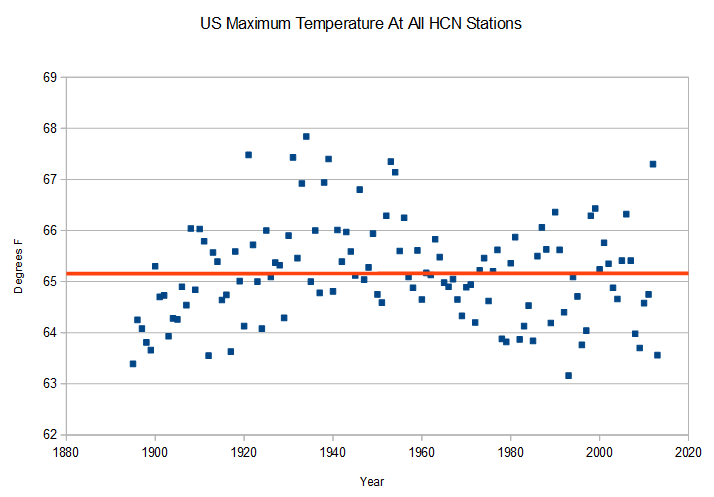
There has been no trend in US afternoon temperatures since 1895, and 2013 had the fourth coldest afternoon temperatures on record. The 1920’s through 1950’s were hottest.
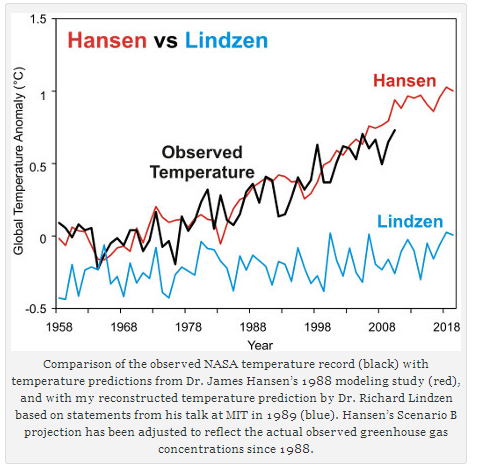
Willis Eschenbach dug up a report on Lindzen’s 1989 speech, which Dana used to create his fake “Lindzen” forecast. Lindzen was criticizing the integrity of the temperature record, not making a forecast.
Here is the 1989 report.
]]]]]]]]] LINDZEN CRITICAL OF GLOBAL WARMING PREDICTION [[[[[[[[
(10/17/1989)
by Eugene F. Mallove
M.I.T. TECH TALK, 9/27/1989Dire predictions of global warming through the greenhouse effect were roundly criticized last week by Professor Richard Lindzen of the Department of Earth, Atmospheric and Planetary Sciences.
“I argue that the greenhouse effect does not seem to be as
significant as suggested.” Professor Lindzen said. He spoke last
week before an audience of 250 scientists at the Alexander von
Humboldt Foundation Colloquium at Kresge Auditorium.“I personally feel that the likelihood over the next century of greenhouse warming reaching magnitudes comparable to natural variability seems small,” he said. “And I certainly feel that there is time and need for research before making major policy decisions.”
Professor Lindzen characterized the question of possible global
warming as “a region in which the uncertainty is vast.” He then
proceeded systematically to expose major difficulties with projections of global climate.Has warming already occurred?
What does the temperature record already show about global
warming? Do the data conclusively indicate about one-half degree centigrade (plus or minus 0.2 degree) global warming over the last century, as some proponents suggest? No, contends Professor Lindzen.Professor Lindzen cited many problems with the temperature
records, an example being the representation of the Atlantic Ocean with only four island measurement sites. Urbanization also creates problems in interpreting the temperature record, he said. There is the problem of making corrections for the greater inherent warming over cities–in moving weather stations from a city to an outlying airport, for example.“The trouble with many of these records,” he said, “is that the
corrections are of the order of the effects, and most of us know that when we’re in that boat we need a long series and great care to derive a meaningful signal.”Nor, he said, was the temperature data collected in a very
systematic and uniform way prior to 1880, so comparisons often begin with temperatures around 1880. “The trouble is that the earlier data suggest that one is starting at what probably was an anomalous minimum near 1880. The entire record would more likely be saying that the rise is 0.1 degree plus or minus 0.3 degree.”He referred to MIT Professor Reginald Newell’s work that suggests that between the 19th century and the present there appears to be no change in ocean surface temperatures. Moreover, the record for the 48 contiguous states shows no evidence for warming over the past century.
“As far as the data goes, I would argue that we really don’t have the basis for saying it’s a half degree plus or minus 0.2. That is false use of science. What we have is data that says that maybe it occurs, but it’s within the noise.”
Lindzen’s analysis precisely agreed with published temperature data, which showed about 0.1C warming from the mid 1870’s to 1989, and swings in natural variability of 0.7C.
web.archive.org/web/19990220235952/http://www.giss.nasa.gov/data/gistemp/GLB.Ts.txt
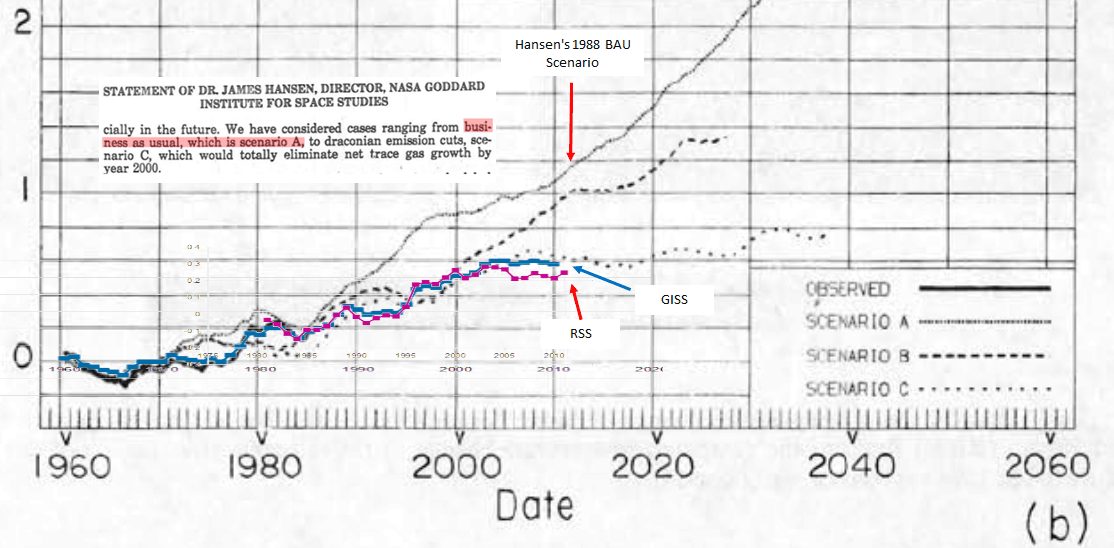
Why does the Guardian continue to publish Dana’s blatantly fraudulent writing? Not only was Dana’s “Lindzen” forecast fake, but his representation of the data did not even vaguely represent reality. None of the temperature data sets are anywhere near Scenario B.
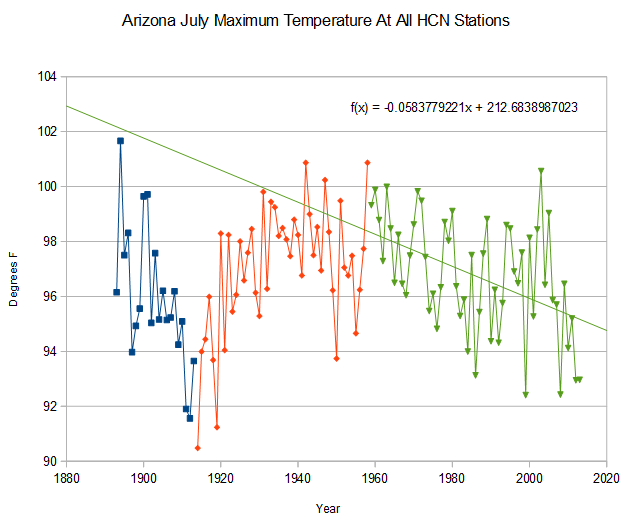
Arizona July maximum temperatures have been plummeting since the 1960’s.
The Superbowl is being played on February 2. On that date in 1961, New Jersey was on the chilly side.
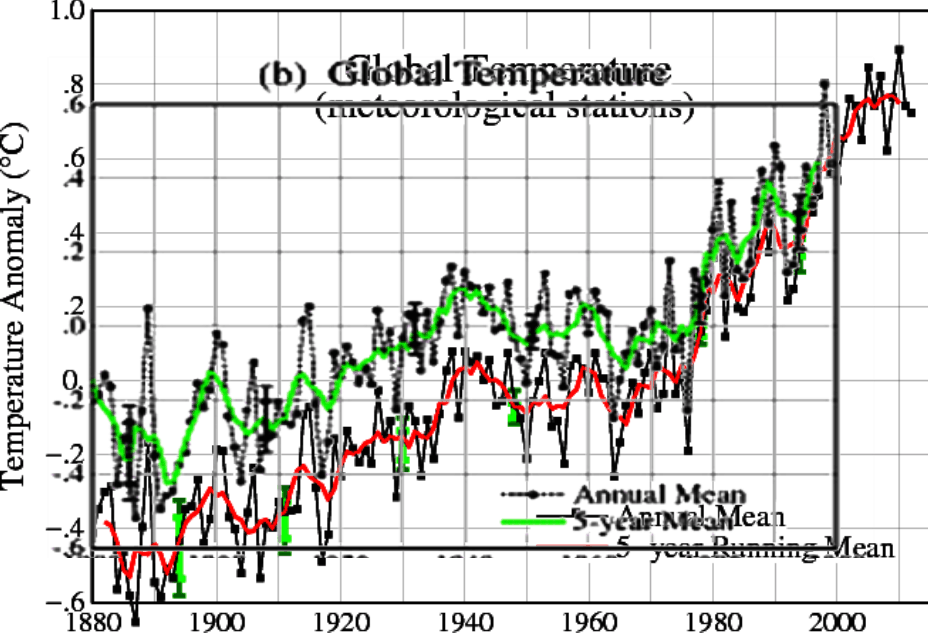
Green below is the 1999 version of GISS global station data. Red is the 2014 version, normalized to 1998.
NASA GISS: Science Briefs: Whither U.S. Climate?
NASA has done some impressive work corrupting the global temperature record over the last 15 years. Kudos to them!
Until yesterday I believed that CO2 was the most powerful force in the universe. But I have been educated since then that the exponential growth of CO2 since 1988 is not important. The climate is now controlled by CFC’s, which have increased by less than the 0.0000000005 mole fraction Hansen expected.