How To Identify A Crook

A crook tells you that the planet is overheating, the polar icecaps are melting, and that it will be the greatest calamity of all time unless you give them money – but when presented with evidence that the calamity isn’t happening – they get very upset.

That is a strange way to react to the best news ever.

Posted in Uncategorized | 6 Comments

Some Native Coloradans Share Their Thoughts This Evening

[youtube=http://www.youtube.com/watch?v=tygh4jRY4Ck]

Posted in Uncategorized | 1 Comment

Joke Of The Hour

The same people who were predicting an ice-free Arctic a few weeks ago, are now righteously indignant over whether the ice gain was 60% or 67% since last year.

Difficult to keep up with the constant comedy they provide.

Posted in Uncategorized | 8 Comments

Obama Restores Foreign Relations To The Former Glories Of The Carter Era

ScreenHunter_645 Sep. 16 18.54

an impressive naval operation, widely covered in the Russian media, that saw a task force of ten warships and nuclear-powered icebreakers complete a 2,000-mile patrol across the formerly ice-bound coastline. The flotilla was led by the flagship of Russia’s northern fleet, the guided-missile cruiser Peter the Great.

For first time since Cold War, Russian navy sets up permanent Arctic presence | Alaska Dispatch

Posted in Uncategorized | 6 Comments

How Fast Can Professional Climate Fraudsters Spin A Story?

This article was published three weeks ago

Flooding? In 1965, Colorado got nailed By Barry Noreen

Published: August 17, 2013

Has it really been that wet? As often as it has rained this summer and as much tragedy and damage have been wrought by flooding, precipitation for Colorado Springs for the year to date is about 11 inches. On average, 12.4 inches of precipitation fall by this date.

In 1965, it rained more than 12 inches in one day – two days in a row in some places. The history puts this summer’s flooding in perspective.

On June 17, 1965, an estimated 14 inches of rain fell in Falcon. Along the Palmer Divide, the same slow-moving storm dropped 12 inches in just three hours. The day before, nearby Larkspur and Palmer Lake received 14 inches of rain in four hours.

Similar biblical rainfall occurred elsewhere along the Front Range. The ground was so saturated that the flooding became catastrophic on both sides of the Palmer Divide. The flooding in Colorado Springs and Denver was so severe it’s described in a report prepared by the National Center for Atmospheric Research, which provided an overview of the six-day period between June 14-20, 1965: “The flood reached the South Platte River and the metropolitan areas of Denver by about 8 p.m. on June 16. The floodwaters spread to a half-mile or more in width. The peak discharge of the South Platte at Denver was 183 percent of the previous maximum during 67 years of record and historical information indicates that the 1965 discharge was the greatest since at least 1844.”

Flooding? In 1965, Colorado got nailed

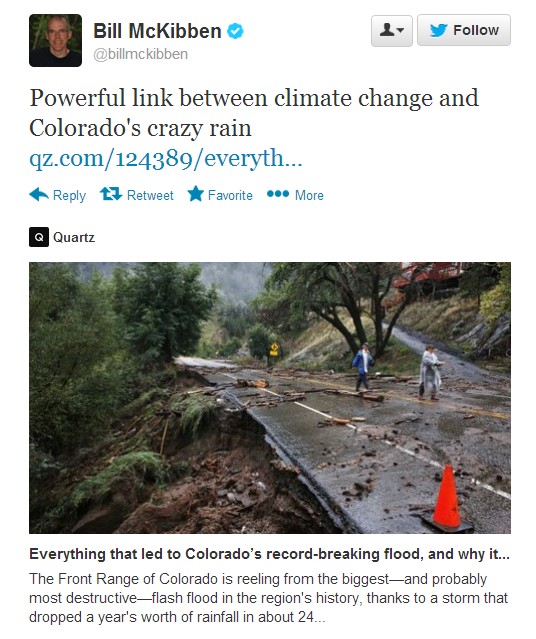
The 1965 storms produced more rain and produced it a lot faster than this week’s storms. And here we are just three weeks later with the climate scamsters (Cullen, McKibben, etc.) claiming that the recent storms were the worst in history.

Posted in Uncategorized | 5 Comments

Pixel Counting Teensy Weensy Alarmist Brains

For the past five years, I have been listening to alarmist trolls blabber mindlessly about pixel counting and comments Walt Meier made to The Register. The five year anniversary seems like a good time to set the record straight humiliate these morons.
ScreenHunter_644 Sep. 16 17.24

Steve Goddard  8/22/08  to walt

Dear Walt,

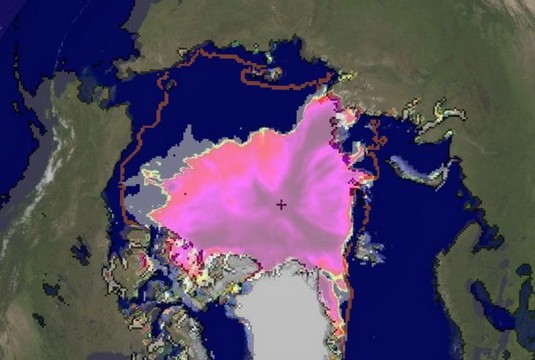
The attached image shows UIUC and NSIDC maps on top of each other from August 15, 2007. The interior land edges surrounding the Arctic are all registered, and as you can see, the UIUC ice extent is much smaller on the Canadian side. NSIDC is transparent white, and UIUC is colored.

BTW – when I do pixel counting on the NSIDC maps, I get an exact match vs. your graphs. The technique is excellent for making a decent estimation – if the base maps are correct.

Based on your last two E-mails I was surprised by your comments in The Register, as you had made it clear in your private messages that you understood what the problem was and were searching for the same answer. I absolutely do calculate the pixel area corrections for each date, and they make very little difference. On most days they /increase /the discrepancy by about 3% beyond what I reported. I am not making any attempt to measure ice area, and I am making an apples for apples measurement of extent.

The reason why UIUC maps show 30% increase in extent is because their August, 2007 maps appear to be not plotted accurately – as can be seen in the attached image. Their 2008 maps seem to show much closer agreement with NSIDC maps.

The UIUC maps show a striking increase in ice extent in 2008. Seeing is believing – but unfortunately in this case the images were not accurate.


– Steven Goddard

——————————–

Walt Meier  8/22/08  to me

Yes, if the map is not too distorting, like NSIDC’s maps, pixel counting is a good rough estimate. In fact, we helped developed an educational module where students would estimate the extent from pixel counting. Scientifically, it’s not valid, but using our maps we found it was close enough to get the message across for students. That’s why I wasn’t sure it was the pixel counting that was the problem – it seemed like it shouldn’t have been such a large error. But since I wasn’t familiar with the UIUC images, I couldn’t say exactly what the problem was, but it had to be due to the images in some way.

As for the comments on The Register, I forget exactly what I said, but I think I also tried to address some of the other comments by readers who were misunderstanding things. Sorry if it sounded like I was incorrectly criticizing you.

Thanks again for being willing to work with us to correct the errors.

walt

—————–

The discrepancy was due to two problems with the Cryosphere Today maps. They don’t show ice below 30% concentration, even though their legend makes it appear they do, and their eye altitude was incorrect. Both problems were resolved by Bill Chapman at UIUC.


Posted in Uncategorized | 47 Comments

Colorado State Climatologist Sets The Record Straight About The Flood

The storm was not biblical. It was not a 1,000 year flood – but it might have ranked in the top ten Colorado floods since 1876.

“As is typical of Colorado storms, some parts of the state were hard hit and others were untouched. Still, this storm is ranking in the top ten extreme flooding events since Colorado statehood,” said Nolan Doesken, State Climatologist at CSU. “It isn’t yet as extreme or widespread as the June 1965 floods or as dramatic as the 1935 floods but it ranks right up there among some of the worst.”

Among the worst, according to Climate Center data, occurred in May 1904, October 1911, June 1921, May 1935, September 1938, May 1955, June 1965, May 1969, October 1970, July 1976, July 1981, and, of course, the Spring Creek Flood of July 1997 that ravaged Fort Collins and the CSU campus. “Every flood event in Colorado has its own unique characteristics,” said Doesken. “But the topography of the Colorado Front Range makes this area particularly vulnerable when the necessary meteorological conditions come together as they did this week.”

Colorado Climate Center compiling final data on the Great September Storm of 2013 – News & Information – Colorado State University

Looks like it was a 15 year event, not a 1,000 year event. Alarmists were only off by a factor of 60 or so.

Posted in Uncategorized | 13 Comments

McKibben Math : Five Is Greater Than 1,200

ScreenHunter_642 Sep. 16 15.07

ScreenHunter_643 Sep. 16 15.08

Twitter / billmckibben: Powerful link between climate …

Posted in Uncategorized | 14 Comments

More Ex-Military Workplace Violence

ScreenHunter_640 Sep. 16 14.59 ScreenHunter_641 Sep. 16 15.02

Posted in Uncategorized | 18 Comments

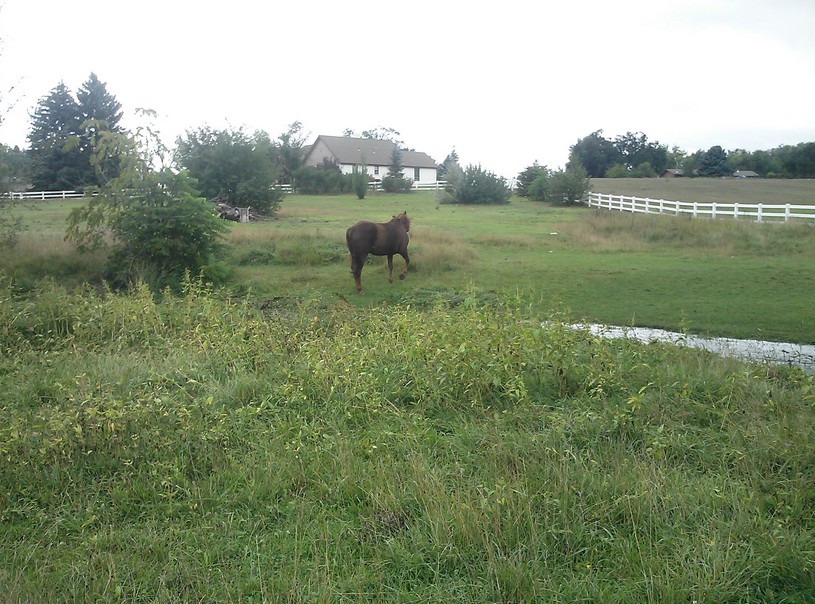
Terrifying Imagery Of The Permanent Colorado Drought Flood

The US Drought Monitor says we are having drought, while the Washington Post says it is the wettest year ever here.

I took this picture riding my bike this morning. The horse didn’t seem too concerned about the droughtflood.

ScreenHunter_639 Sep. 16 14.36

Posted in Uncategorized | 8 Comments