Another Tough Month For USHCN Adjusters

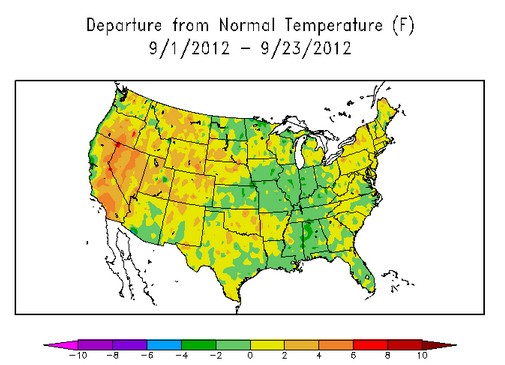
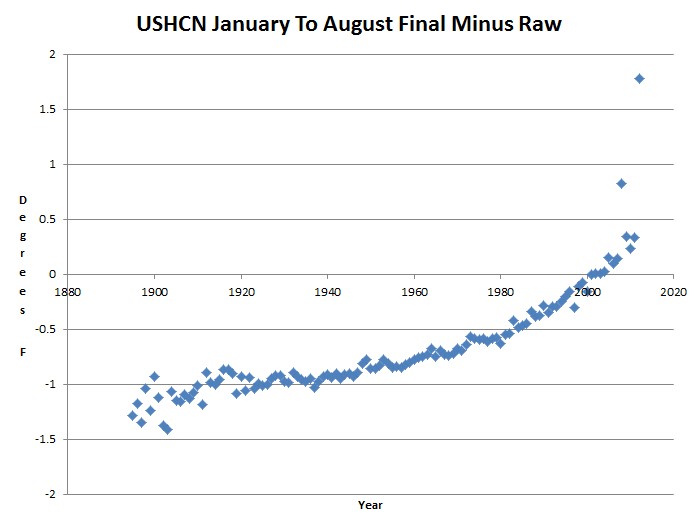
USHCN appears to have been tasked with the responsibility of making 2012 the hottest year ever in the US, regardless of what the actual temperatures are. So far they have had to adjust upwards by more than three degrees relative to 100 years ago, and September is going to make their job even tougher.
 

MonthTDeptUS.png (688×531)

Will they have to go to four or five degrees by the end of the year? There appear to be no checks, balances or auditing procedures, so they can probably get away with as much cheating as they need to.
Posted in Uncategorized | 6 Comments

The Dirty Little Secret About Arctic Ice

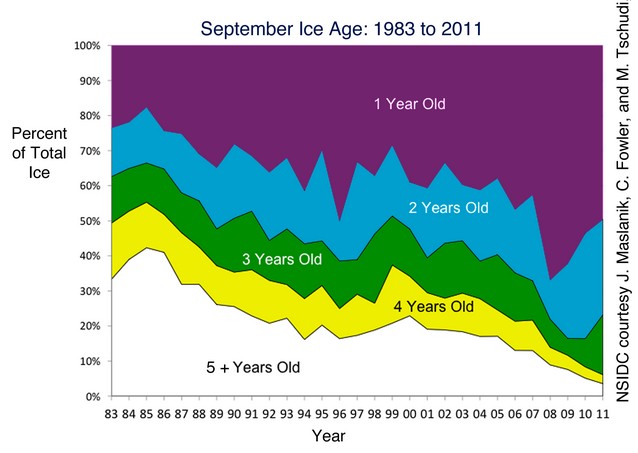
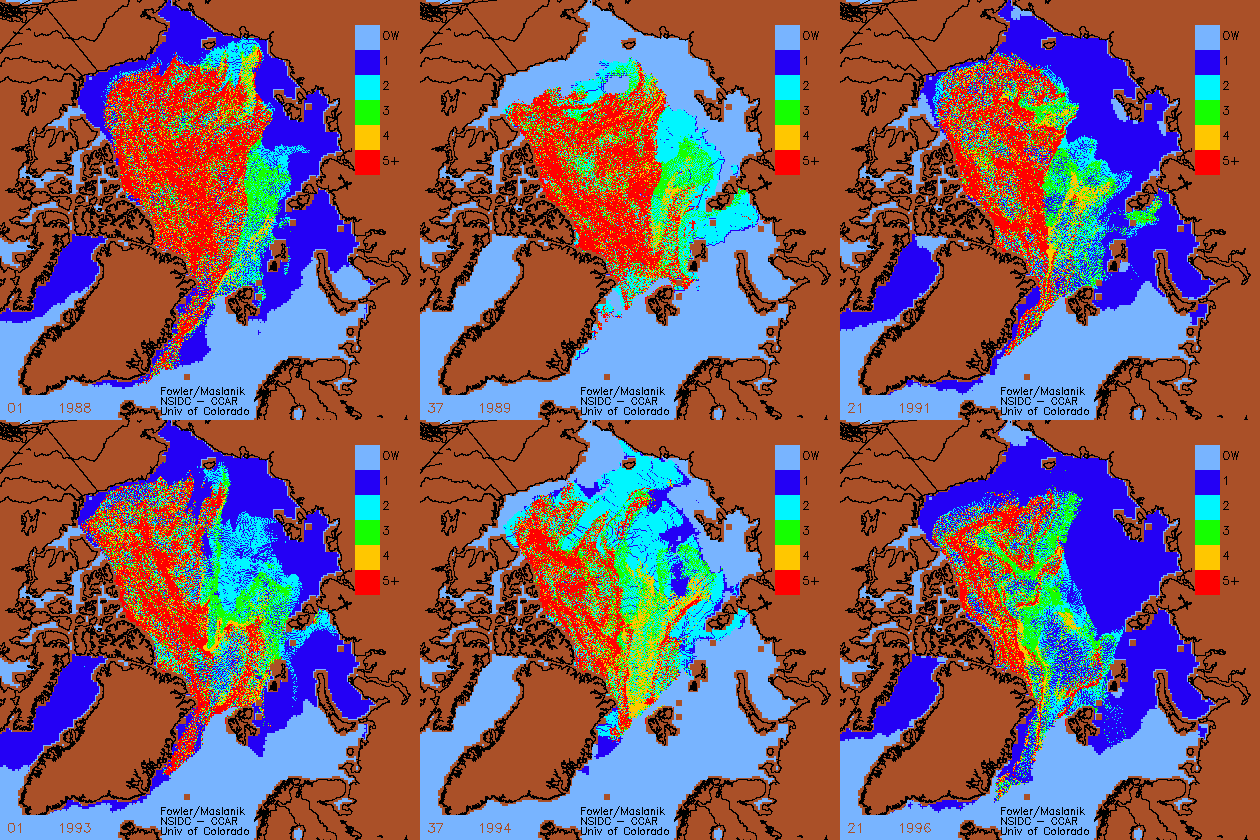
The vast majority of multi-year ice is lost during the winter, not the summer. Winter winds blow the thick ice out into the North Atlantic where it melts when it contacts warmer water.

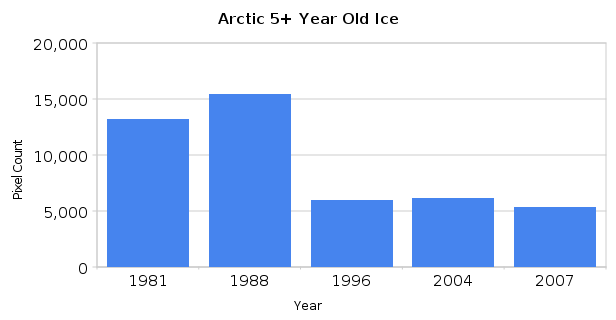
Between 1988 and 1996, two thirds of the five year old ice disappeared.

2007_seaiceminimum/images/20070822_oldice.gif

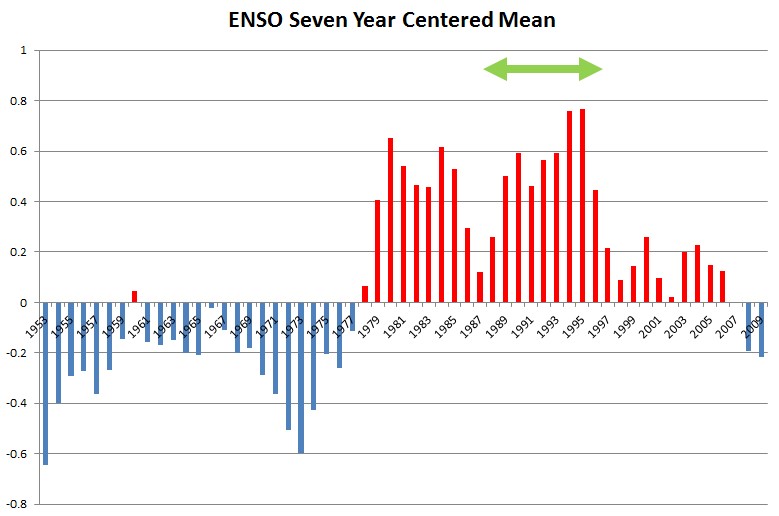
This has lead to a reduction in summer extent, because the ice in the Chukchi and Beaufort Seas is thinner than it was twenty years ago. The reduction from 1988 to 1996 coincided with the highest ENSO period on record.  Conveniently for NSIDC, the satellites they cherry-pick were launched just as ENSO went positive. This has allowed them to show a continuous downwards trend in ice extent.

ENSO is dominantly negative since 2008, and the amount of multi-year ice is increasing again.

October | 2011 | Arctic Sea Ice News and Analysis

Alarmists are hysterical about the “record minimum” extent, but it probably is meaningless for the long term.

Posted in Uncategorized | 50 Comments

The TOBS Smoking Gun

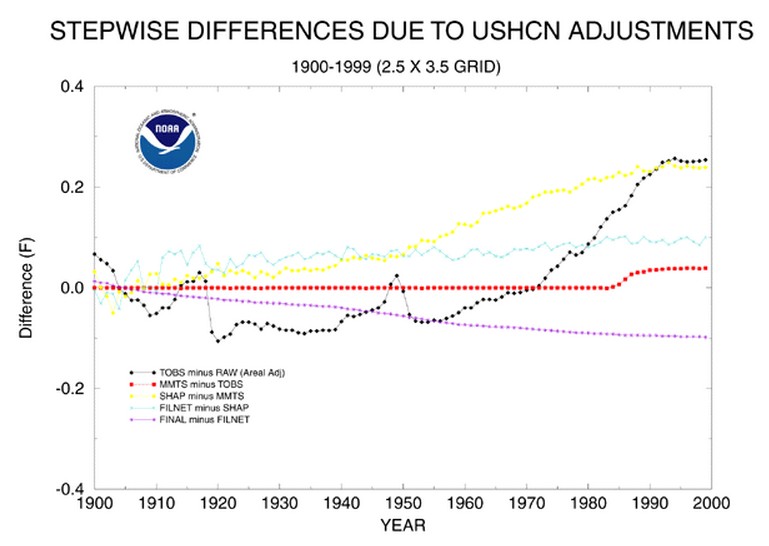
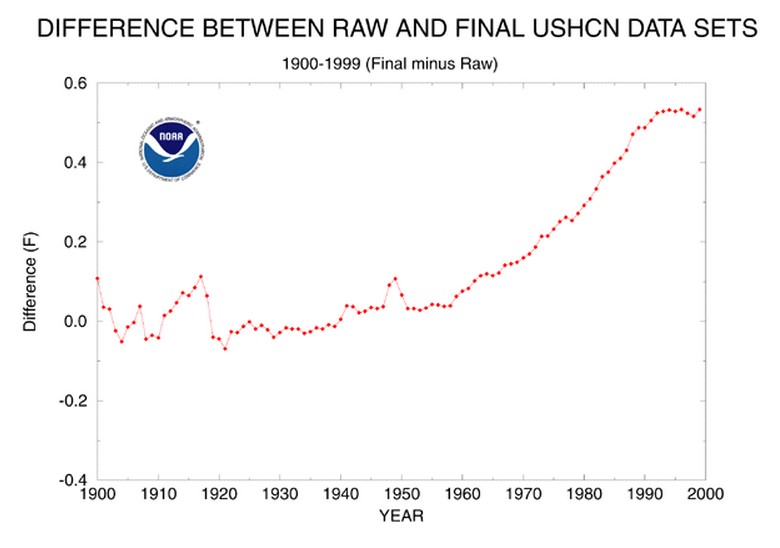
According to USHCN2 documentation, the TOBS adjustment hasn’t changed from USHCN1. The graph below shows that the TOBS adjustment in USHCN1 varied from -0.1 to 0.3, and was flat after 1990.

ts.ushcn_anom25_diffs_pg.gif (650×502)

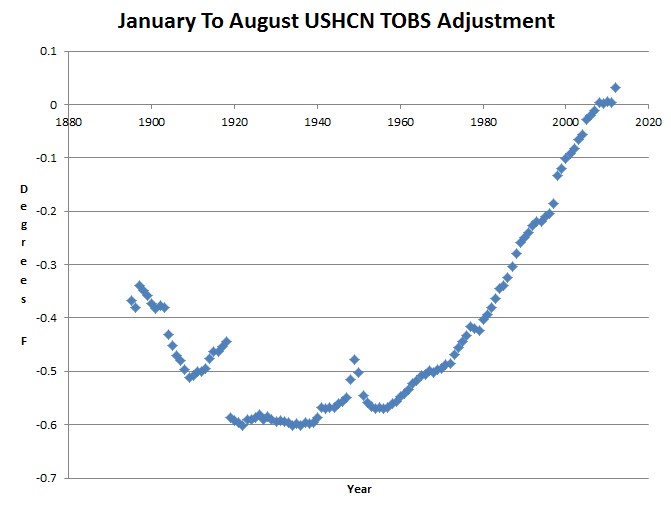
The USHCN2 TOBS adjustment is nearly twice as large, ranges from -0.6 to 0, and continues to increase after 1990.

Index of /pub/data/ushcn/v2/monthly

If it was the same algorithm as they claim – the graphs would be identical through the year 2000. Obviously it isn’t.

The final minus raw for USHCN1 ranged from 0 to 0.5, and was flat after 1990

ts.ushcn_anom25_diffs_urb-raw_pg.gif (650×502)

The USHCN2 final minus raw is 600% larger, and goes up exponentially after 1990. Just in the last year, the adjustment has increased by more than a degree.

Index of /pub/data/ushcn/v2/monthly

The US government is cheating and robbing us blind.

Posted in Uncategorized | 8 Comments

Afternoon Invocation

Thou shalt not consume the apple of tree ring data after 1960, because it has been corrupted by CO2 sin.

Thou shalt adjust thermometer data to hide the decline

Thou shalt splice adjusted thermometer data on to tree ring data after 1960

Book of Hockey 1:1

Posted in Uncategorized | 3 Comments

It Is Self Evident That Obama Will Tell Whatever Lie Seems Most Likely To Get Votes At The Time

21 September 2012

“It is self-evident that what happened in Benghazi was a terrorist attack,” White House spokesman Jay Carney told reporters travelling with President Barack Obama. Carney did not go any further in clarifying whether the administration believed the attack was planned.

Assault on Benghazi consulate was a terrorist attack, says US government | World news | guardian.co.uk

Five days earlier they said the exact opposite. Apparently their pollsters told them that the public wasn’t buying their lies, so they changed them.

September 16, 2012

U.S. ambassador to the United Nations Susan Rice blanketed the TV airways Sunday to reinforce the Obama administration’s position

“The best information and the best assessment we have today is that this was not a pre-planned, pre-meditated attack,” Rice also told Fox News. “What happened initially was that it was a spontaneous reaction to what had just transpired in Cairo

Ambassador Rice spends Sunday reinforcing White House position that Middle East violence was ‘spontaneous’ | Fox News

The other possibility is that Obama and the rest of the White House are simply flaming imbeciles.

Posted in Uncategorized | 14 Comments

Hillary Endorses 55 MPH Speed Limit

Hillary Clinton Endorses 55 MPH Speed Limit

US Senator Hillary Clinton (D-NY) on Tuesday endorsed a return to the 55 MPH maximum speed limit for “most” of the country during a speech at the National Press Club in Washington, DC. Senator Clinton, who is leading in the polls for the Democratic nomination for president in 2008, responded to a question about whether she supported the Carter administration’s national maximum speed limit.

Senator Hillary Clinton Endorses 55 MPH Speed Limit

[youtube=http://www.youtube.com/watch?v=10X3zJpMDMo]

Posted in Uncategorized | 6 Comments

55 MPH Speed Limit And No Plane Flights In The UK Will End The Climate Emergency

Labour MP Colin Challen has launched the parliamentary motion, which points to a “climate emergency”. He said: “The catastrophic destabilisation of global climate represents the greatest threat that humanity faces.”

The immediate action he says is needed includes redirecting money aimed at boosting the economy to “green measures”, and assigning at least two hours of prime-time television per week to “explain the gravity of the crisis to the public”.

He also said “domestic flights should be phased out by the end of 2010″ while a “speed limit of 55 miles per hour should be introduced”.

Global warning | speed limit cut | 55mph | Andrew George | Flybe| Devon and Cornwall | Colin Challen, Labour MP | Western Morning News | This is Cornwall

Posted in Uncategorized | 9 Comments

September, 1775 – US Hit By Two Deadly Hurricanes

The Great Hurricanes of North Carolina – John Hairr – Google Books

Climate experts tell us that the hurricanes which we are not having now, would be much worse if they actually were happening.

Posted in Uncategorized | 2 Comments

First Lady, President Featured On Racist Web Site

Blacks for Obama | Facebook

I must have missed the “Whites for Romney” page.

Posted in Uncategorized | 14 Comments

The Impossible Heatwave Of 1923-1924

Hansen tells us that heatwaves are much worse now because of evil humans, so we know that the 1923-1924 record heatwave in Australia was impossible.

Marble Bar heatwave, 1923-24

The world record for the longest sequence of days above 100°Fahrenheit (or 37.8° on the Celsius scale) is held by Marble Bar in the inland Pilbara district of Western Australia. The temperature, measured under standard exposure conditions, reached or exceeded the century mark every day from 31 October 1923 to 7 April 1924, a total of 160 days.

The highest temperature recorded during the record spell was 47.5°C on 18 January 1924. There have been higher temperatures at Marble Bar, with the highest recorded being 49.2°C, on 11 January 1905 and again on 3 January 1922. But temperatures in other Western Australian towns have been higher: in a remarkable late-season heat-wave in February 1998, Mardie recorded a maximum of 50.5°C (on the 19th) – the highest temperature in Western Australia, and the second highest ever recorded in Australia using standard instrumentation (Oodnadatta, in South Australia, recorded 50.7°C on 2 January 1960). Several other recordings above 49°C were reported in the northwest on the days preceding Mardie’s record, and at Nyang, the average maximum over the entire summer exceeded 43°C. As in 1923-24, very dry conditions accompanied the extreme heat.

BOM – Australian Climate Extremes

Posted in Uncategorized | 4 Comments