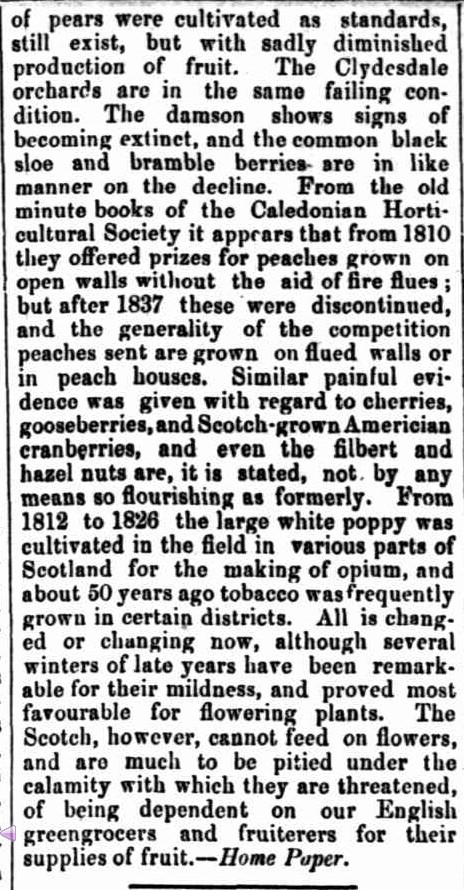
The record minimum extent is now likely to be formally called on Monday by the US National Snow and Ice Data Centre (NSIDC) in Colorado.
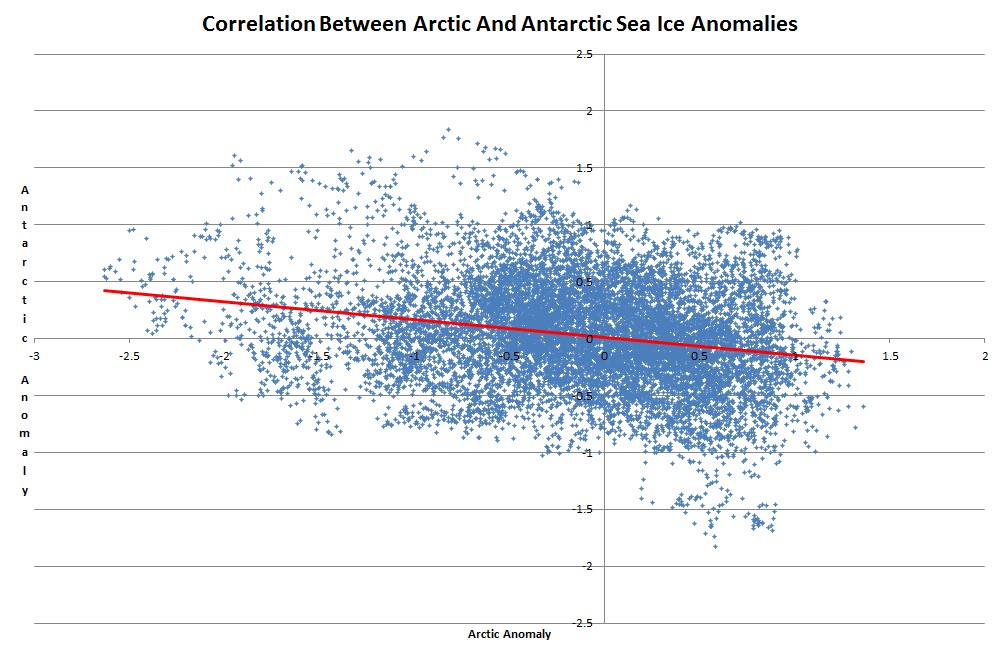
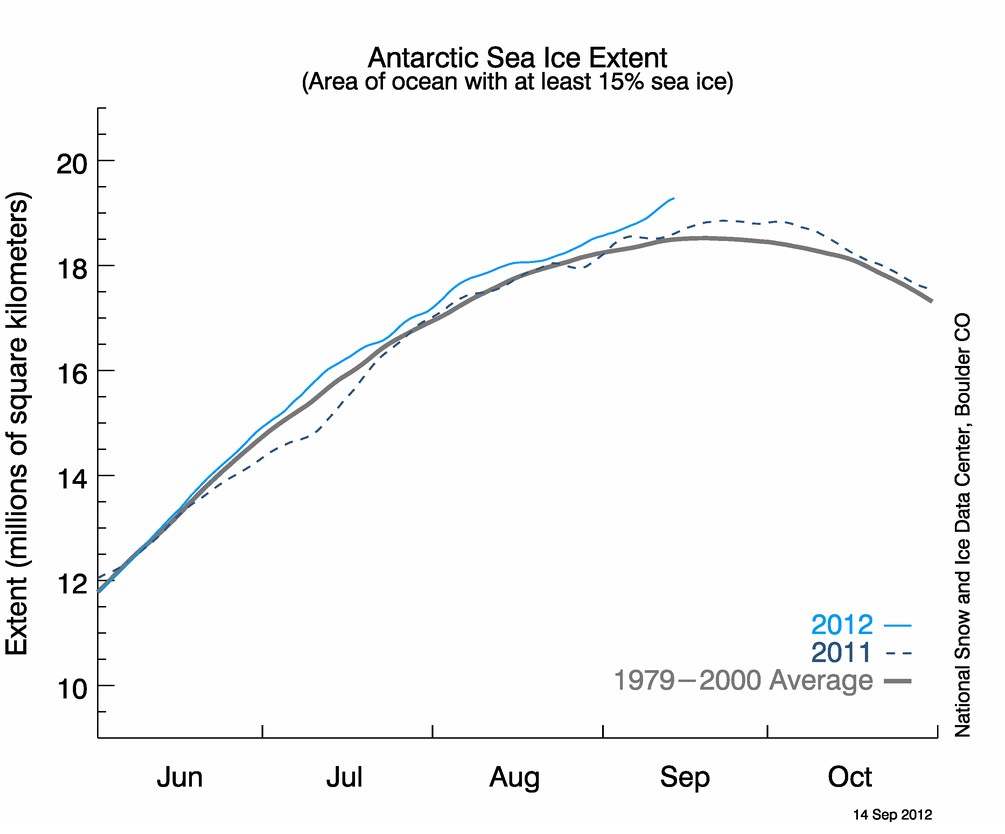
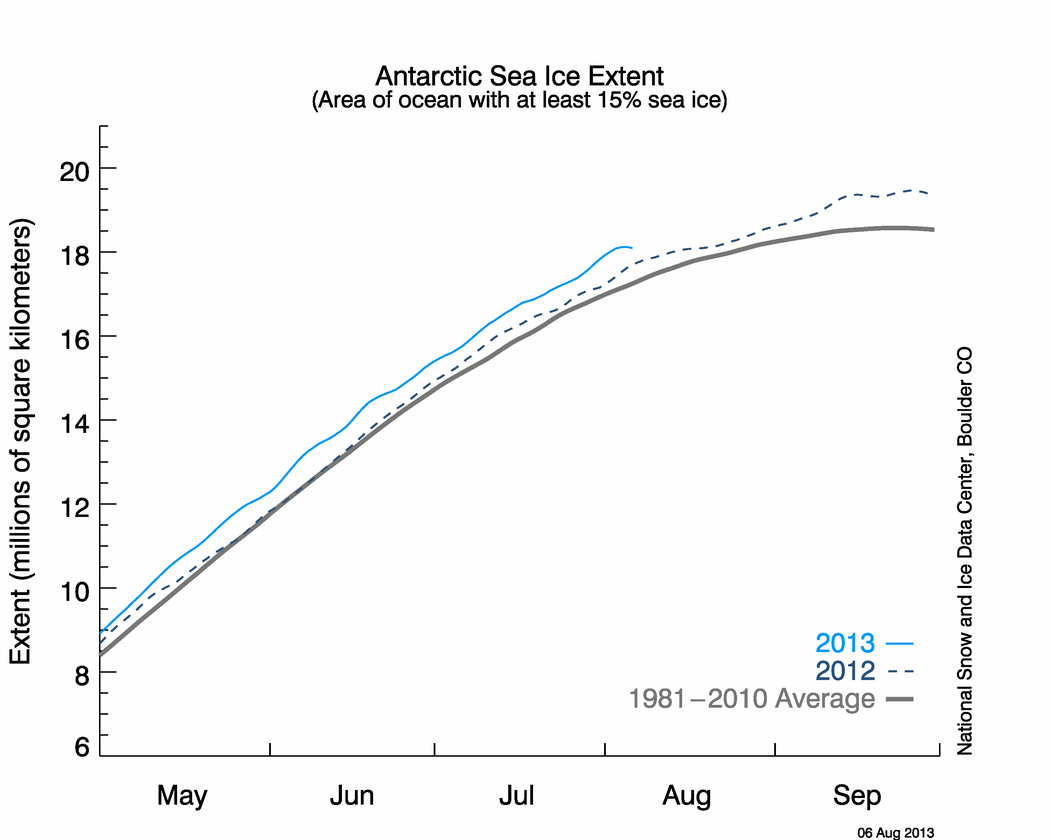
No doubt they will also make a huge hoopla about the Antarctic record maximum, where most of the world’s sea ice is located.
The staggering decline of sea ice at the frontline of climate change Scientists on board Greenpeace’s vessel exploring the minimum extent of the ice cap are shocked at the speed of the melt
The staggering increase in BS triggered by the August winter storm.
“In the 1970s we had 8m sq km of sea ice. That has been halved. We need it in the summer. It has never decreased like this before”. “We knew the ice was getting thinner but I did not expect we’d lose this much this year. We broke the record by a lot”, says the NSIDC scientist Julienne Stroeve.
“The acceleration of the loss of the extent of the ice is mostly because the ice has been so thin. This would explain why it has melted so much this year. By June the ice edge had pulled back to where it normally is in September,” she says.
Very naughty – NSIDC maps show that ice extent in the western Arctic was “normal” in June. Julienne knows perfectly well that the big drop occurred in mid-August after the storm. She posted the information here.
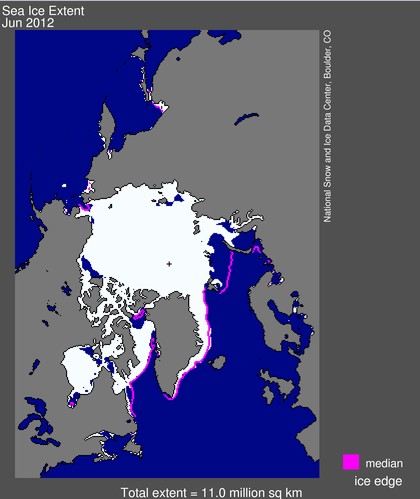
N_201206_extn.png (420×500)
Sea ice extent has varied naturally over the decades with some Russian data suggesting similar or even greater ice loss in some local areas in the 1930s. But the models are clear, says Stroeve. If you omit the observed records, keeping CO2 levels at pre-industrial levels, then none show a decline of ice cover. When you do put CO2 into the models, they all show a decline, she says.
The staggering decline of sea ice at the frontline of climate change | Environment | guardian.co.uk
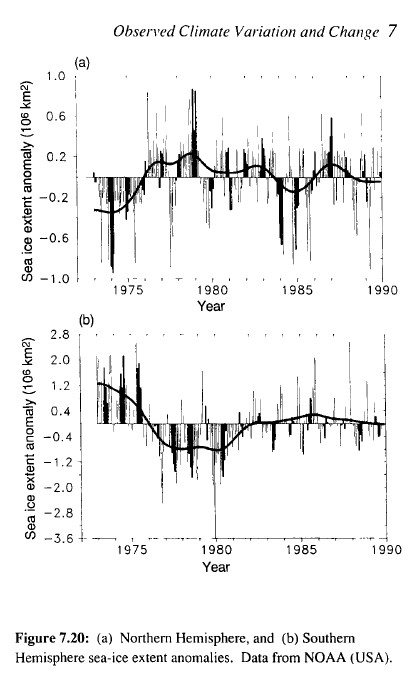
Russian data shows that the ice was just as thin in 1940 as it is now. Models did not predict the record amount of Antarctic sea ice.
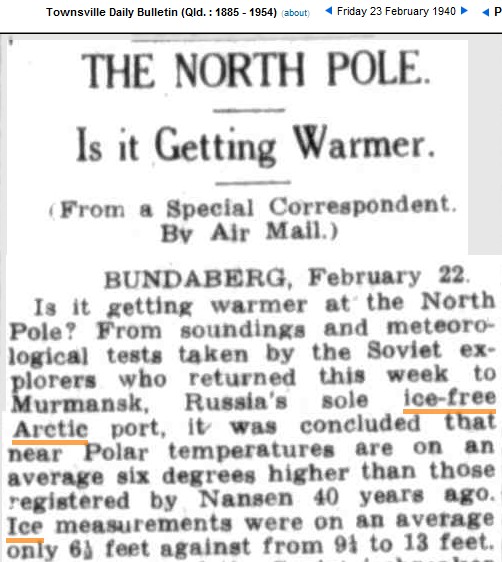
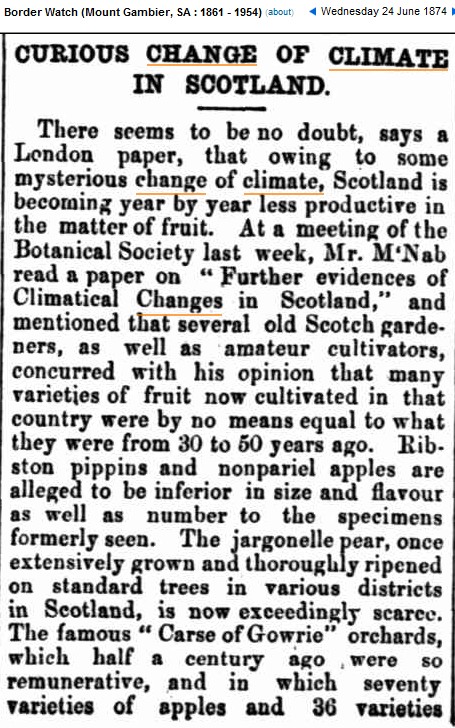
http://trove.nla.gov.au/