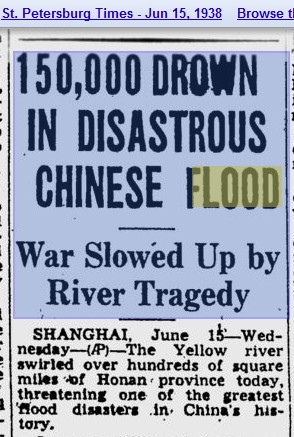
Floods Are Much Worse Now

St. Petersburg Times – Google News Archive Search

Posted in Uncategorized | 2 Comments

Ted Turner’s Communist News Network Evaluates Ryan And Rice

Roundup: How did Paul Ryan do? – CNN.com

Posted in Uncategorized | 5 Comments

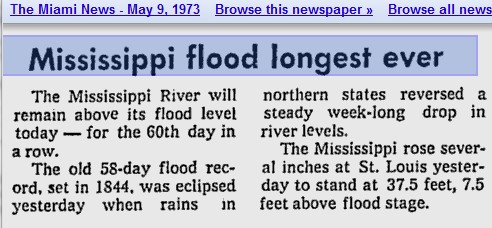
1973 : 60 Day Long Global Cooling Flood

The Miami News – Google News Archive Search

Posted in Uncategorized | Leave a comment

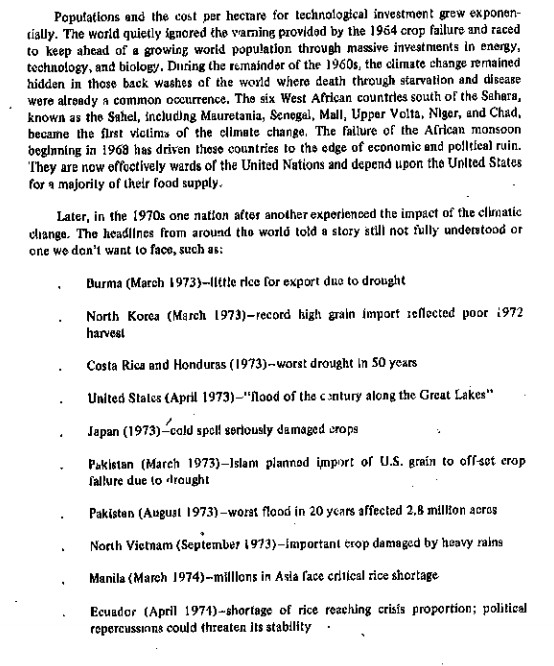
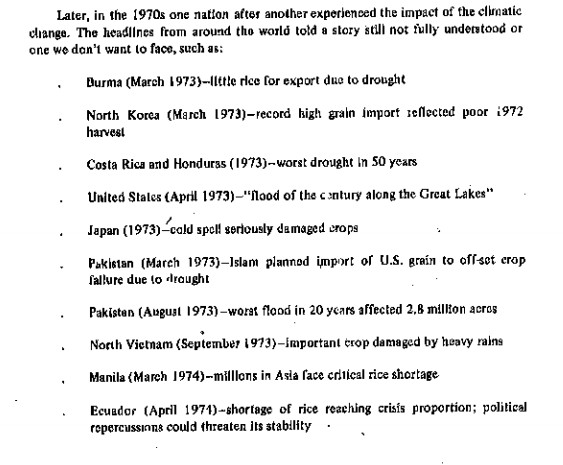
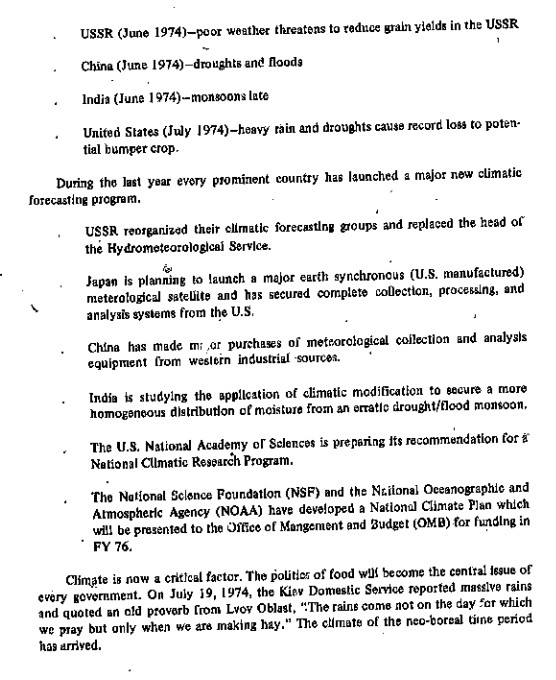
1974 : CIA Enumerated The Devastation Of Global Cooling

Hansen is busy lying today about how extreme weather has gotten worse due to global warming. In 1974, the CIA said the exact opposite.

“The world’s snow and ice cover had increased by at least 10 to 15%”

“The six west African countries .. became the first victims of climate change”

Within a single year, adversity had visited nearly every nation on the globe”

Continue reading

Posted in Uncategorized | 7 Comments

Record Summer Cold In Greenland

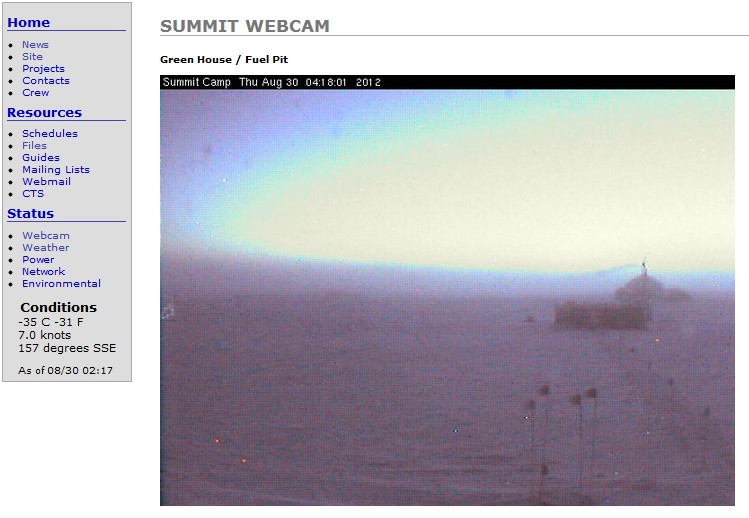
The meltdown has brought -35C to the ice sheet. Note the line of flags they put in today to keep people from getting lost in the blizzards.

summit:status:webcam

Posted in Uncategorized | 10 Comments

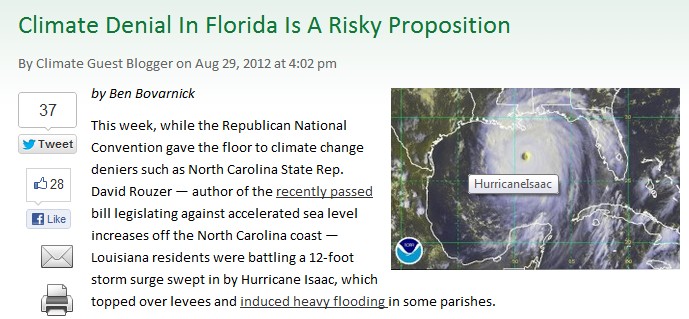
Romm Pulls An Al Gore

That isn’t Issac – it is Katrina. They lie about everything.

h/t to John Bogen

Posted in Uncategorized | 9 Comments

Yes – You Built That

Paul Ryan just blew me away.

We have the opportunity to replace the America hating fraudsters at 1600 Pennsylvania Avenue with first rate Americans. This is the most important election of my lifetime.

Posted in Uncategorized | 75 Comments

Party Is Over?

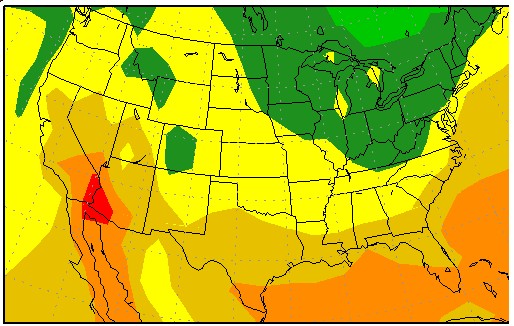
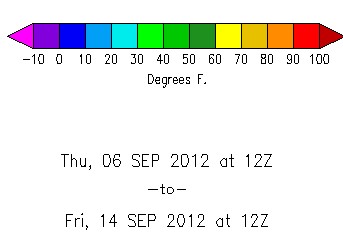
10-Day Temperature Outlook for the Conterminous U.S.

Posted in Uncategorized | 5 Comments

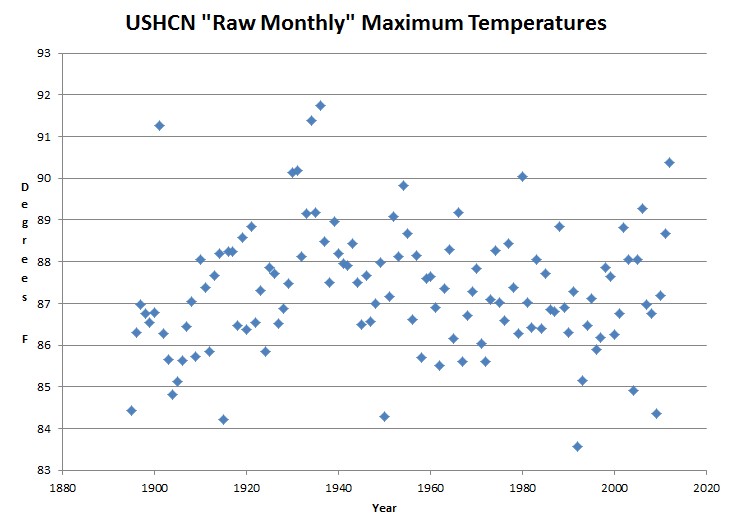
July Maximum Temperatures Were Fourth Hottest In The US

The three hottest years for maximum monthly temperatures in the US were 1936, 1934 and 1901.

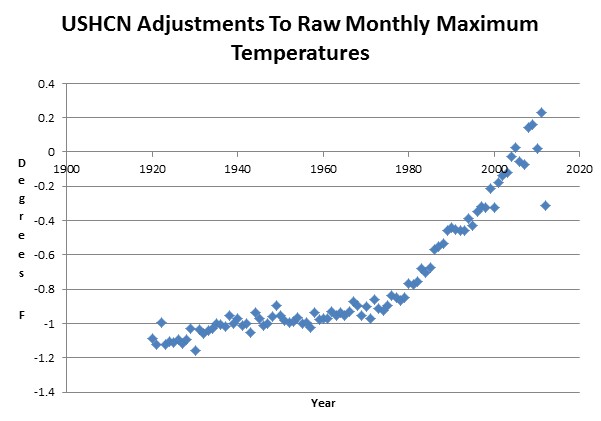
The graph below shows the unknown adjustments which NOAA makes – discussed in the Paul Homewood’s article below. Note the bizarro adjustment in 2012.

Posted in Uncategorized | 4 Comments

NOAA Declares Hottest July – But Don’t Know How They Did The Math

Paul Homewood goes right to the source.

The real mystery, though, is how they arrive at the 1934 number. There are State Climatological Reports available from then, but no direct comparison can be made with current ones because there were less stations then and they were allocated to only three divisions instead of six. Also the majority of stations reporting in 1934 no longer report now. (For interest, the State temperature given at the time for July 1934 was 78.8F, i.e. 0.2F higher than now shown).

When I asked Deke Arndt of NOAA how they calculated the temperatures for 1934, he seemed as confused as me!

“Climate divisions weren’t in use then, so the circa 1934 is likely a straight up average of available stations at “press time”

The more modern CAG value uses the CDs to build the state value (this is a factor if stations are distributed unevenly within the state), it incorporates the late-arriving (in 1934) stations, several QA tests, etc.

Those are probably the factors in play here.”

So it would appear the temperatures that NOAA now declare for 1934 are no more than a “theoretical reconstruction”. But without the transparency to show how this has been done, how can we have any confidence that it has been done properly. There is a potential discrepancy of 0.6F in Virginia; if this is extended across the whole country, it would destroy the claim that this July was the hottest month on record as July 1936 was only 0.13F cooler on NOAA’s record. Indeed this would only the 5th warmest July in the CONUS.

Hottest July In Virginia? Or Maybe Not. « NOT A LOT OF PEOPLE KNOW THAT

Posted in Uncategorized | 1 Comment