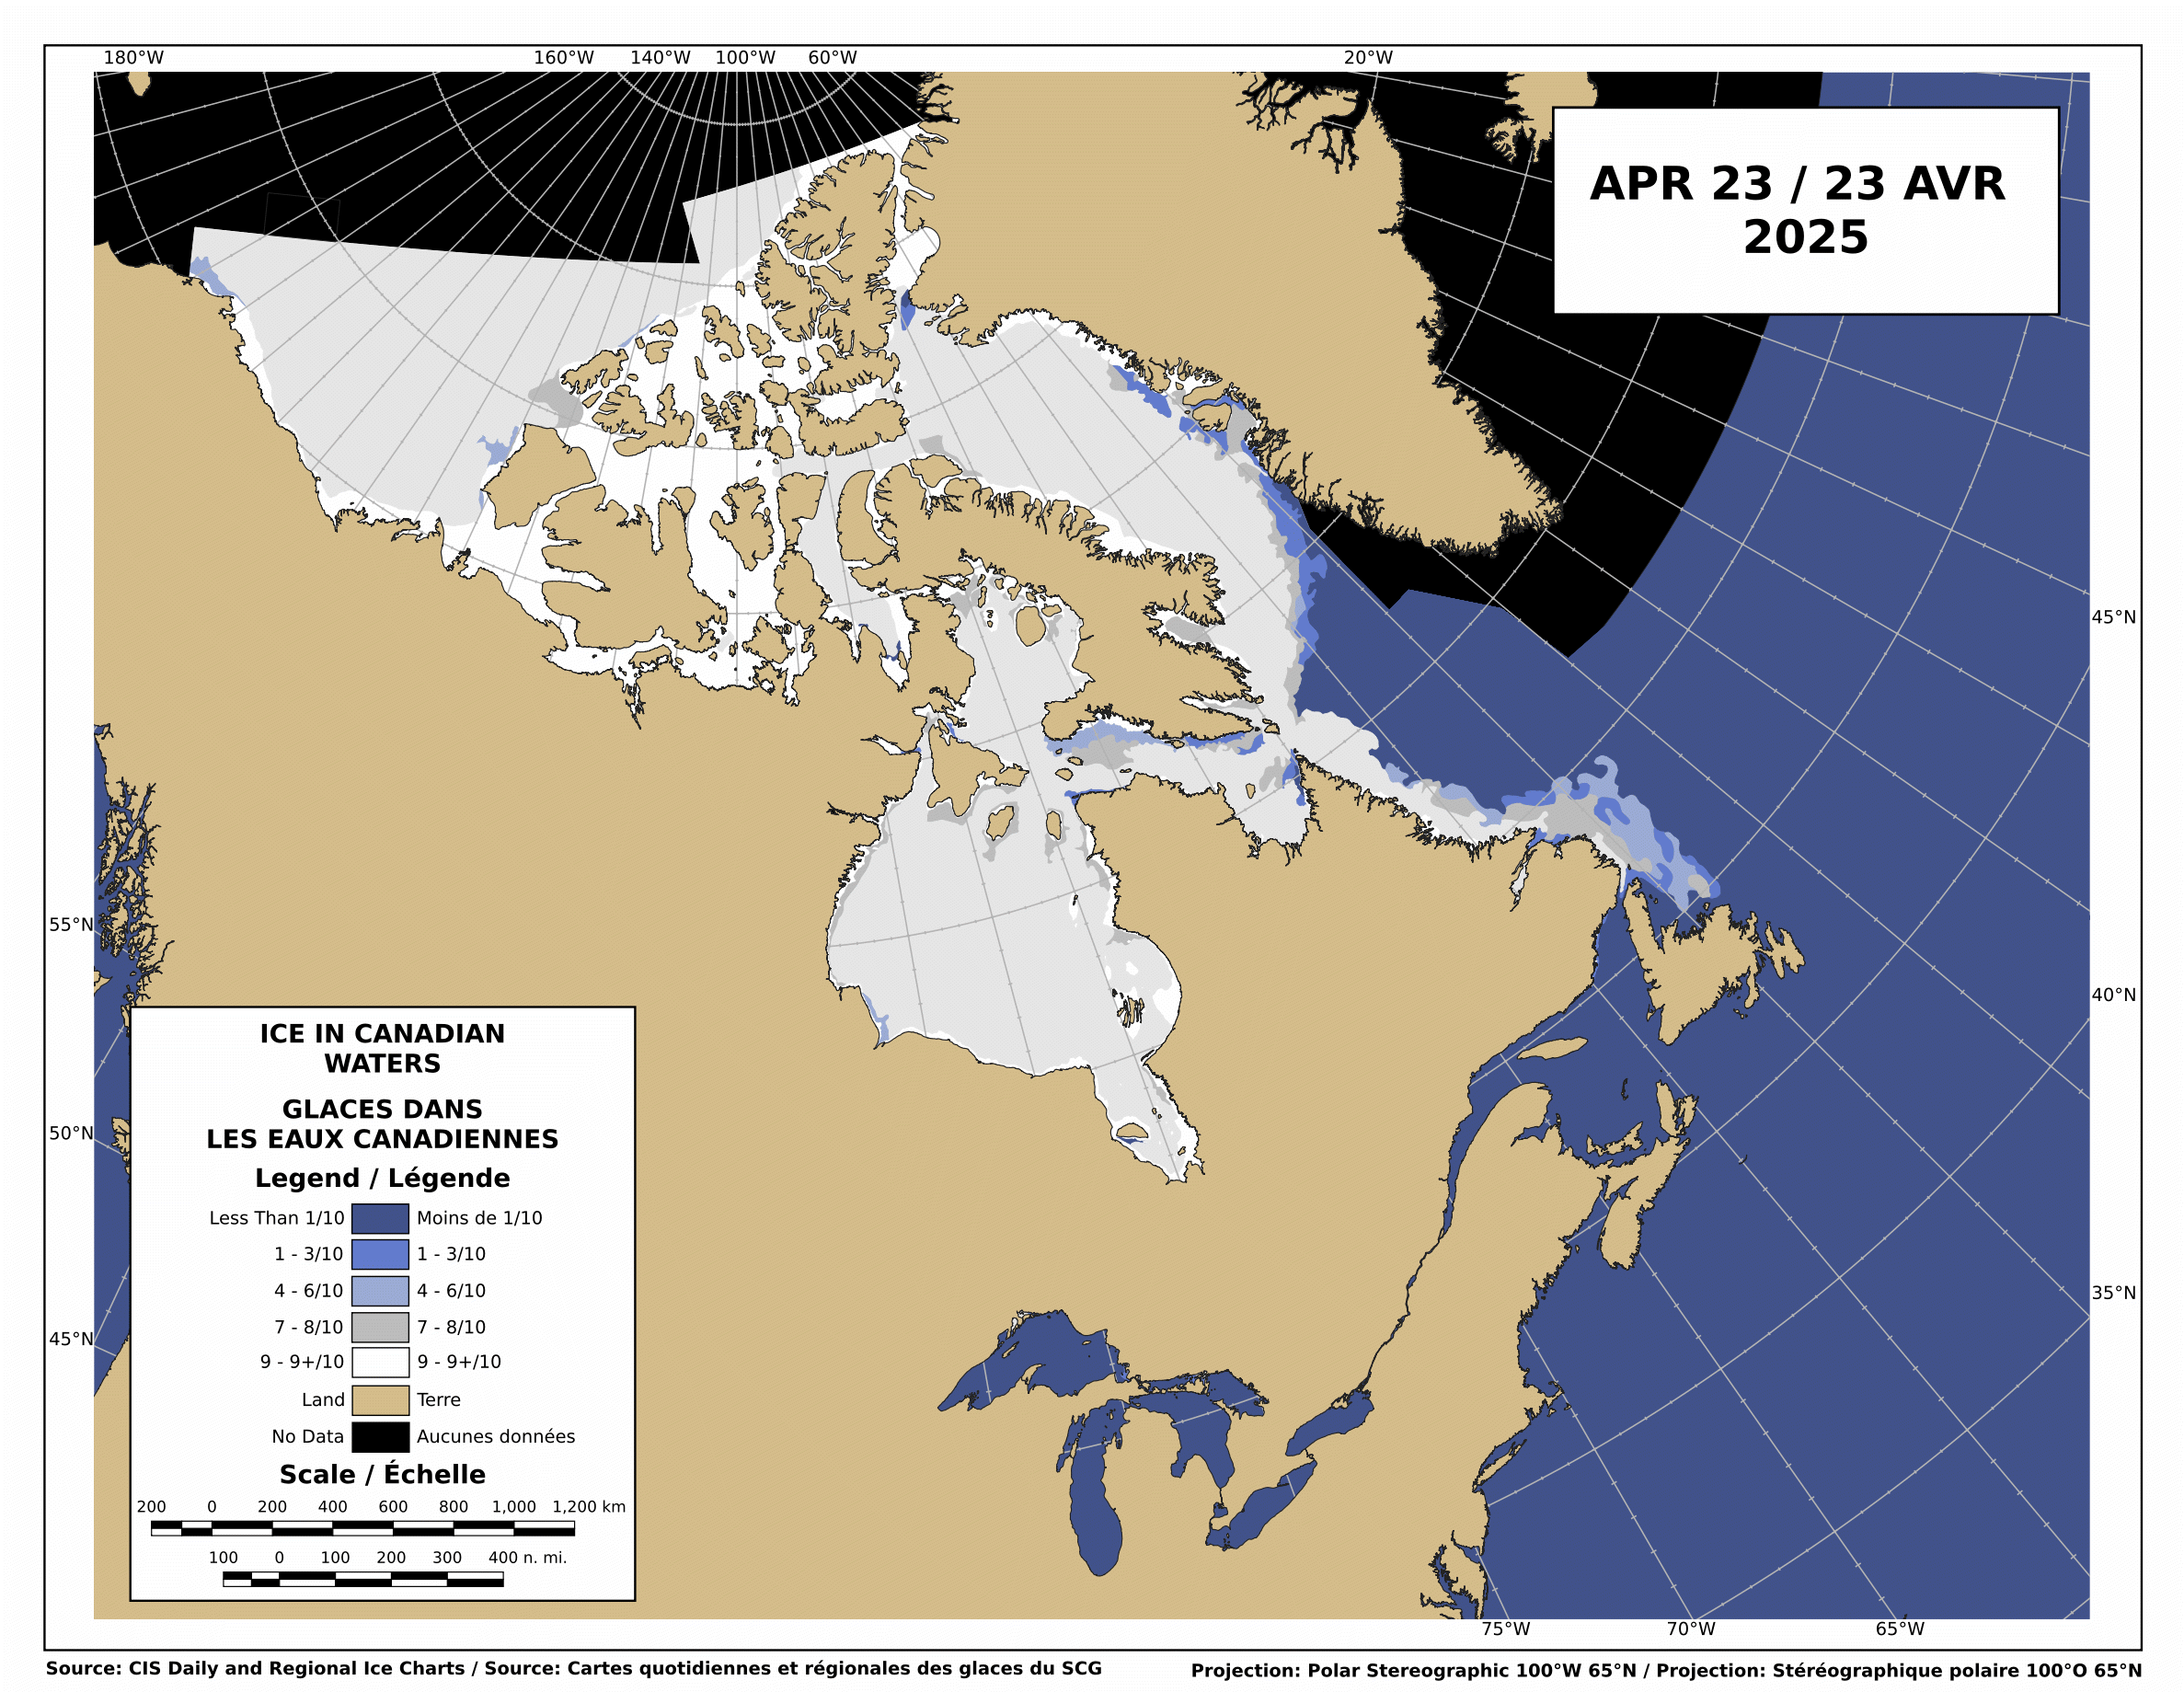
h/t to Dave G
I am also interested in the development and application of global numerical models for the purpose of understanding current climate trends and projecting humans’ potential impacts on climate. The scientific excitement in comparing theory with data, and developing some understanding of global changes that are occurring, is what makes all the other stuff worth it.
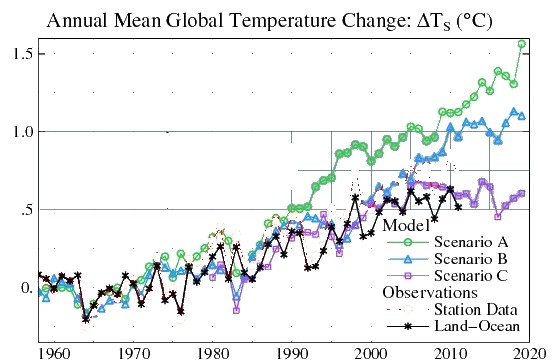
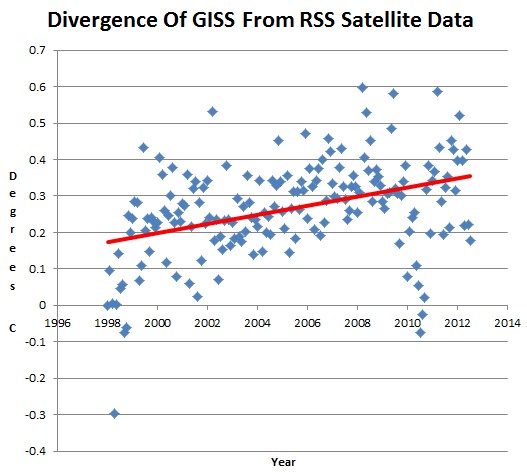
Awesome, let’s compare your data with your theory – Jim.
Massive fail.
”scenario C assumes a rapid curtailment of trace gas emissions such that the net climate forcing ceases to increase after the year 2000.”
Now, let’s compare your manipulated data with legitimate satellite data. You had to cheat to get even close to Scenario C
It is interesting watching the Arctic ice nutcases.
They have determined that the only sea ice which is important is the ice which microwave sensors can’t detect in the Arctic, during a six week period when the sun is about to set.
There is plenty of ice for the bears and the walruses, the satellites just don’t see it. The sun is low in the sky, so the lack of ice has little effect on the Earth’s shortwave radiative balance.
It doesn’t matter that there was plenty of Arctic ice when the sun was high in the sky during May through July.
It doesn’t matter that Antarctic sea ice is increasing.
It doesn’t matter that Hansen forecast most of the ice loss in the southern hemisphere.
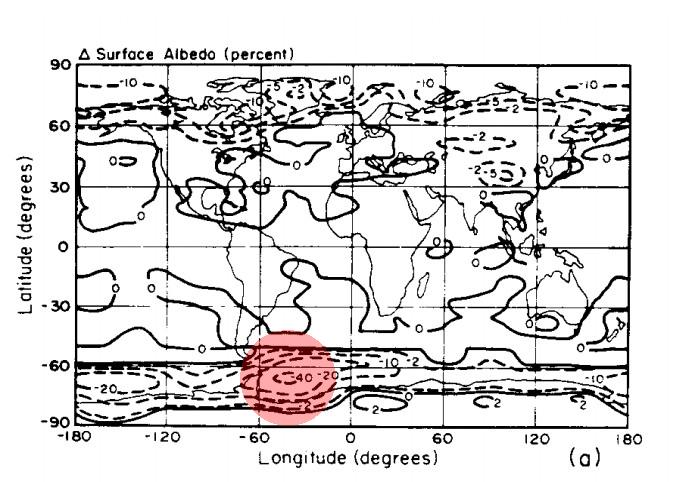
www.epa.gov/climatechange/effects/downloads/Challenge_chapter2.pdf
It doesn`t matter that EPA has conveniently deleted the Hansen forecast shown above.
All that matters is crappy satellite data in the Chukchi Sea during a few weeks of August and September.
Much of Arizona had about 1/3 of their annual rainfall this past week.
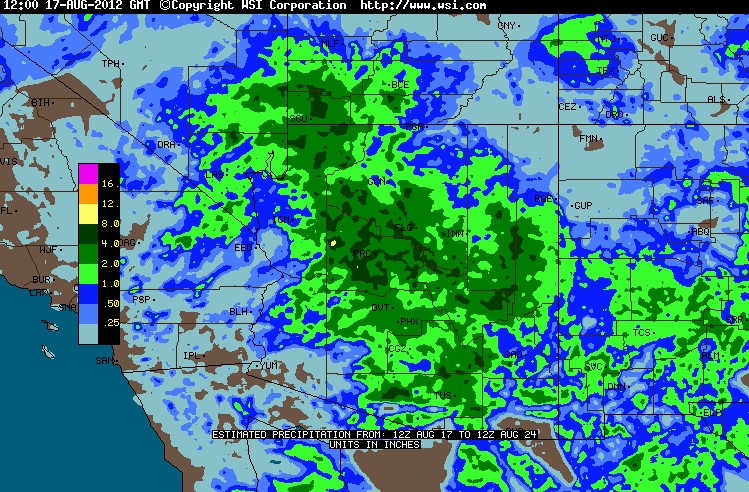
More evidence that vegetables are more intelligent than climate alarmists.
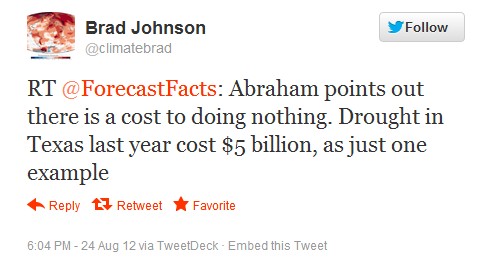
Twitter / climatebrad: RT @ForecastFacts: Abraham …
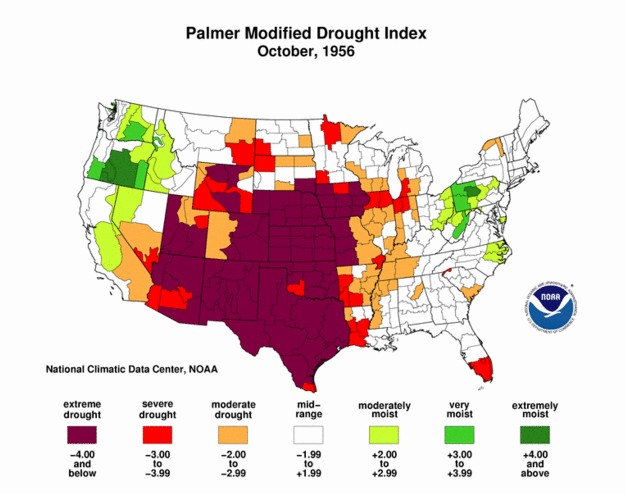
h/t to Marc Morano
Bouncing around from one mindless paranoid fear to the other. The midwest was burning up, until it turned cold. They were obsessed with Greenland for a couple of hours. Now it is Arctic ice.
You alarmists are a bunch of total nutcases.
I’m guessing that bonuses at NOAA depend on the number of clouds which they name.
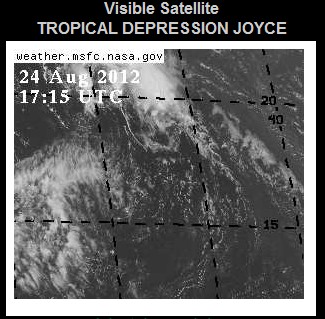
DISCUSSION AND 48-HOUR OUTLOOK
——————————
AT 500 AM AST…0900 UTC…THE CENTER OF TROPICAL DEPRESSION JOYCE
WAS LOCATED NEAR LATITUDE 16.9 NORTH…LONGITUDE 45.0 WEST. THE
DEPRESSION IS MOVING TOWARD THE NORTHWEST NEAR 14 MPH…22 KM/H. A
MOTION IN THIS DIRECTION AT A FASTER FORWARD SPEED IS EXPECTED
DURING THE NEXT TWO DAYS.
MAXIMUM SUSTAINED WINDS ARE NEAR 35 MPH…55 KM/H…WITH HIGHER
GUSTS. LITTLE CHANGE IN STRENGTH IS FORECAST DURING THE NEXT 48
HOURS.
Near 35 MPH at altitude in the middle of the Atlantic. Chalk another funny one up for the team.
An early winter storm broke the ice in the Chukchi Sea up into chunks of a size which microwave sensors are missing, so the alarmist community goes full stupid over their own defective measurements.
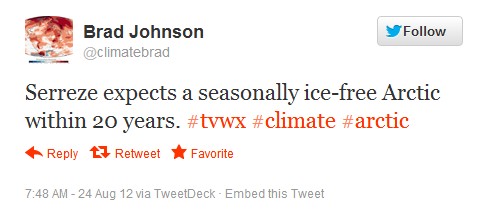
Twitter / climatebrad: Serreze expects a seasonally …
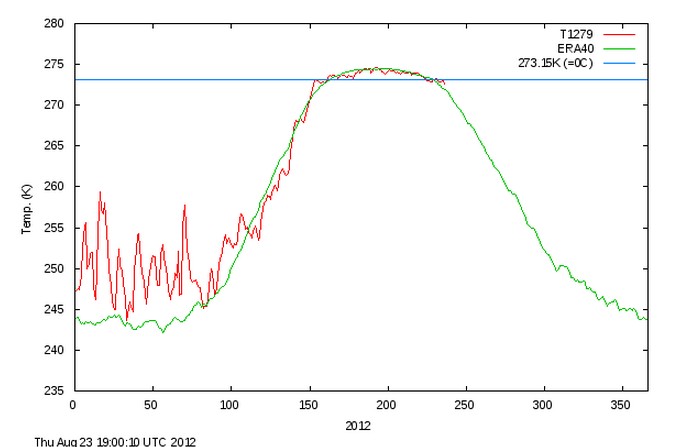
Summer temperatures north of 80N have been running below the long term mean for many years, and the ice there is several metres thick. How could anyone be daft enough to predict an ice-free Arctic?
COI | Centre for Ocean and Ice | Danmarks Meteorologiske Institut
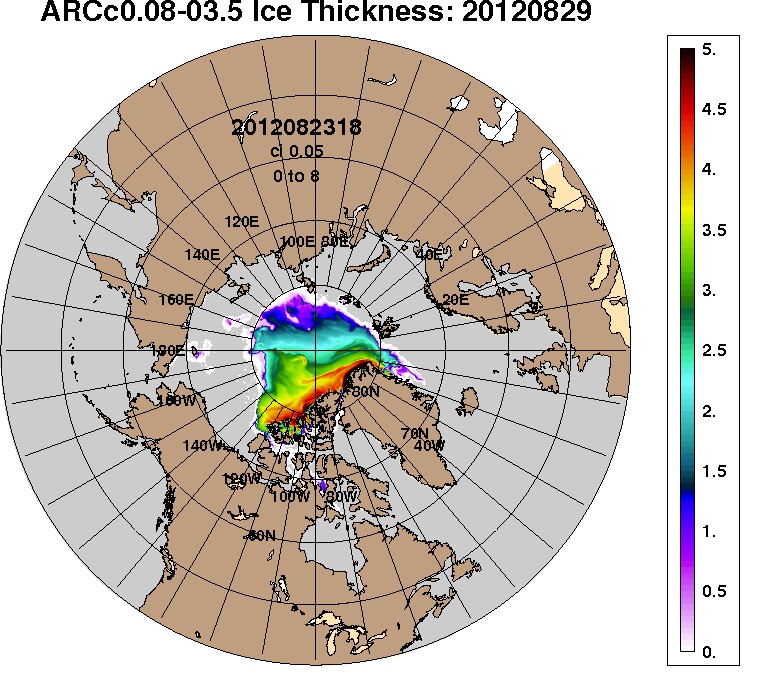
arcticictn_nowcast_anim30d.gif (740×666)
There is plenty of ice up there, but your methodology and thought process is broken, Mark Serreze
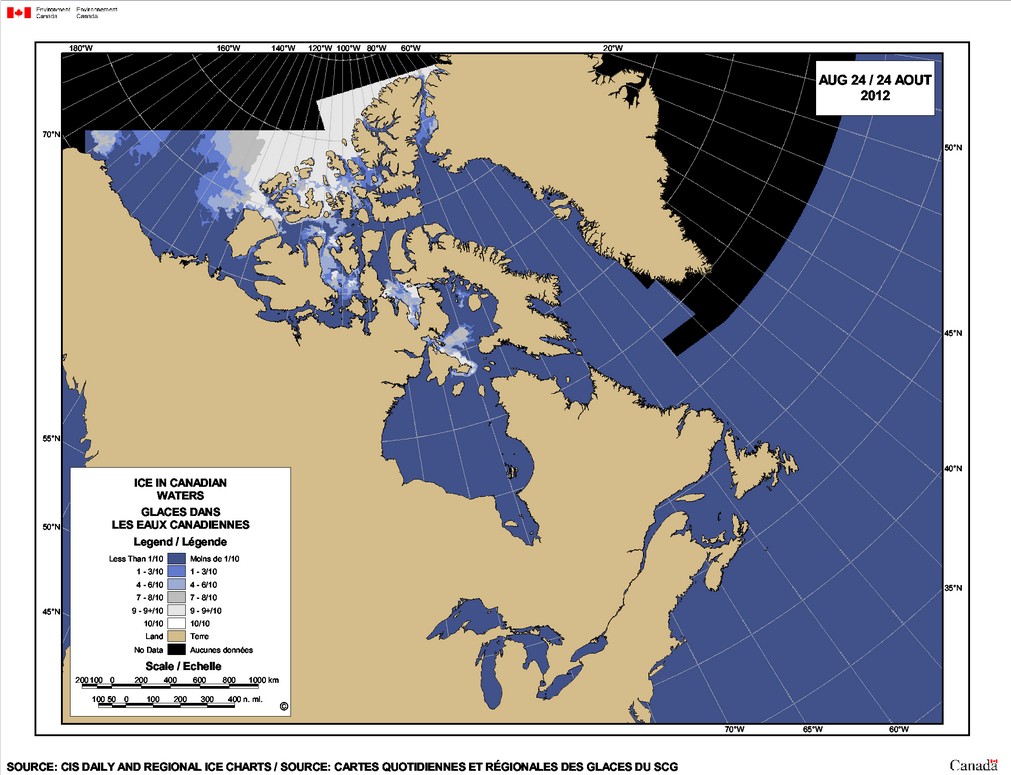
Your own web site says that you miss a large percentage of the summer ice.
“NIC charts are produced through the analyses of available in situ, remote sensing, and model data sources. They are generated primarily for mission planning and safety of navigation. NIC charts generally show more ice than do passive microwave derived sea ice concentrations, particularly in the summer when passive microwave algorithms tend to underestimate ice concentration. The record of sea ice concentration from the NIC series is believed to be more accurate than that from passive microwave sensors, especially from the mid-1990s on (see references at the end of this documentation), but it lacks the consistency of some passive microwave time series.”