Alarmists – Please Stop Being Idiots

A comment from Anthony’s blog

Paul K2 says:

Thank goodness there are at least some people here who can spot the mathematical mistake in this post from Real-Science dot blog, so I don’t have to address it. The conclusions the post draws are nonsensical. Maybe Real-Science should actually be called Fake-Science.

Enough stupidity please, from the left.
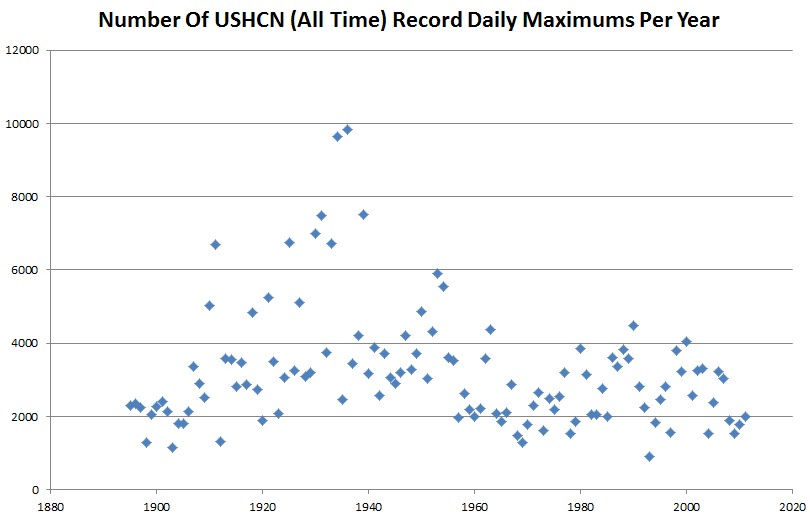
The graph shows how many all time daily temperature records were set during each year. It is calculated by parsing all the yearly records at a particular station for a particular day of the year. The year which has the highest temperature wins. All years have an equal chance of setting the record. Every station has exactly 366 daily high temperature records associated with it.

What Paul K-9 is trying to suggest is that the graph plots successive temperature records. Obviously that is not the case, because if it were – the first year would set a record at every station on every day. There would be an asymptote coming down the Y-axis on the left side.

There is a small bias to the left because the record is set by the first occurrence of the record high. In a warming world, this wouldn’t have much effect, because later temperatures would be warmer on the same date.

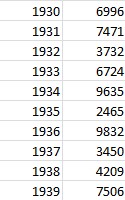
The graph below has the opposite bias. In this case, the most recent date of a tie wins. Even though the bias favors recent temperatures, the 1930s is still by far the hottest.
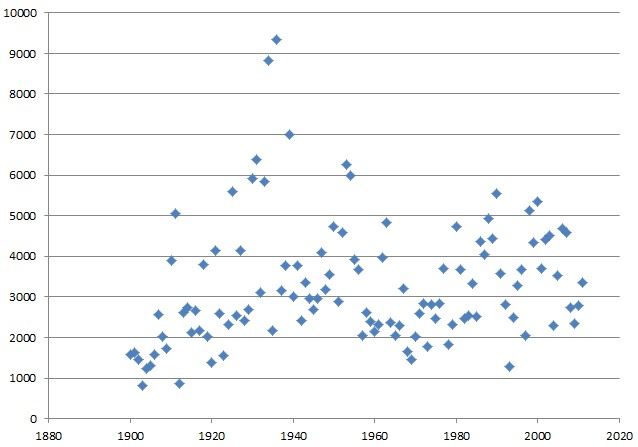
If there were thousands and thousands of daily records being set (as claimed by Masters et al) the spike would be on the right side of the graph – not on the left side.

My advice to alarmists. Try using your brain once in a while.
Posted in Uncategorized | 18 Comments

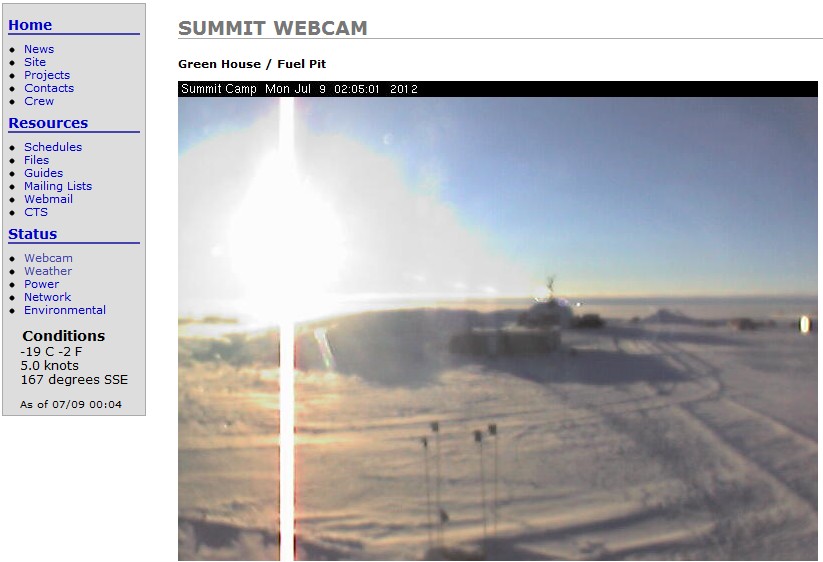
Greenland July Meltdown Continues At -19C

summit:status:webcam

Posted in Uncategorized | 13 Comments

USHCN Thermometer Data Shows No US Warming Since The Year 1900

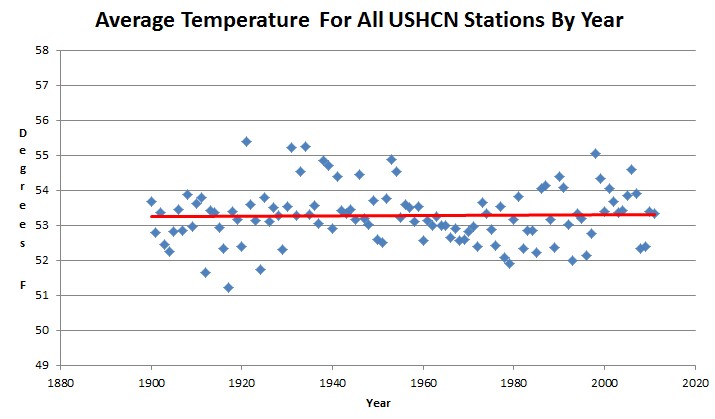
The graph below plots the average temperature (by year)  of all valid daily maximum and daily minimum readings, for all USHCN stations since 1900. As you can see, there has been no warming in the US, and the three hottest years (in order) were 1921, 1934 and 1931.

Also note that 2008 and 2009 were two of the coldest years on record in the US.

USHCN Daily Data

Before they started tampering with the data in the year 2000, all the experts agreed that the US was not warming,

Phil Jones and NOAA agreed in 1989 :

February 04, 1989 Last week, scientists from the United States Commerce Department’s National Oceanic and Atmospheric Administration said that a study of temperature readings for the contiguous 48 states over the last century showed there had been no significant change in average temperature over that period. Dr. (Phil) Jones said in a telephone interview today that his own results for the 48 states agreed with those findings.

New York Times

James Hansen agreed in 1999

Empirical evidence does not lend much support to the notion that climate is headed precipitately toward more extreme heat and drought. The drought of 1999 covered a smaller area than the 1988 drought, when the Mississippi almost dried up. And 1988 was a temporary inconvenience as compared with repeated droughts during the 1930s “Dust Bowl” that caused an exodus from the prairies, as chronicled in Steinbeck’s Grapes of Wrath…..

in the U.S. there has been little temperature change in the past 50 years, the time of rapidly increasing greenhouse gases — in fact, there was a slight cooling throughout much of the country

NASA GISS: Science Briefs: Whither U.S. Climate?

The US has the best temperature record in the world. There was no valid reason to tamper with it.

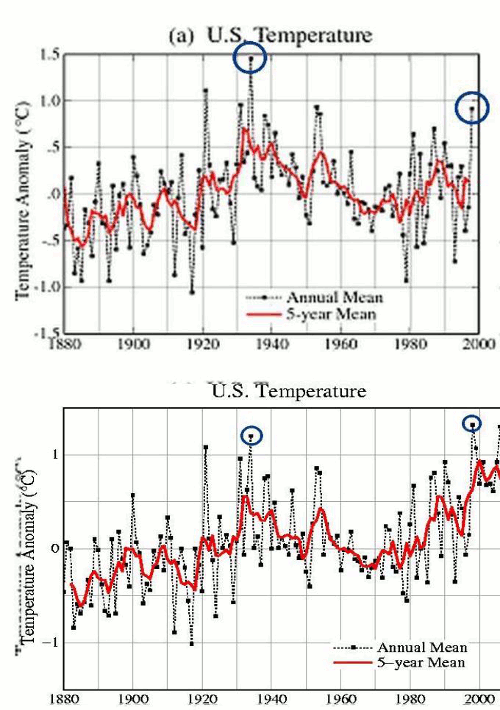
You can see the changes that GISS made after the year 1999, in the blink comparator below.

Posted in Uncategorized | 13 Comments

Heatwaves Were Much Worse Through Most Of US History

We are bombarded with statistics comparing the number of record lows to record highs, the number of record highs, etc. So I decided to look at what the actual numbers are in the USHCN database.

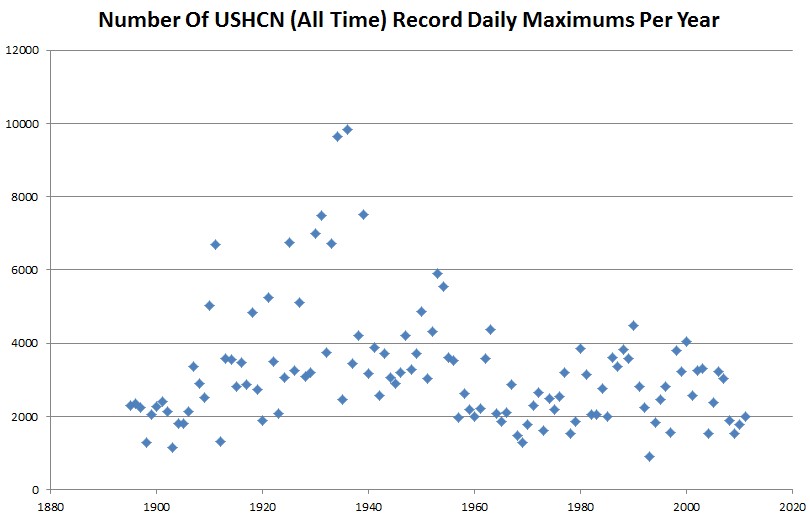
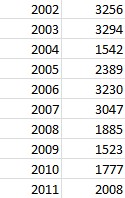
The graph below shows the number of daily record highs set per year for all USHCN stations (through 2011) which have records going back at least to 1930. The results are astonishing. 1934 and 1936 both set nearly five times as many record daily highs as 2011 did. It appears that the entire period from 1910 until 1960 was hotter than recent decades.

There have been 372,989 correctly recorded daily high temperature records in the US since 1895.  84% of them were set when CO2 was below 350ppm.

USHCN Daily Data

Compare the number of record highs in the 1930s to the past decade. You can see that the 1930s were consistently much hotter.


My guess is that most of the record highs we keep getting told about are from stations which don’t have records going back to the 1930s. The 1930s were much hotter in the US.

My next addition to this project will be to create the actual annual temperature graph for the US, based on the actual thermometer readings. My guess is that it won’t look anything like Hansen’s graph.

Posted in Uncategorized | 18 Comments

Sad Week For Alarmists

Our alarmist friends have been hoping for a return to the misery of the Dust Bowl, thinking that will somehow keep their funding coming in.

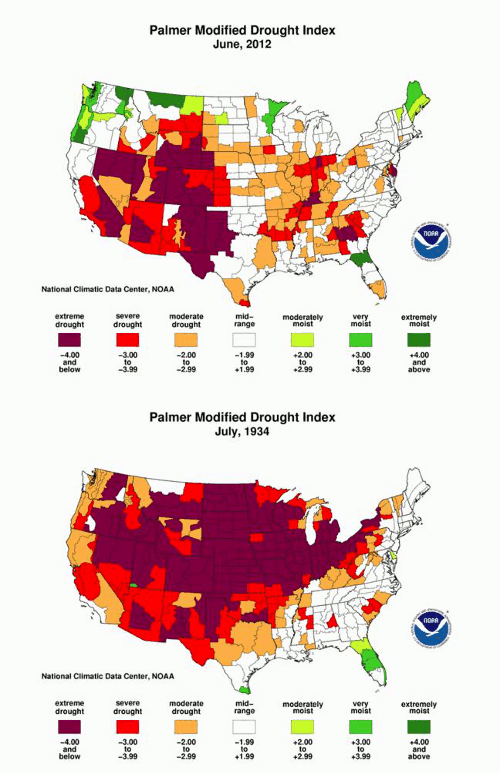
The first problem they have is that the comparisons are absurd. The Dust Bowl saw much longer lasting and more extensive droughts. Compare 2012 to 1934 below.

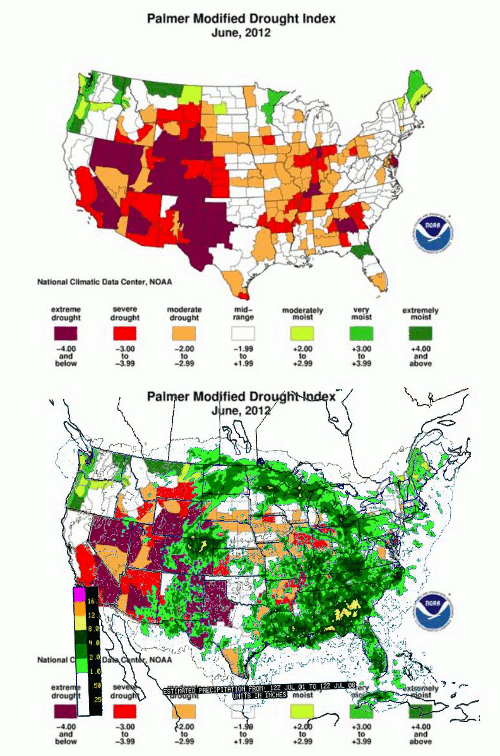
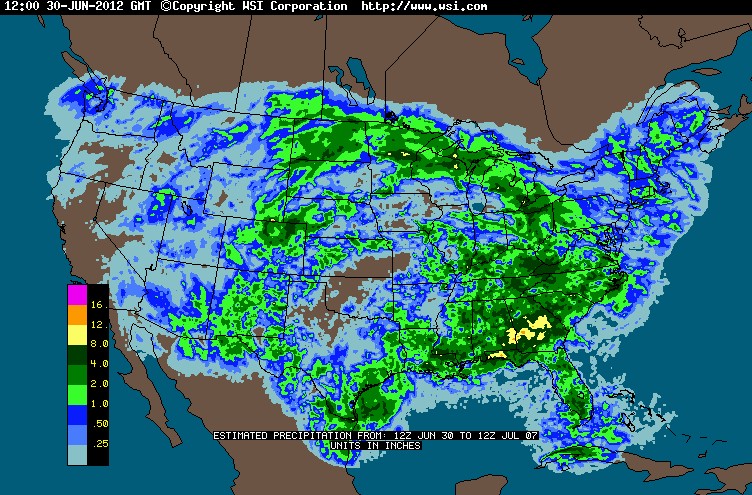
But even sadder for the humanity haters is that over the past week, much of the drought area has received one to eight inches of rain.

Intellicast – Weekly Precipitation in United States

Posted in Uncategorized | 7 Comments

Joe Romm On The Super-Drought In The UK

Joe is an equal opportunity neurotic, and does not confine his moronic forecasts to the US. Who is paying this guy to be wrong about everything?

June was wettest since records began in 1910

You felt it in your bones, but now it’s official – it was the lousiest June ever.

The month just gone was the wettest June in the United Kingdom since rainfall records began in 1910, according to provisional Met Office figures released yesterday, but it wasn’t only very wet.

It was also very cold for the time of year, and it was also very dull, and in many parts of the country, the idea of Flaming June was no more than a fantasy.

During the month, the total UK rainfall was 145.3mm – exactly twice as much as you would normally expect compared to the 1971-2000 average of 72.6mm – and this figure beats the previous record of 136.2mm, set in the incredibly wet month of June 2007.

Looking at individual countries, it has been the wettest June on record for Wales and Northern Ireland, the second wettest in England, and the eighth wettest in Scotland.

Many areas have seen extremely high rainfall – with 83 out of 237 observation sites marking their wettest June on record, the Met Office said. Some of these are not significant as they have very short recording histories, but others have been operating much longer – Otterbourne in Hampshire has been operating for 119 years.

June was wettest since records began in 1910 – Nature – Environment – The Independent

Posted in Uncategorized | 14 Comments

Dumber And Dumberer

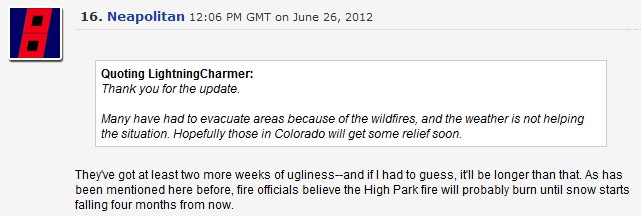
Check out this prediction from last week on Jeff Master’s blog. The High Park fire will burn until winter

Dr. Jeff Masters’ WunderBlog 

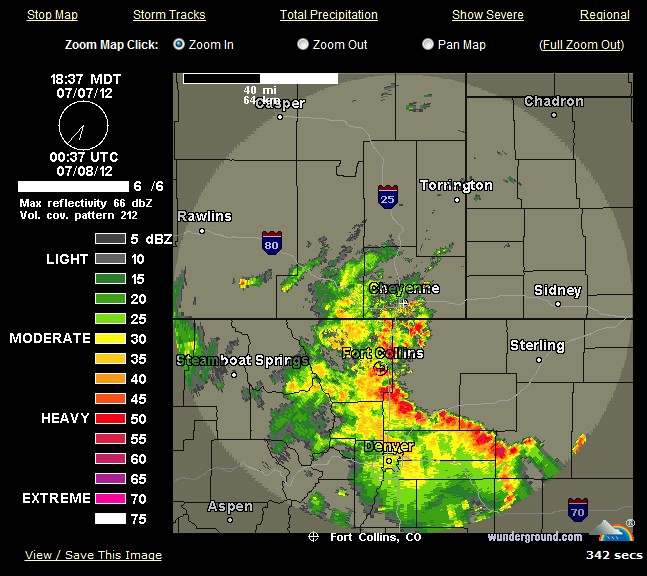
Here in High Park Fire land, we have had about 25% of our average annual rainfall – just during the last week.  You couldn’t start a fire here if your life depended on it.

Current Cheyenne NEXRAD Radar Map | Weather Underground

None of this has stopped Obama’s Department of The Interior from banning all shooting in Colorado and Wyoming. You never know when hot lead might strike flood water and spontaneously combust.

Posted in Uncategorized | 12 Comments

Just Making Up Numbers

elfish says:

Of course that is just the US. The World-Wide temperature in June of 1933 was 0.153 degrees below the 20th Century average. World Wide, the hottest June was in 2010 at 1.05 degrees above the 20th Century Average. June of 2012 hasn’t been released yet.

ftp://ftp.ncdc.noaa.gov/pub/data/anomalies/monthly.land.90S.90N.df_1901-2000mean.dat

Let’s look at what the thermometers actually showed in June, 1933. The Earth’s land surface might have had 50% coverage. The error is probably +/- 0.5C. It is spectacularly dishonest to report a global temperature within 0.001 degrees.

CRUTEM3v June, 1933

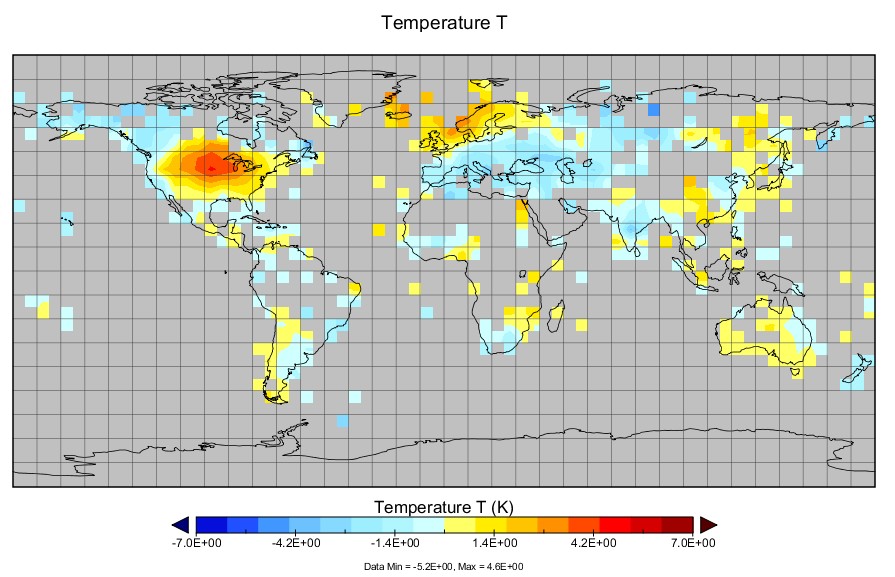
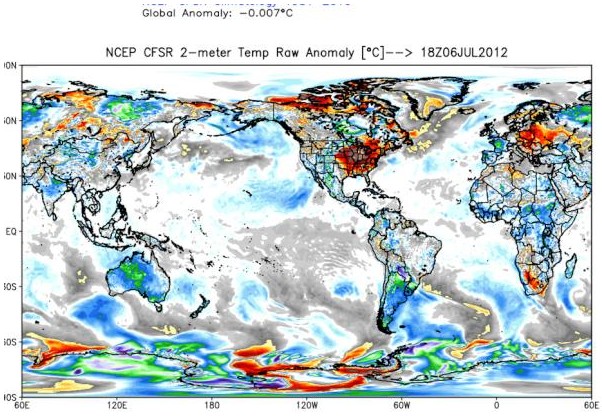
Also interesting to note that the current heatwave has been limited to the eastern US, but our friends are saying that it proves global warming. Alarmists want to have it both ways.

Posted in Uncategorized | 6 Comments

Scummy Alarmist Reporters Continue To Defile History

The Waldo Canyon fire has now been named the worst disaster in Colorado history.

Waldo Canyon Fire the Worst Disaster in Colorado History | World News Resource

These reporters are genuine pigs, defiling the memories of the past.

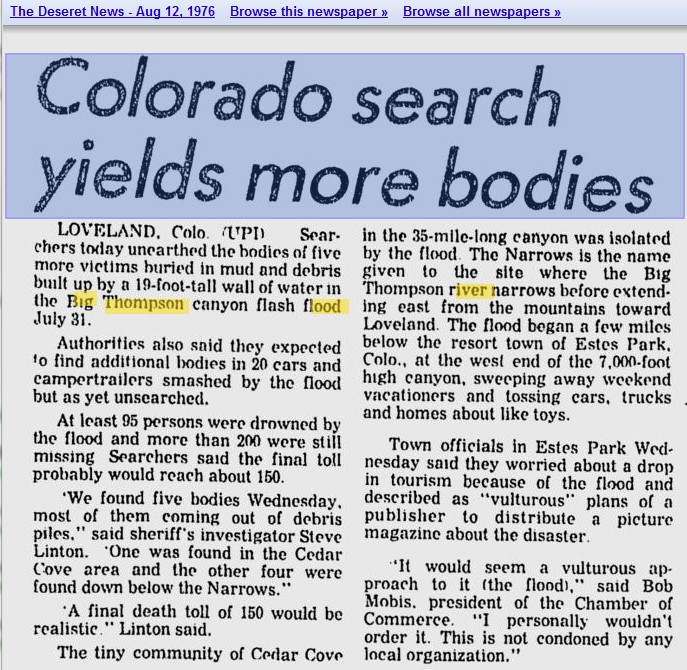
One of the worst flood disasters in US history occurred southwest of Fort Collins in 1976.

The Deseret News – Google News Archive Search

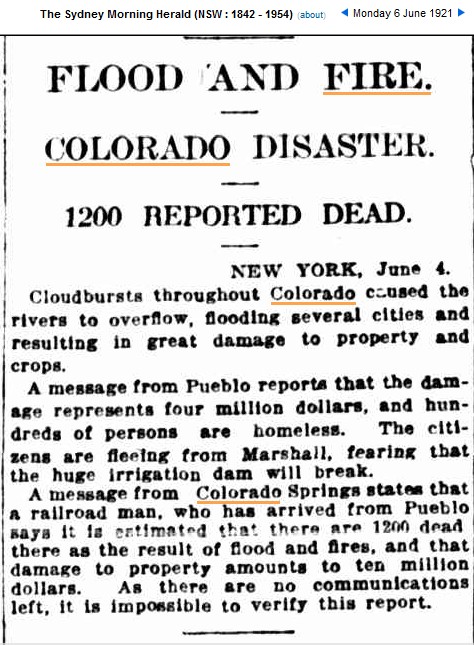
06 Jun 1921 – FLOOD AND FIRE. COLORADO DISASTER. 1200 REPORTED…

  1. FIRE AT COLORADO MINE. TWENTY-THREE MEN PERISH. [Reuter’s Message.] London, Monday.
    Barrier Miner (Broken Hill, NSW : 1888 – 1954) Tuesday 9 June 1908 p 2 Article
    … FIRE AT COLORADO MINE. TWENTY-THREE MEN PERISH. [Reuter’s Message.] London, Monday. , During a fire yesterday at the Gold King mine, Gladstone, Colorado (U.S.A.). a number of men were in peril of their lives. Three were missing and 14 returned home, but it is be- lieved that the gas overpowered … 54 words
    This resource is very relevant to your query (score: 3.562)This resource is very relevant to your query (score: 3.562)
  2. A COLORADO FIRE. HUNDRED PERSONS INJURED AND TWO KILLED. [Routor’s Message] London, Monday.
    Barrier Miner (Broken Hill, NSW : 1888 – 1954) Tuesday 13 August 1907 p 2 Article
    … A COLORADO FIRE. HUNDRED PERSONS INJURED AND TWO KILLED. {Routor’s Message] London, Monday.” : A fire broke out at the Southern Railroad Deport, Boulder, Colorado, spreading to a powder magasine containing taining 100O pounds of dynamite which exploded. A hundred larsons woro in- jured, two … 56 words
    This resource is very relevant to your query (score: 3.533)This resource is very relevant to your query (score: 3.533)

  3. MINERS’ RIOT IN COLORADO. DYNAMITE AND FIRE USED. VANCOUVER, Sept 29.
    The Sydney Morning Herald (NSW : 1842 – 1954) Friday 30 September 1910 p 7 Article
    … MINERS’ RIOT IN COLORADO. DYNAMITE AND FIRE USED. VANCOUVER, -VANCOUVER, Sept 29. A riot took place yesterday at Monarch mining camp in Colorado. Dynamite was used, and there were outbreaks of fire. One man was killed, and many men were injured. _______^____ … 42 words
    This resource is very relevant to your query (score: 3.523)This resource is very relevant to your query (score: 3.523)

  4. FIRE IN A COLORADO MINE. TWENTY-THREE PERSONS PERISH. London, June 8.
    The West Australian (Perth, WA : 1879 – 1954) Tuesday 9 June 1908 p 5 Article
    … FIRE IN A COLORADO MINE. TWENTY-THREE PERSONS PERISH. London, June 8. During a fire in the Gold King mine at Gladstone, in Colorado. on Saturday, 34 men entered the workings to rescue scue three missing miners. Only fourteen of the rescue party re turned, and it is believed that gas over powered … 60 words
    This resource is very relevant to your query (score: 3.5)This resource is very relevant to your query (score: 3.5)

  5. DISASTER IN COLORADO. A MINE ON FIRE. MANY LIVES LOST. London, November 22.
    The Advertiser (Adelaide, SA : 1889 – 1931) Saturday 23 November 1901 p 7 Article
    … DISASTER IN COLORADO. A MINE ON FIRE. MANY LIVES LOST. London, November 22. A fearful disaster is reported from Telluride, luride, Colorado. A fire broke out at the mouth of ¡the Smuggler Union mine, and the tunnel soon became filled with smoke and sulphur gas. Numerous men were en- gaged in the … 66 words
    This resource is very relevant to your query (score: 3.486)This resource is very relevant to your query (score: 3.486)

Posted in Uncategorized | 4 Comments

Southwest Permanent Drought Update

You can locate the High Park fire by looking for 4+ inches of rain on the map.

Intellicast – Weekly Precipitation in United States

Posted in Uncategorized | 2 Comments