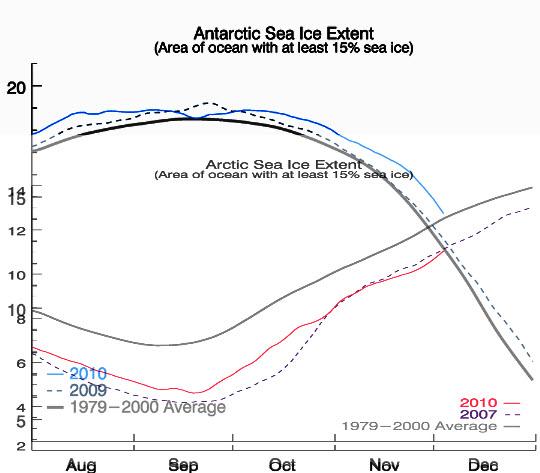
NSIDC Shows Global Sea Ice Excess Increasing

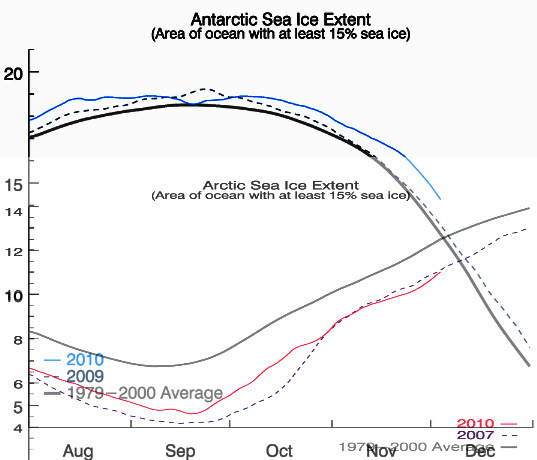
Arctic ice extent overlaid on Antarctic extent. The positive anomaly in the south is larger than the shrinking negative anomaly in the north, when shown at the same scale.

Yes, they are at the same scale, as you can see below in an un-shifted version.
 

Posted in Uncategorized | 3 Comments

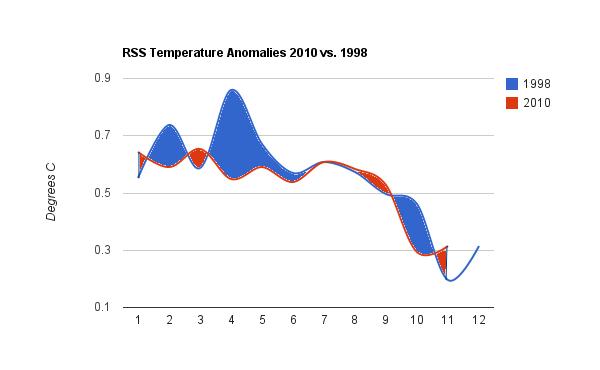
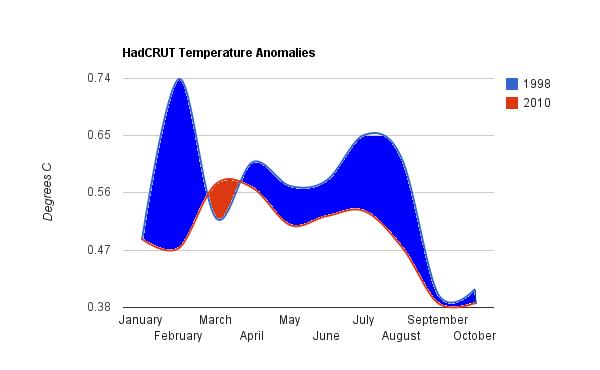
RSS 2010 vs 1998

http://www.remss.com

Dr. Hansen says that he “wouldn’t be surprised” if everyone else agrees that 2010 is the hottest year, but RSS has 2010 considerably cooler than 1998. Temperatures have plummeted since mid-November, so it would require an extraordinary extra-terrestrial event to make Hansen’s statement correct . HadCRUT also shows 1998 much warmer than 2010.


Posted in Uncategorized | 5 Comments

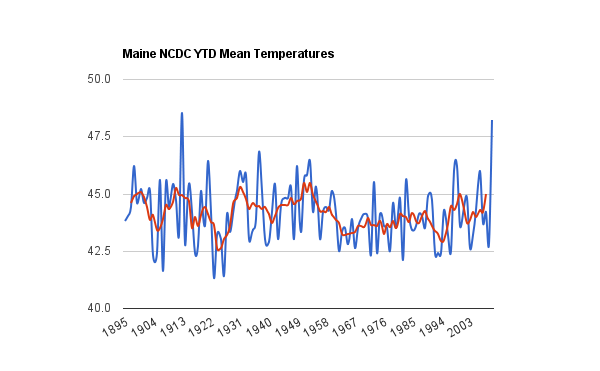
Global Warming In Maine

Temperatures in Maine peaked from 1895 to 1950, with the warmest year in 1913 -when CO2 was 301 ppm. Even with upwards adjustments of newer temperatures and downwards adjustments of older temperatures, they haven’t been able to get 2010 up to #1. Fourteen of Maine’s twenty hottest years occurred before 1960.

Continue reading →

Posted in Uncategorized | 3 Comments

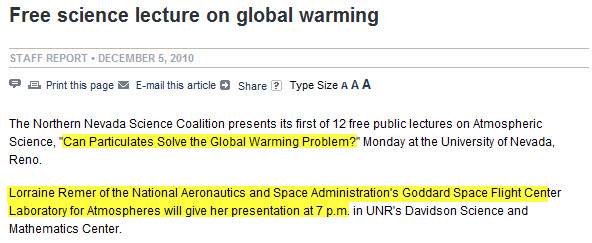
NASA Wants To Pollute The Atmosphere To Solve An Imaginary Problem They Created

http://www.rgj.com/

Posted in Uncategorized | 4 Comments

Publicly Funded NPR Denies That They Function As A Left Wing Advocacy Group Despite Scientific Evidence To The Contrary

http://www.npr.org

Posted in Uncategorized | 3 Comments

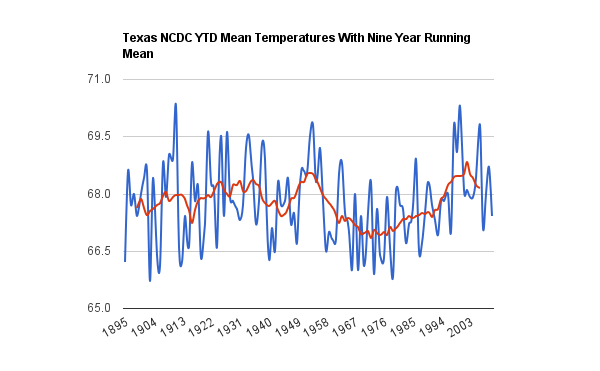
Global Warming In Texas

NCDC Texas year-to-date mean temperatures with five year running mean in red. Texas warmed from 1895 to 1950, cooled for 15 years, and then warmed again until the late 1990s. Fifteen of Texas’s twenty warmest years occurred before 1960. The warmest year was 1911, when CO2 levels were 300 ppm. Even with USHCN upwards adjustments of recent data and downwards adjustments of past data, Texas has not shown any warming.

Continue reading →

Posted in Uncategorized | Leave a comment

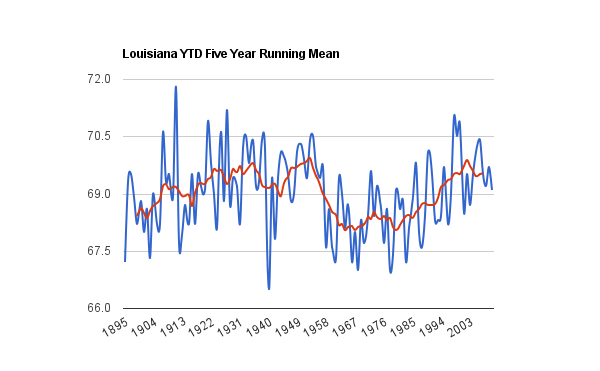
Global Warming In Louisiana

NCDC Louisiana year-to-date mean temperatures with five year running mean in red. Louisiana warmed from 1895 to 1950, cooled for 15 years, and then warmed again until the late 1990s. Fifteen of Louisiana’s twenty warmest years occurred before 1960. The warmest year was 1911, when CO2 levels were 300 ppm. Even with USHCN upwards adjustments of recent data and downwards adjustments of past data, Louisiana has not shown any warming.

Continue reading →

Posted in Uncategorized | 6 Comments

Snow Is A Thing Of The Past

http://www.bbc.co.uk/news/uk-england-york-north-yorkshire-11921396

Is there any reason why people still listen to climatologist’s forecasts?

h/t to Malaga View

Posted in Uncategorized | 3 Comments

Temperatures Plummeting On The US West Coast Over The Past Decade

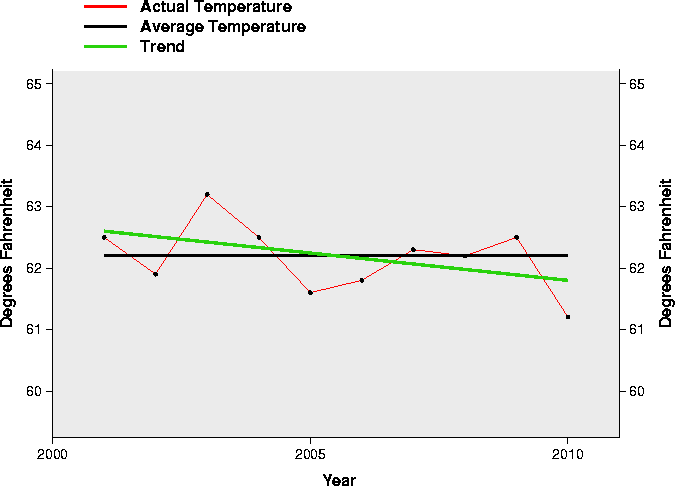
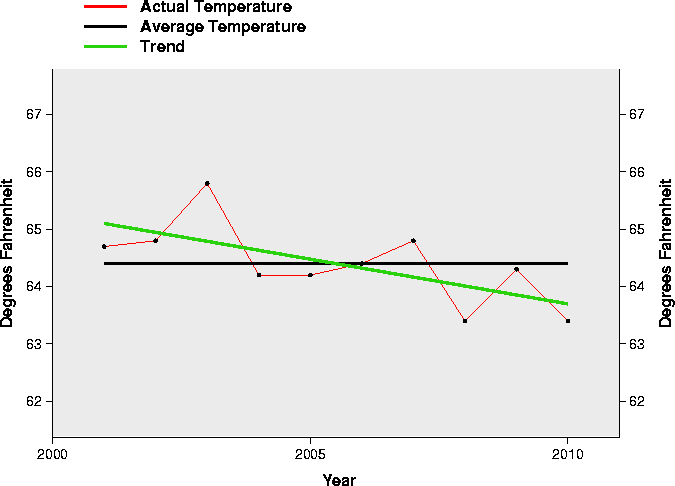
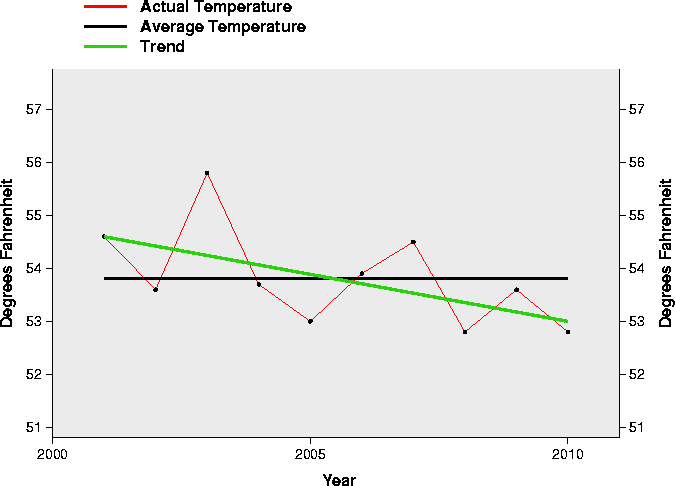
Year to date temperatures in all of the west coast states are dropping at a rate of between 5 and 20 degrees per century.

California

Arizona

Nevada

Continue reading →

Posted in Uncategorized | 11 Comments

Another USHCN Oregon Site With No Warming

More evidence that the OCCRI claims are bogus.

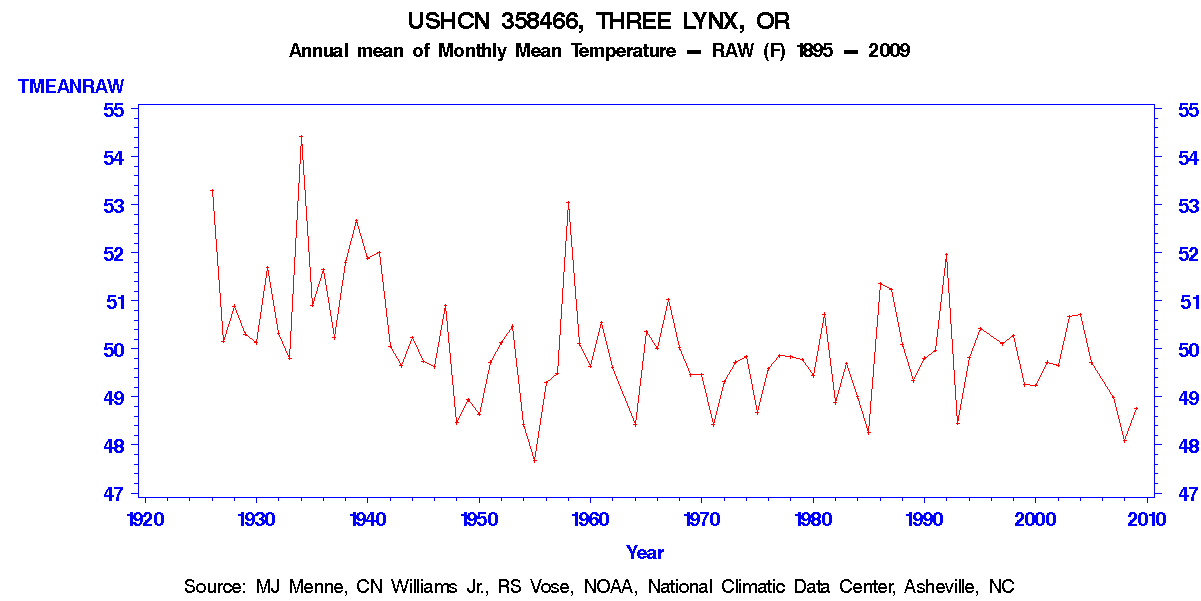
Raw thermometer data shows a significant decline.

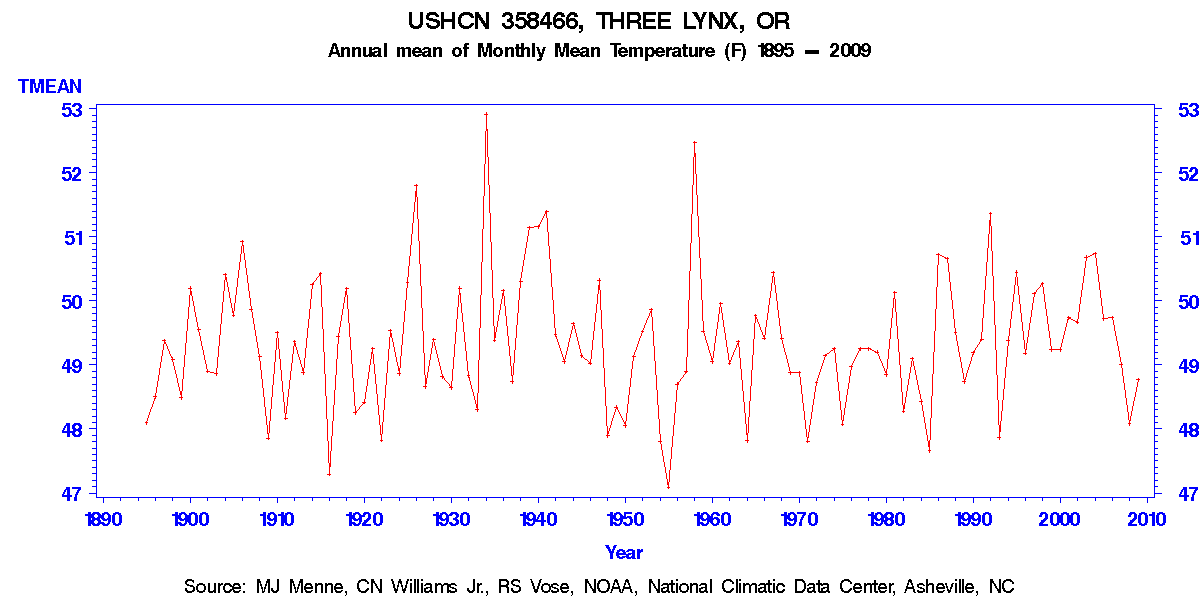
Adjusted data hides most of the decline, but still no warming trend. The 1930s was the hottest.

Posted in Uncategorized | 1 Comment