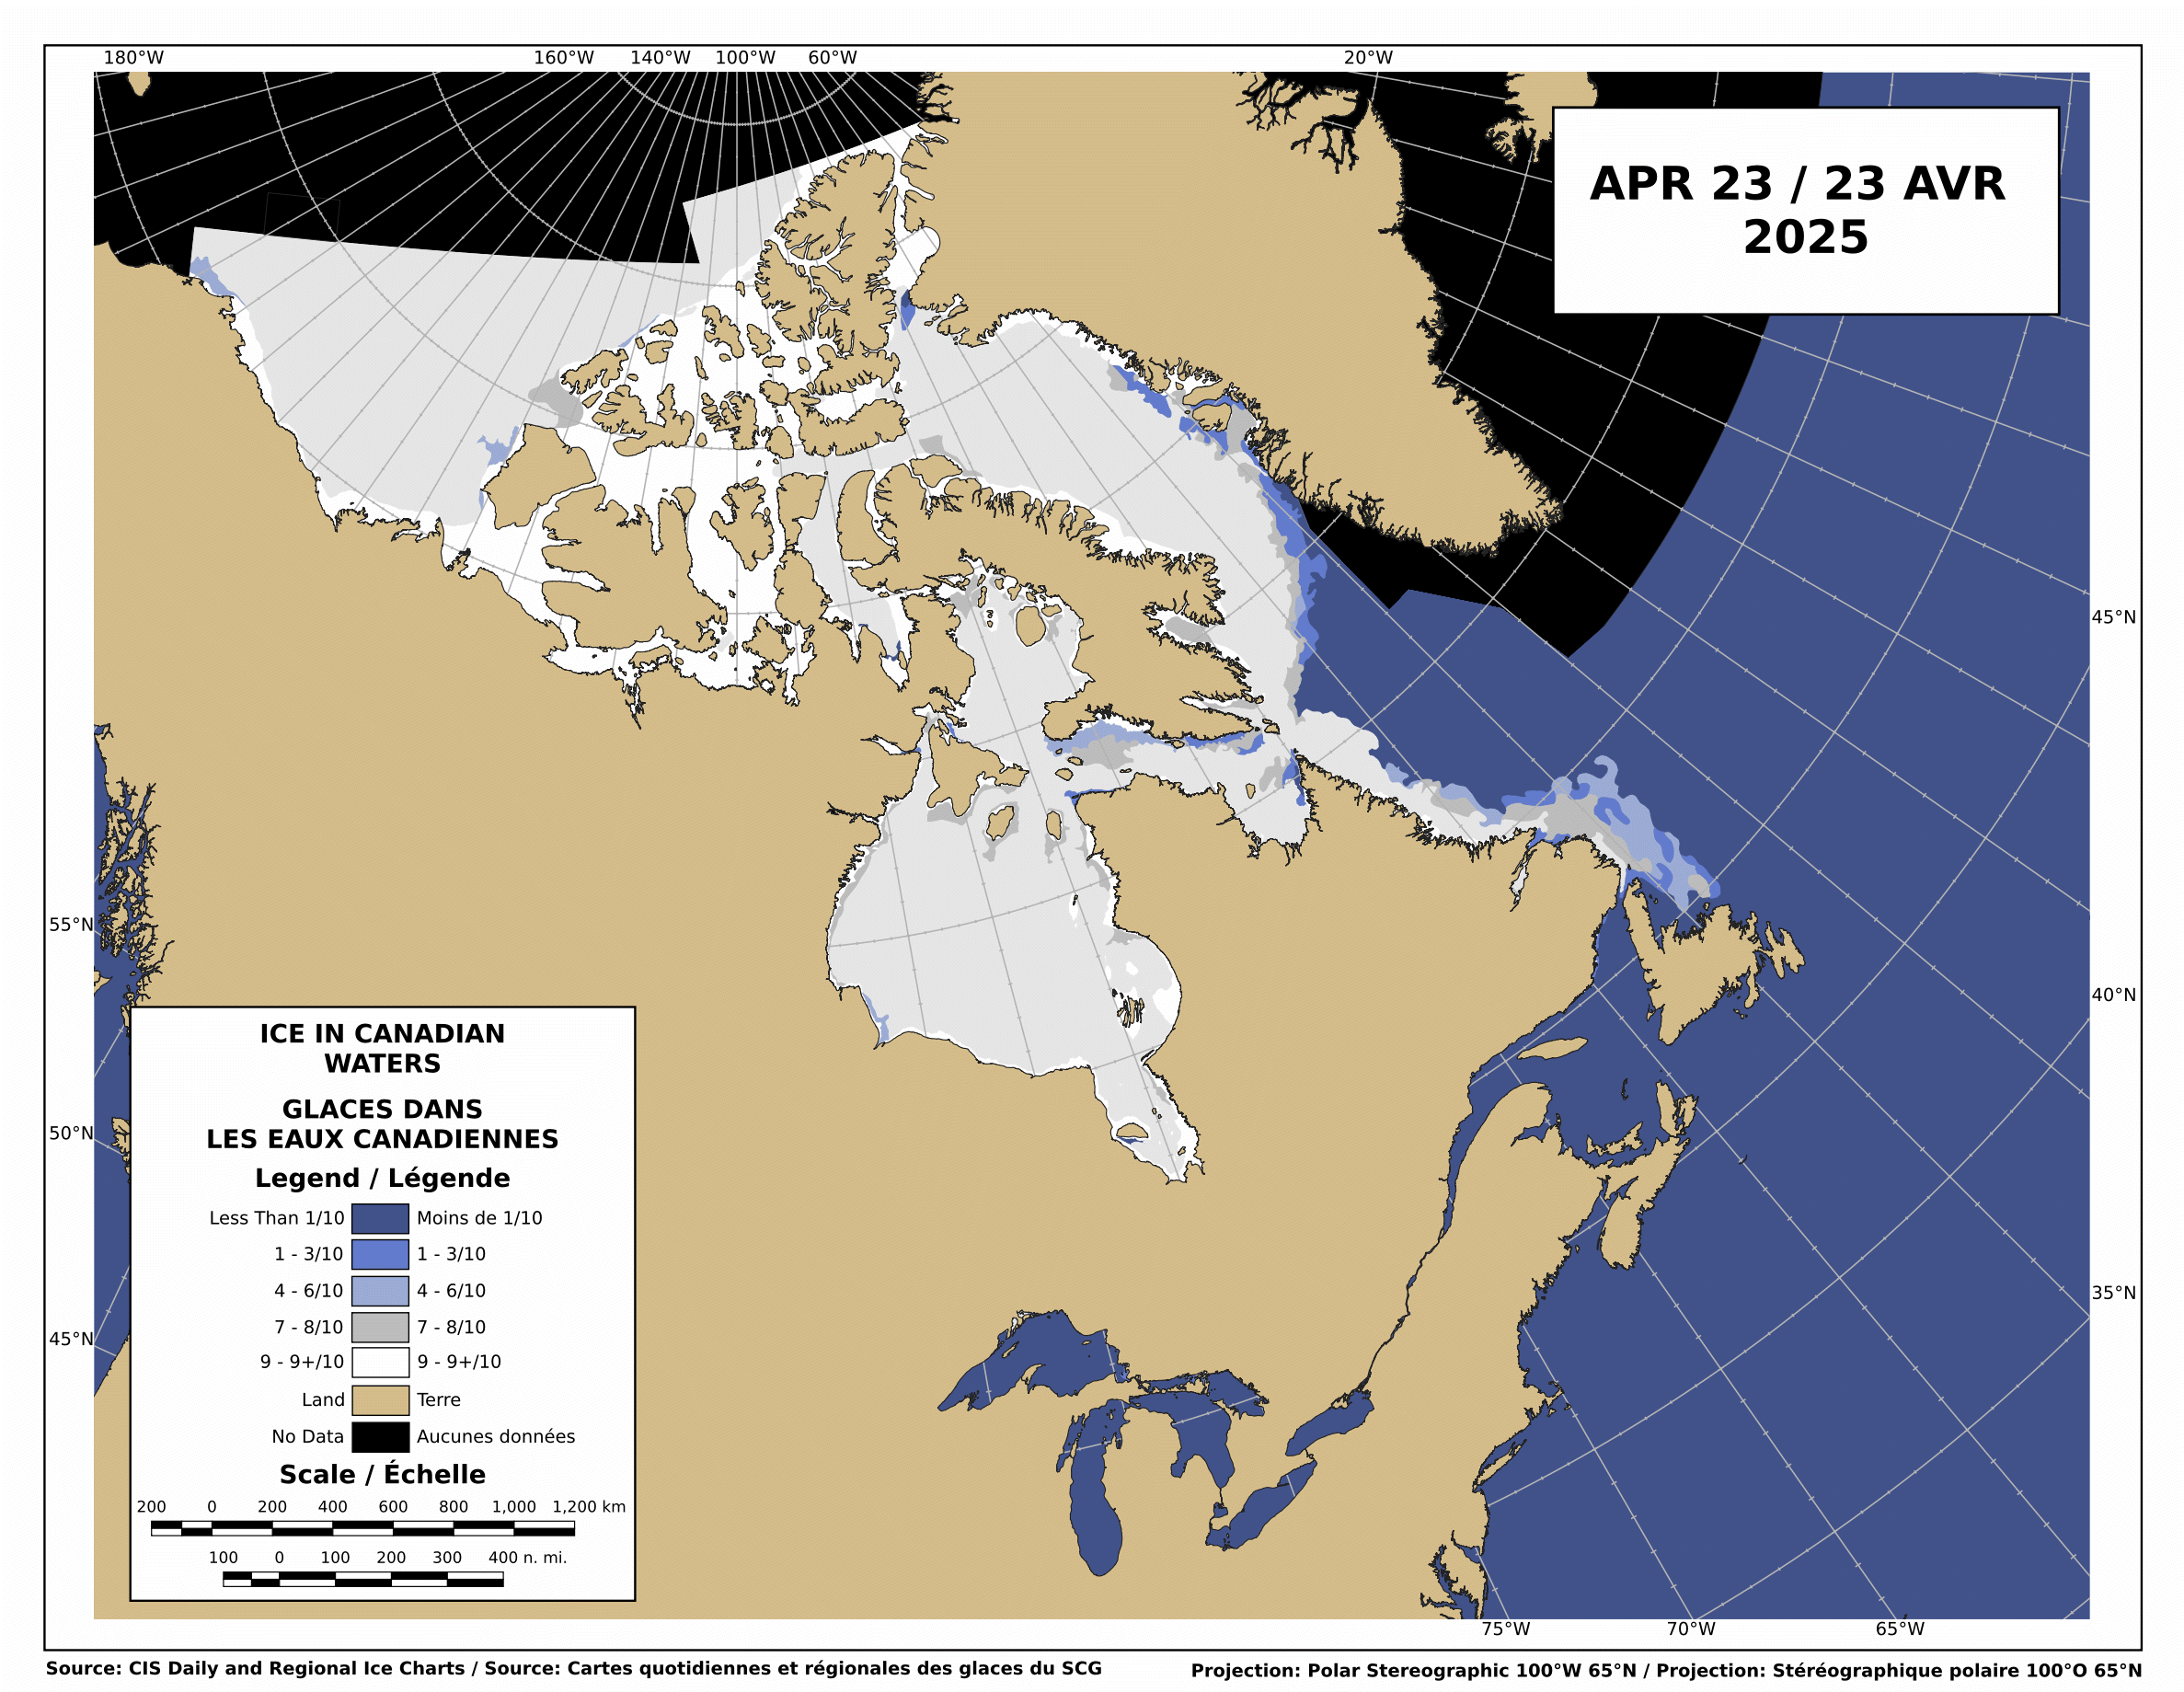

http://ice-glaces.ec.gc.ca/Ice_Can/CMMBCTCA.gif
“It is a little bit tricky — lots of fog and ice,” Börje Ivarsson, a Swedish adventurer who just finished a two-year journey from Russia to Inuvik on a 30-foot boat, told CBC News.
http://ice-glaces.ec.gc.ca/Ice_Can/CMMBCTCA.gif
“It is a little bit tricky — lots of fog and ice,” Börje Ivarsson, a Swedish adventurer who just finished a two-year journey from Russia to Inuvik on a 30-foot boat, told CBC News.

Spring has arrived in the Southern Hemisphere and Mr. Sun has decided to spend the next six months down there. He prefers the warm weather, but is facing a lot of cold water this year.

Igor left a lot of cold water behind, making life a lot tougher for Lisa. He ruined Julia’s plans, and has already moved on.
Now he is aiming for the red bullseye in Baffin Bay.

1. Heat
2. Cold
3. Mild temperatures
4. Wet
5. Dry
Continue reading
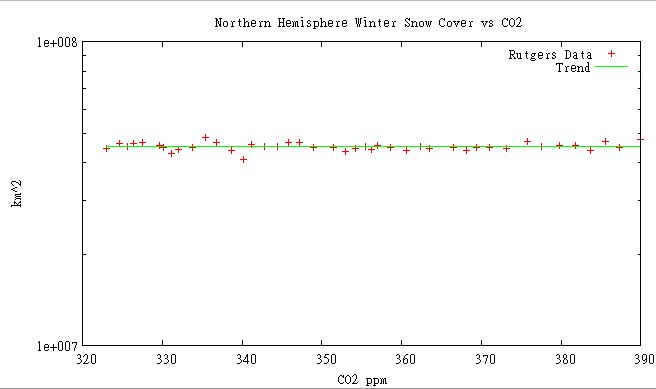
The graph above plots Rutgers Northern Hemisphere winter snow cover vs. atmospheric CO2. At first glance, it appears that there is no correlation between the two.
But we know that can’t be true, because leading experts from CRU told us a decade ago that due to global warming, snowfalls are now just a thing of the past.
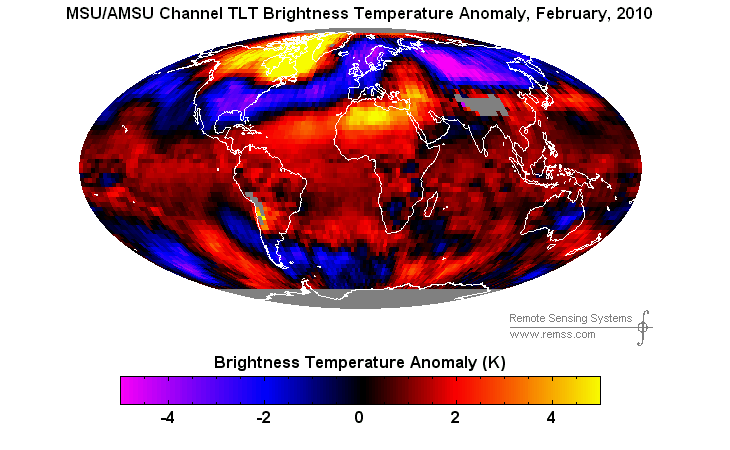
Correction : reader John Finn has pointed out that GISS recorded February as the second hottest February ever, not the hottest.
—————————————————————————————————
February, 2010 was a very cold month across the US, much of Europe and most of Russia and Mongolia. It was the fourth snowiest month on record in North America (out of 517 months) and the eighth snowiest month on record in the Northern Hemisphere.
GISS shows it as the (second) hottest February on record. Why?
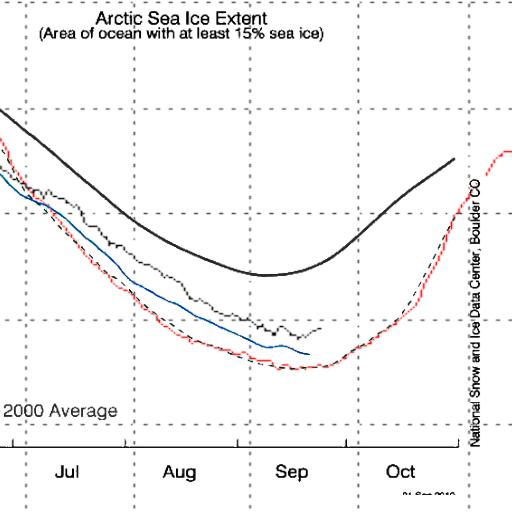
NSIDC measures 15% concentration ice. DMI measures 30% concentration ice. NSIDC always reports more ice, because they measure it at a lower threshold.
The graph above normalises the two by visually lining up 2007 – NSIDC dashed and DMI red. The match for 2007 is nearly perfect from July through October.

NCAR graph from 1975 showing rapid cooling after WWII.
Our friends didn’t like the fact that temperatures cooled dramatically when they were supposed to be rising (due to the carbon sins of mankind.) So they found a way to blame that on people too. For a while ….