




Disrupting the Borg is expensive and time consuming!

Google Search
-
Recent Posts
- Three Years Since The Apocalypse
- Arctic Report card Summer 2026
- Elon Pushing Pushing Geoengineering
- Earth, Wind And Fire
- On The Road Again
- Vandalism At The Reflecting Pool
- Fifty Years Ago Today
- Truth Or Consequences
- US Climate Trend Maps
- Declining Spring Snow Cover In Northern New Mexico
- You Can’t Fool Mother Nature
- Cattle And The Climate
- One Atomic Bomb Per Hour
- New Video : Analyzing Oil And Gas
- Is Antarctica Melting?
- High Speed Analysis And Visualization
- El Nino To The Rescue?
- Fake News Update
- Growth Of Antarctic Sea Ice
- 65 Years Of Progress!
- El Nino To The Rescue?
- Worst March Drought On Record
- ChartGL Process Control Demo
- The Biggest Money Laundering Scam
- Drought In The Headwaters Of Lake Powell
September 2026 M T W T F S S 1 2 3 4 5 6 7 8 9 10 11 12 13 14 15 16 17 18 19 20 21 22 23 24 25 26 27 28 29 30 Recent Comments
- GW on Arctic Report card Summer 2026
- GW on Three Years Since The Apocalypse
- arn on Three Years Since The Apocalypse
- Gordon Vigurs on Three Years Since The Apocalypse
- Gordon Vigurs on Three Years Since The Apocalypse
- Denis Rushworth on Three Years Since The Apocalypse
- conrad ziefle on Earth, Wind And Fire
- Crispin Pemberton-Pigott on Three Years Since The Apocalypse
- Robertvd on Arctic Report card Summer 2026
- conrad ziefle on Three Years Since The Apocalypse
Extreme Fraud At NOAA
NOAA’s Climate Extremes Index shows summer afternoon temperatures much above normal are affecting more and more of the US, with the past decade was highest on record.

They show an upwards trend beginning around fifty years ago.

U.S. Climate Extremes Index (CEI) | Extremes | National Centers for Environmental Information (NCEI)
But their thermometer data shows the exact opposite, as does the National Climate Assessment. There are 1,218 stations in the United States Historical Climatology Network.
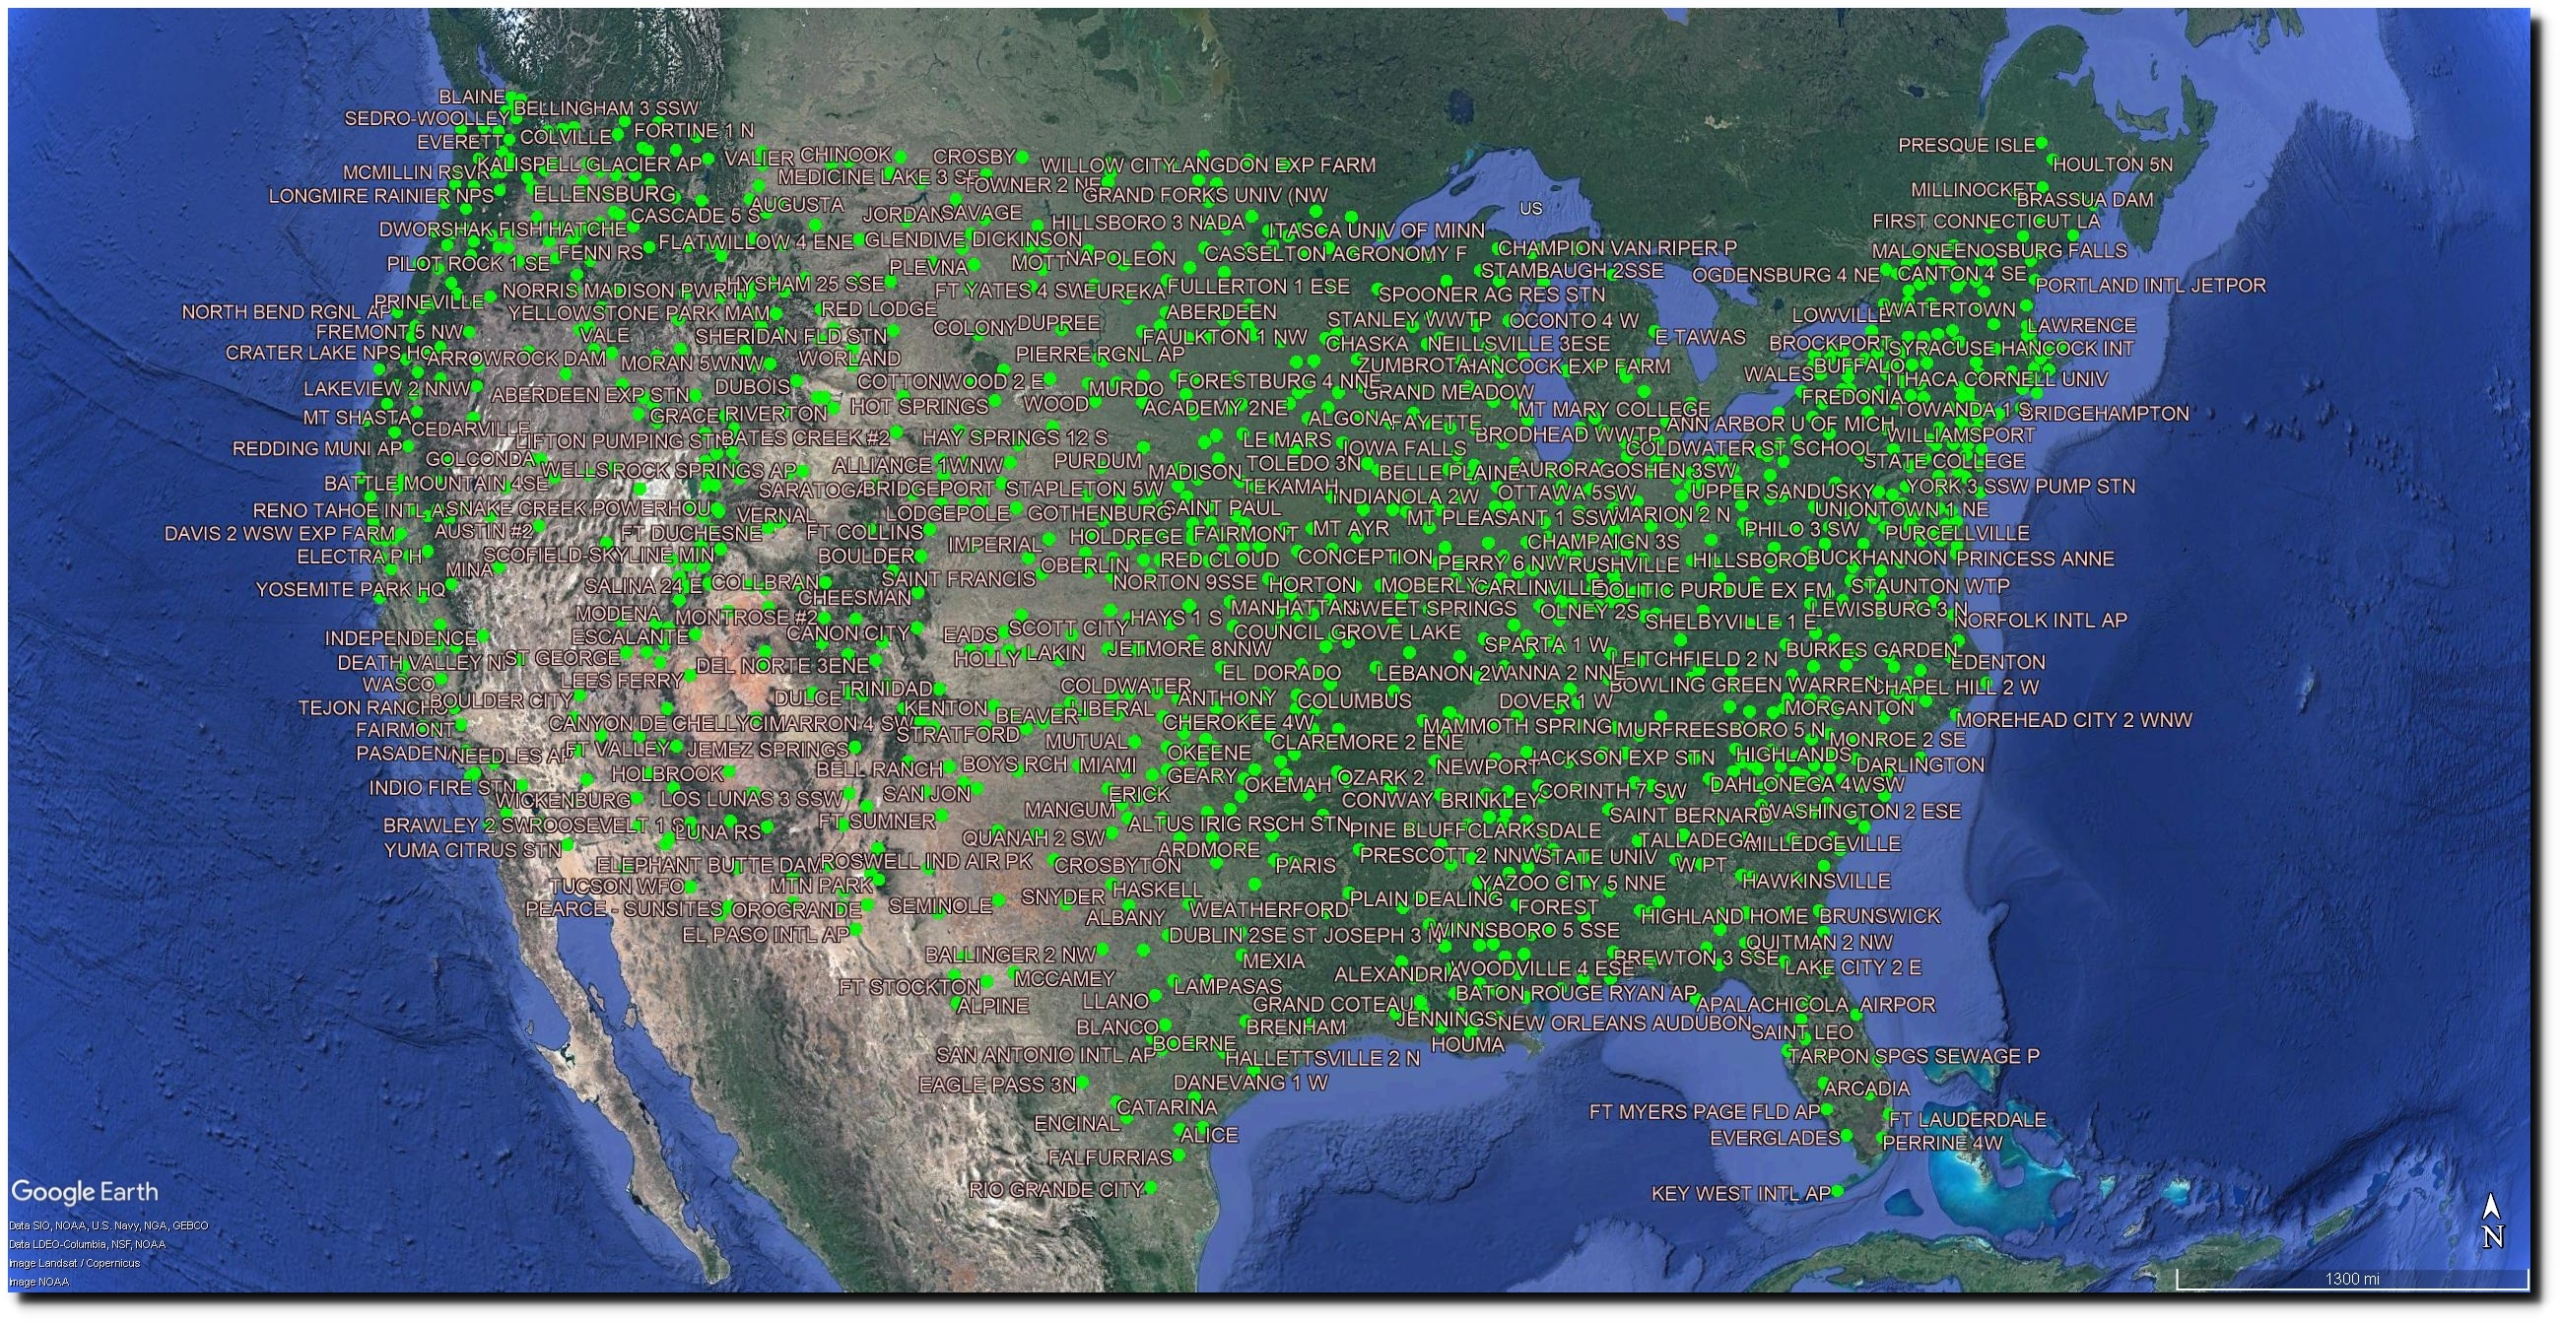
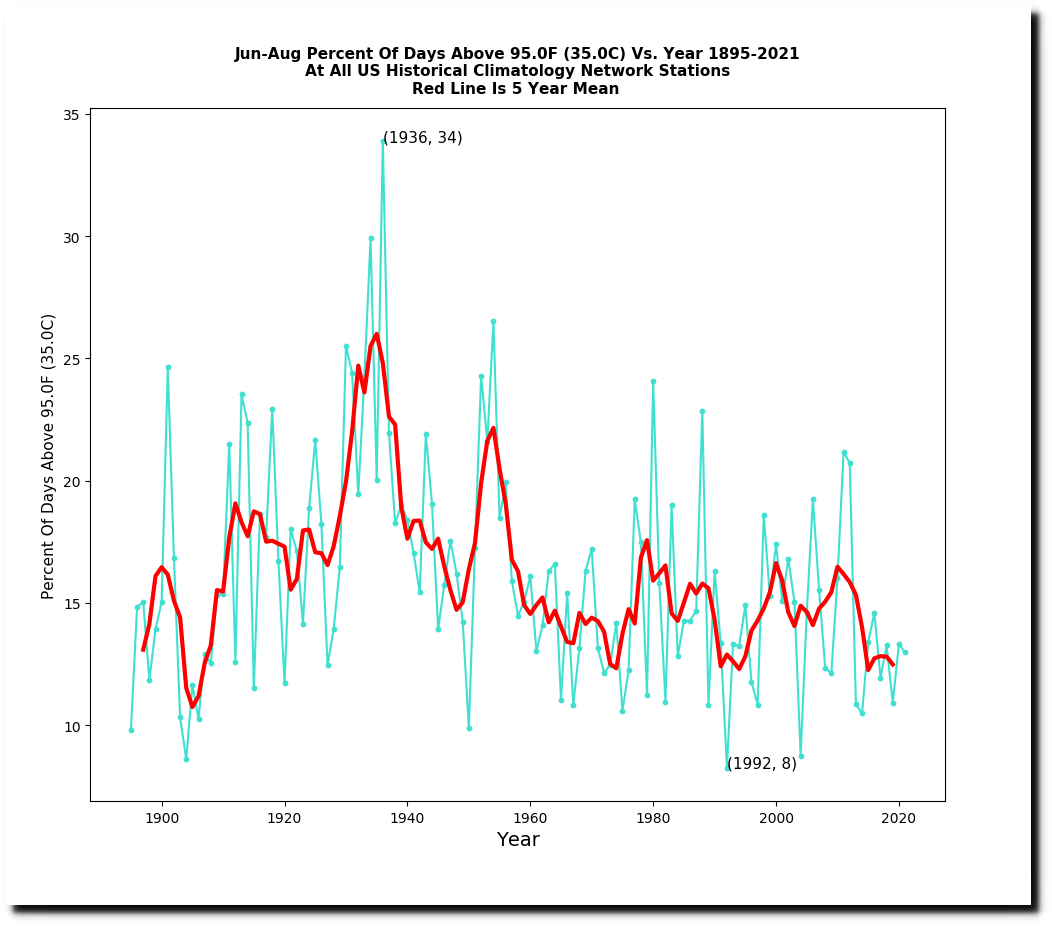
The percentage of stations reaching 95F sometime during the summer has declined sharply over the past ninety years.


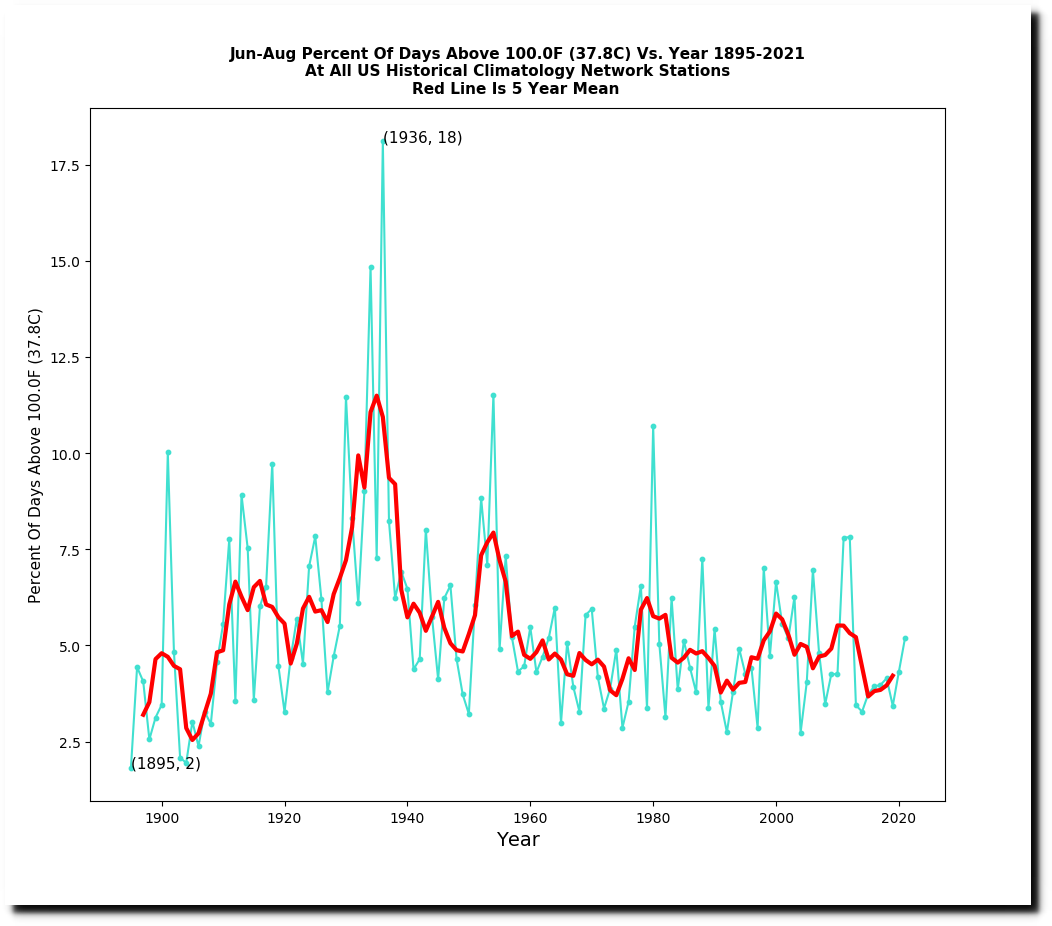
So has the frequency of hot days.


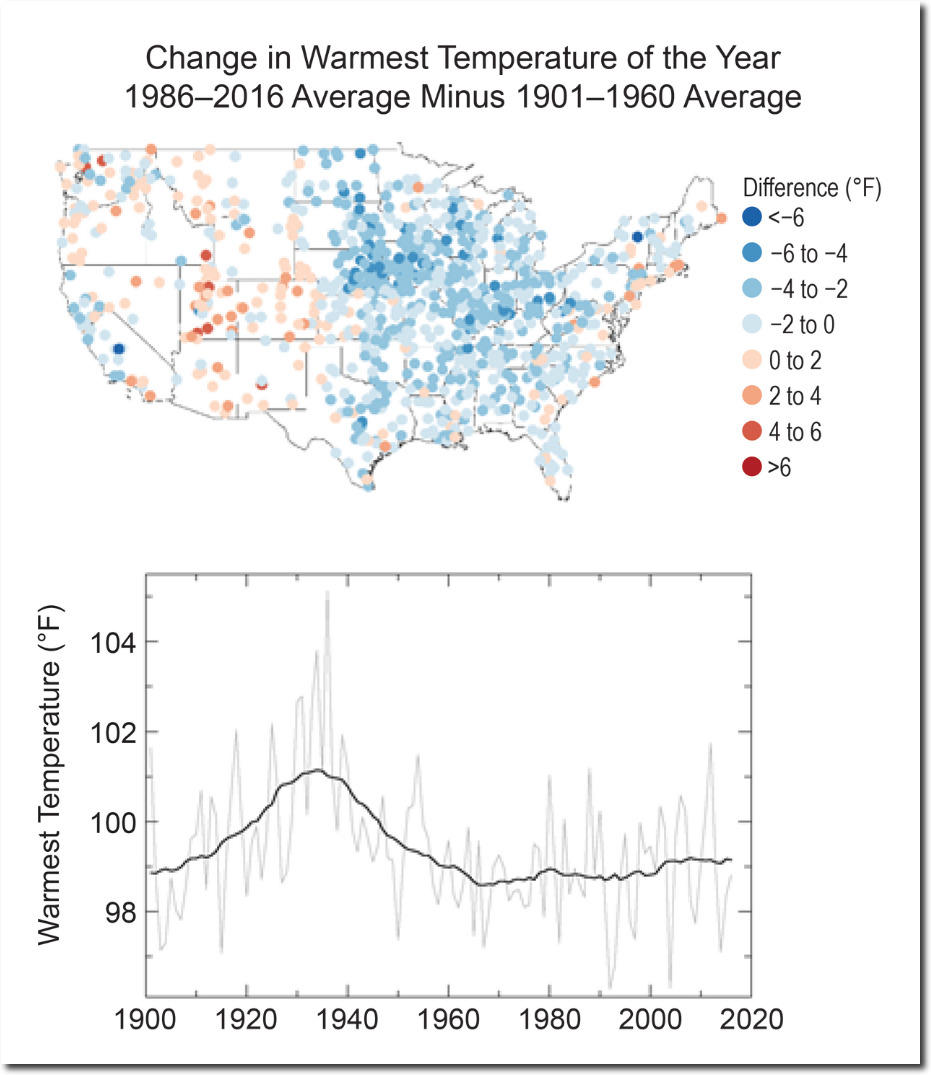
Temperature Changes in the United States – Climate Science Special Report
Here is how they reversed the trend. This is the NOAA daily temperature data for the US.

ftp://ftp.ncdc.noaa.gov/pub/data/ghcn/daily/ghcnd_hcn.tar.gz
Their raw monthly data set is nearly identical.
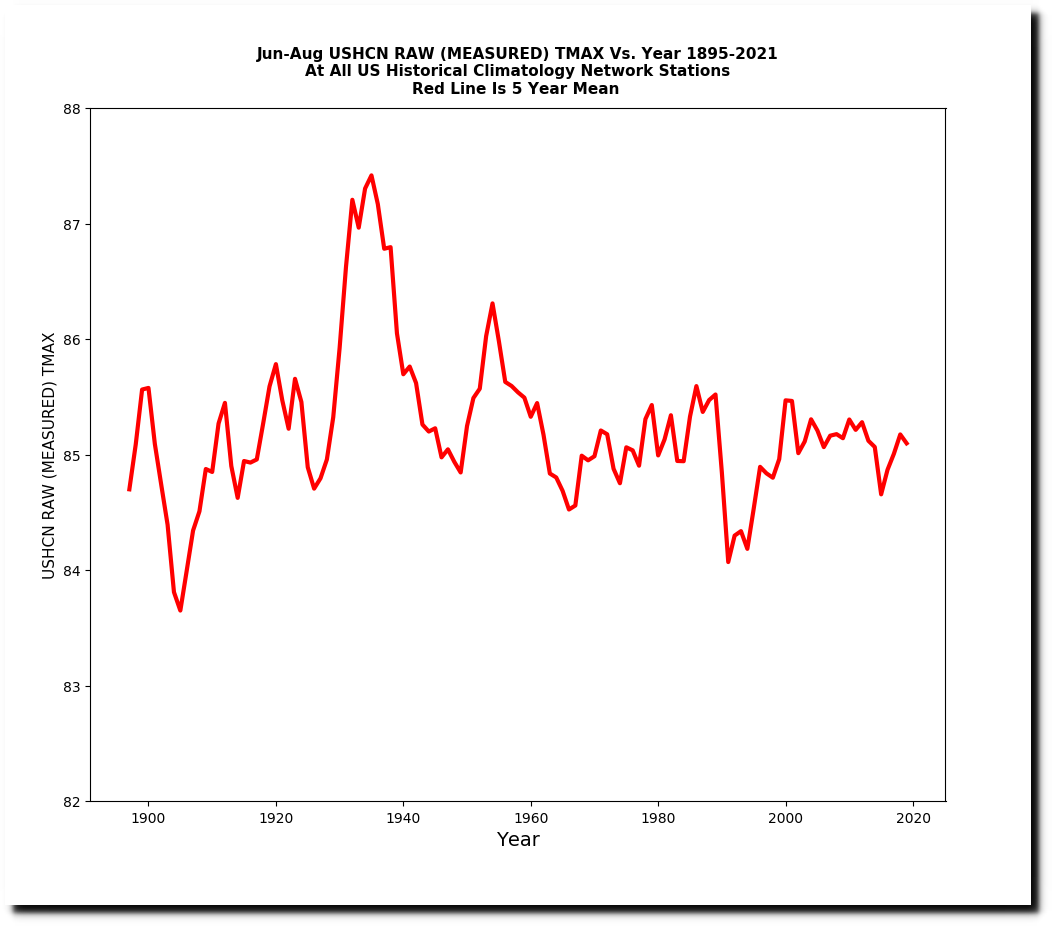
ftp://ftp.ncdc.noaa.gov/pub/data/ushcn/v2.5/ushcn.tmax.latest.raw.tar.gz
Time of Observation Bias adjusted data is not much different.
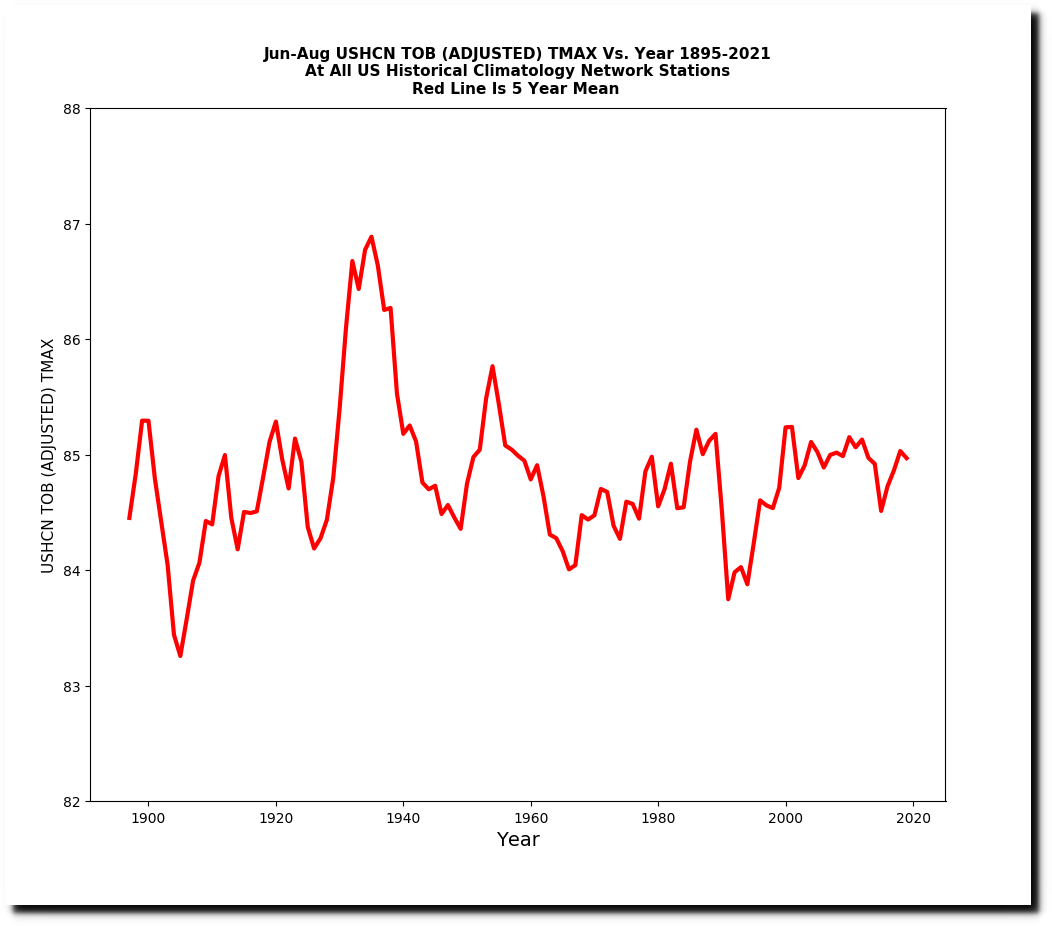
ftp://ftp.ncdc.noaa.gov/pub/data/ushcn/v2.5/ushcn.tmax.latest.tob.tar.gz
But the final adjusted data set shows a strong warming trend over the past fifty years.
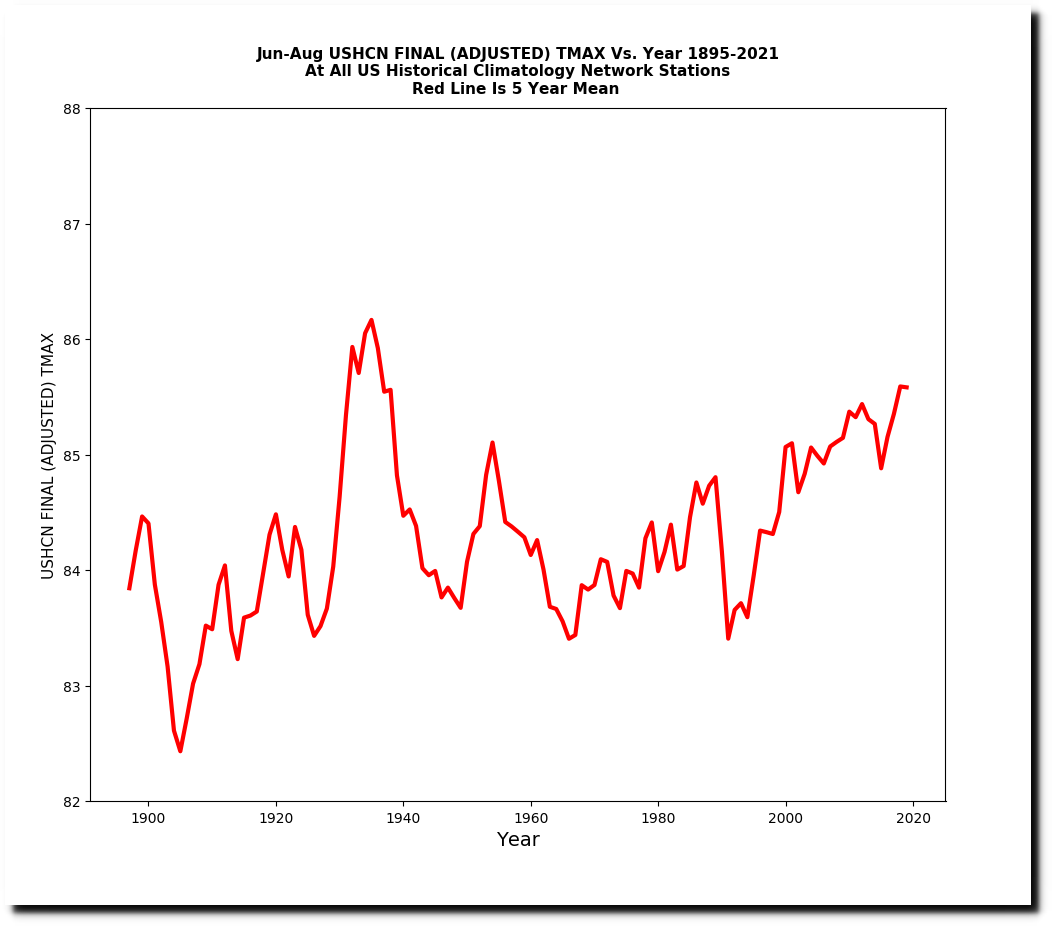
ftp://ftp.ncdc.noaa.gov/pub/data/ushcn/v2.5/ushcn.tmax.latest.tob.tar.gz
The final data set has diverged from the measured data by almost two degrees over the past forty years.
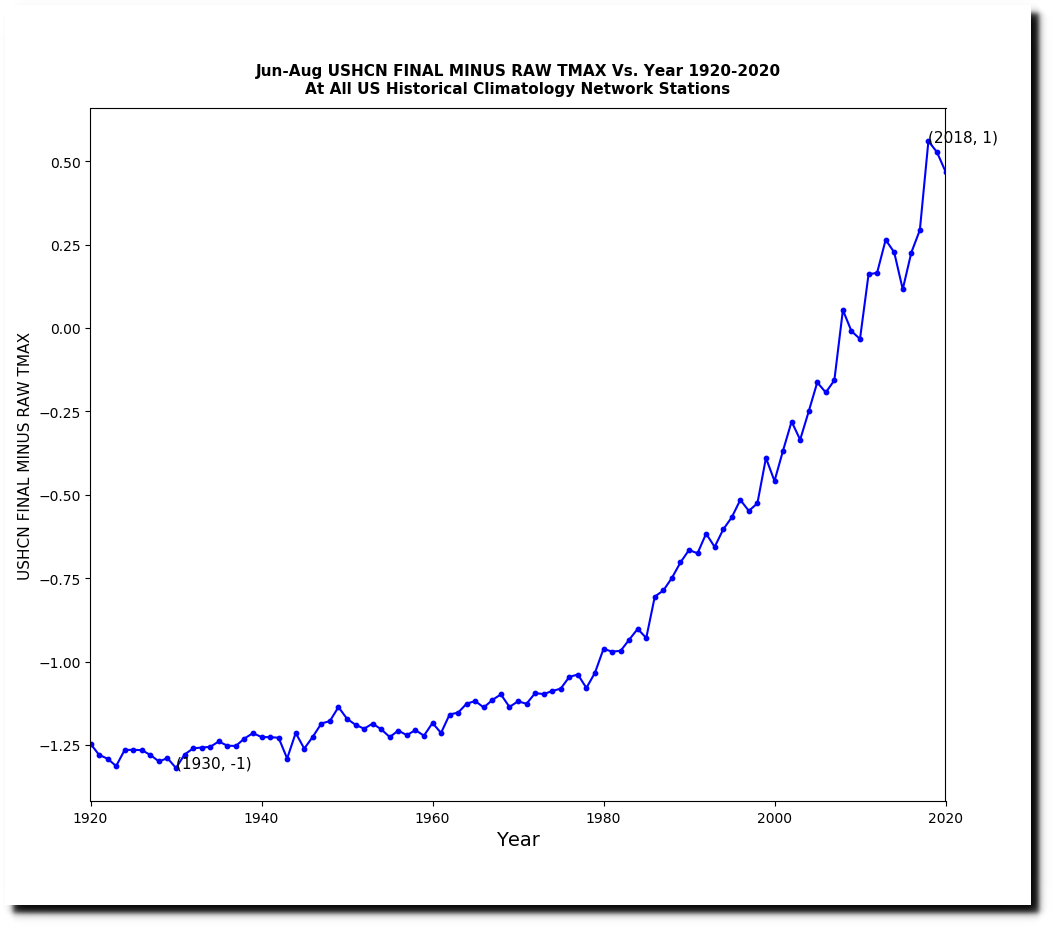
This warming trend since 1970 does not exist in the thermometer data, so where does it come from?
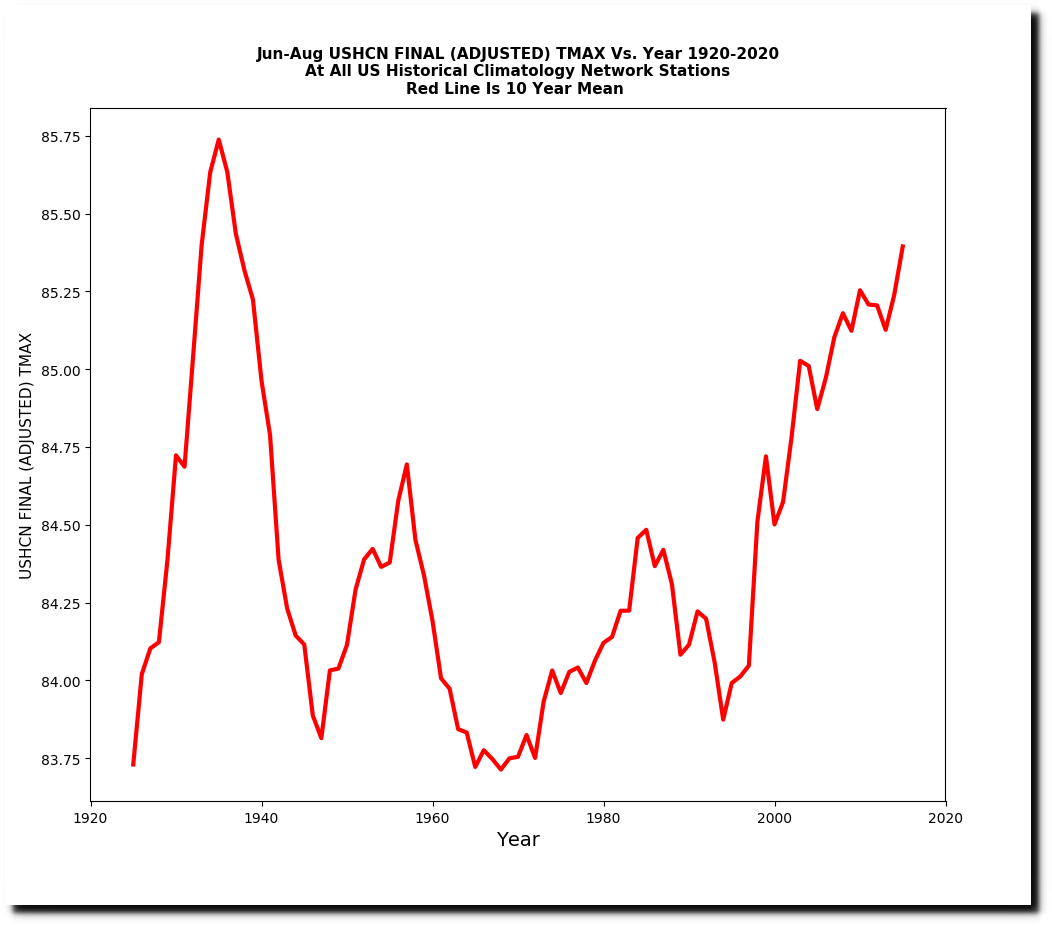
There has been a large decrease in the number of stations reporting data over the past 30 years. But in the final adjusted data set, they use temperatures for all 1,218 stations regardless of whether or not there is actually any thermometer data.
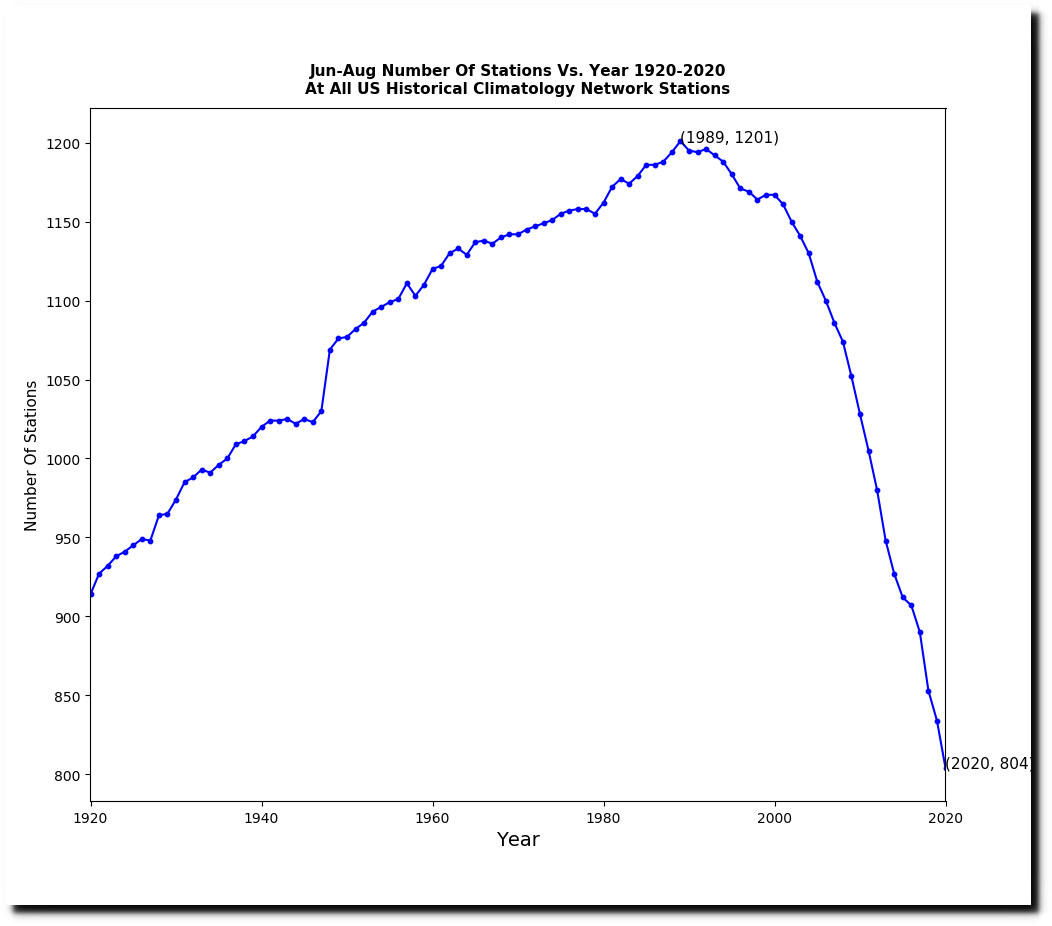
In other words, they are simply making up data. More than 40% of the data in the final data set is now fabricated.
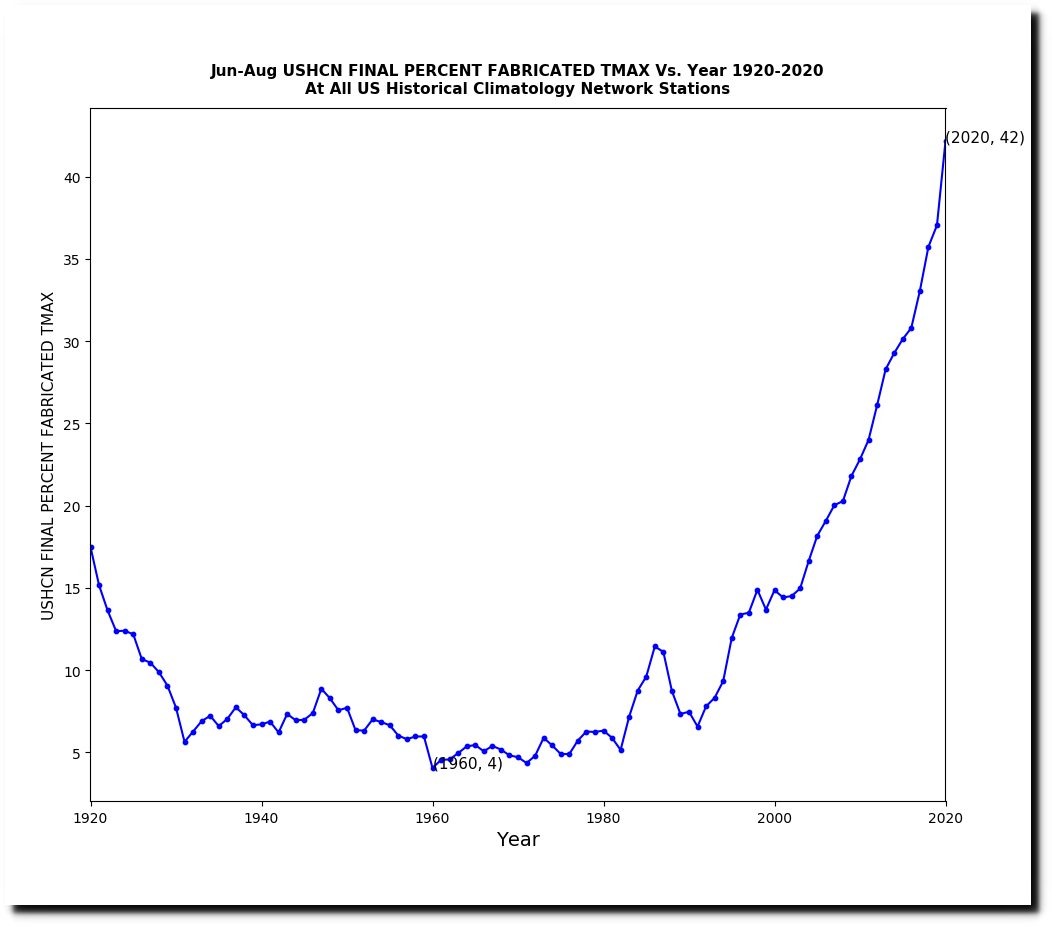
The fabricated data has three degrees of warming, and that accounts for the entire warming trend.

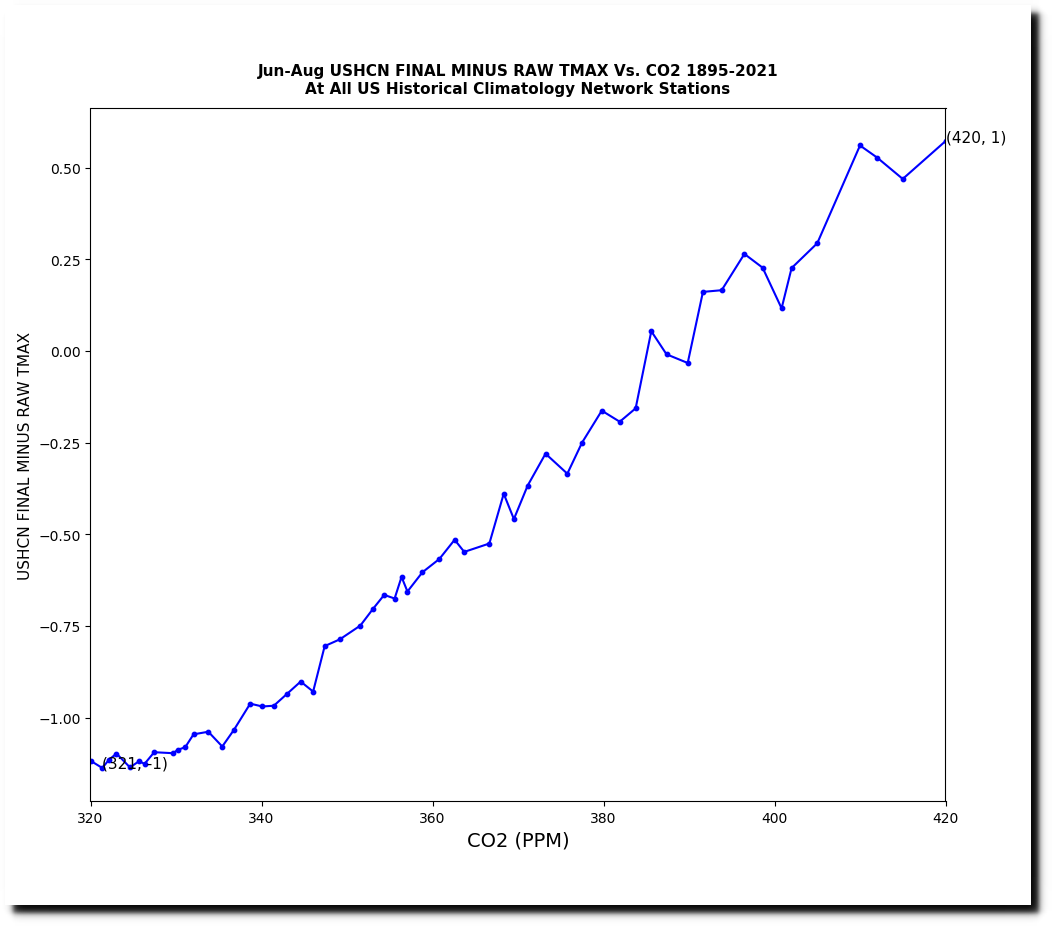
NOAA US temperature graphs are completely fraudulent, and they are being adjusted upwards to track CO2.
Posted in Uncategorized
Leave a comment
The World’s Second Largest Ponzi Scheme
“Critically, the study found that vaccinated individuals carried as much virus in their noses as unvaccinated individuals, and that vaccinated people could spread the virus to each other.”

Posted in Uncategorized
Leave a comment
The NOAA Climate Extremes Index
According to NOAA, the area of the US experiencing extreme maximum summer temperatures has greatly increased over the past fifty years.
“The sum of (a) percentage of the United States with maximum temperatures much below normal and (b) percentage of the United States with maximum temperatures much above normal.”
U.S. Climate Extremes Index (CEI) | Extremes | National Centers for Environmental Information (NCEI)
According to NOAA, the past decade has been the hottest on record.
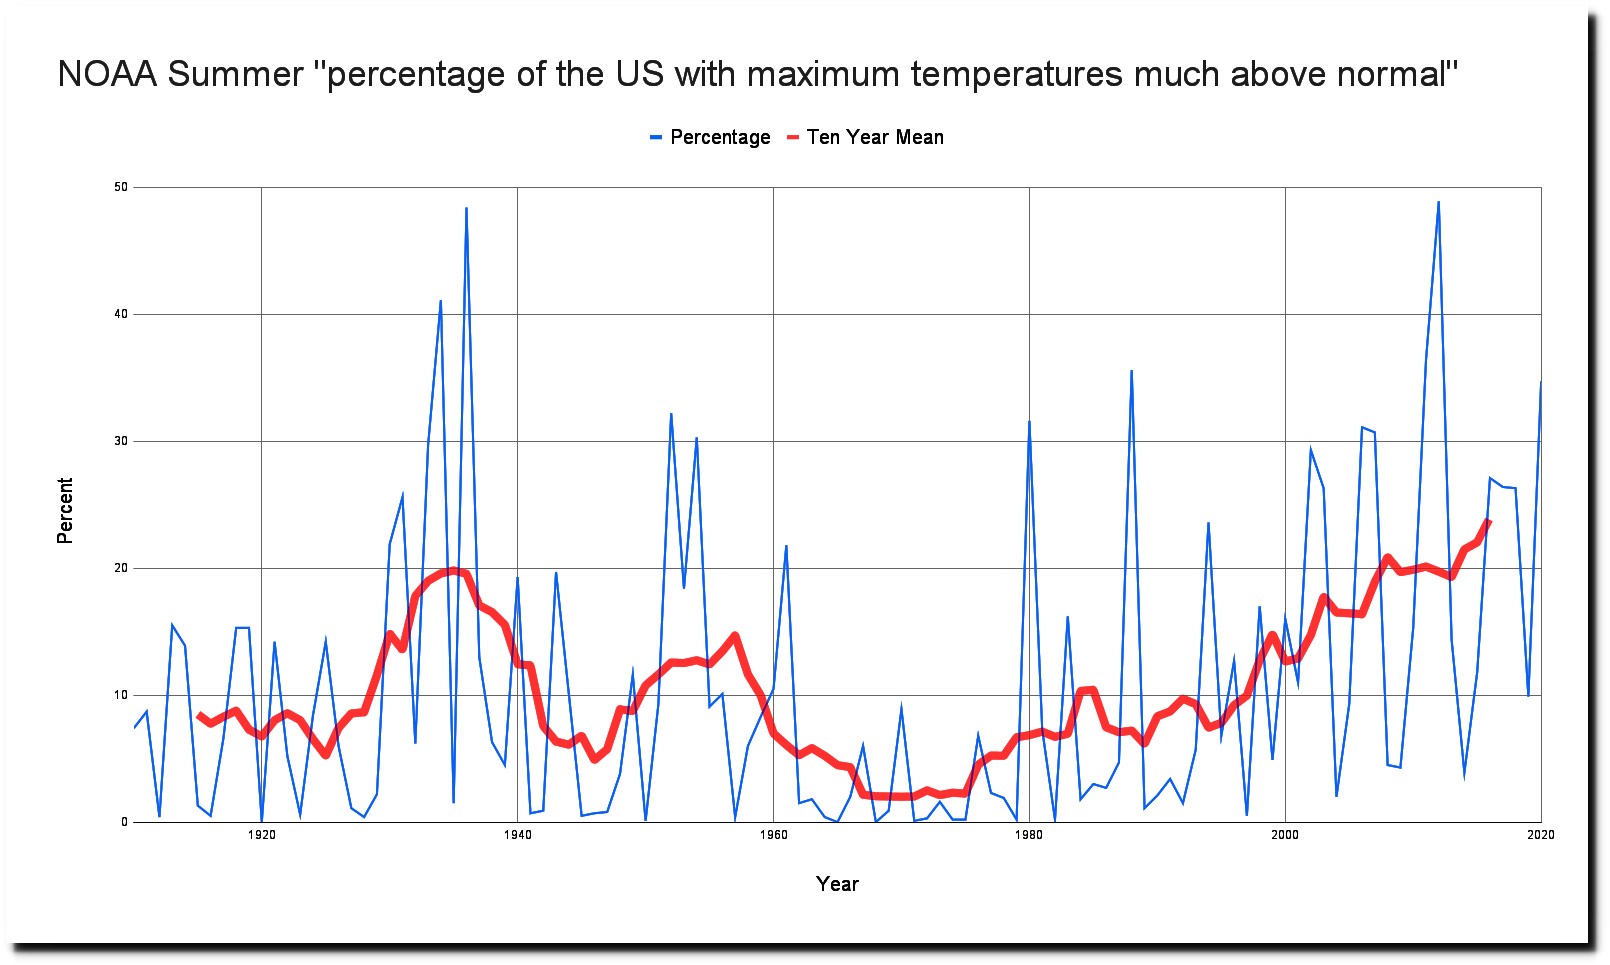
Their own data shows the exact opposite.

The National Climate Assessment also shows the exact opposite.
Temperature Changes in the United States – Climate Science Special Report
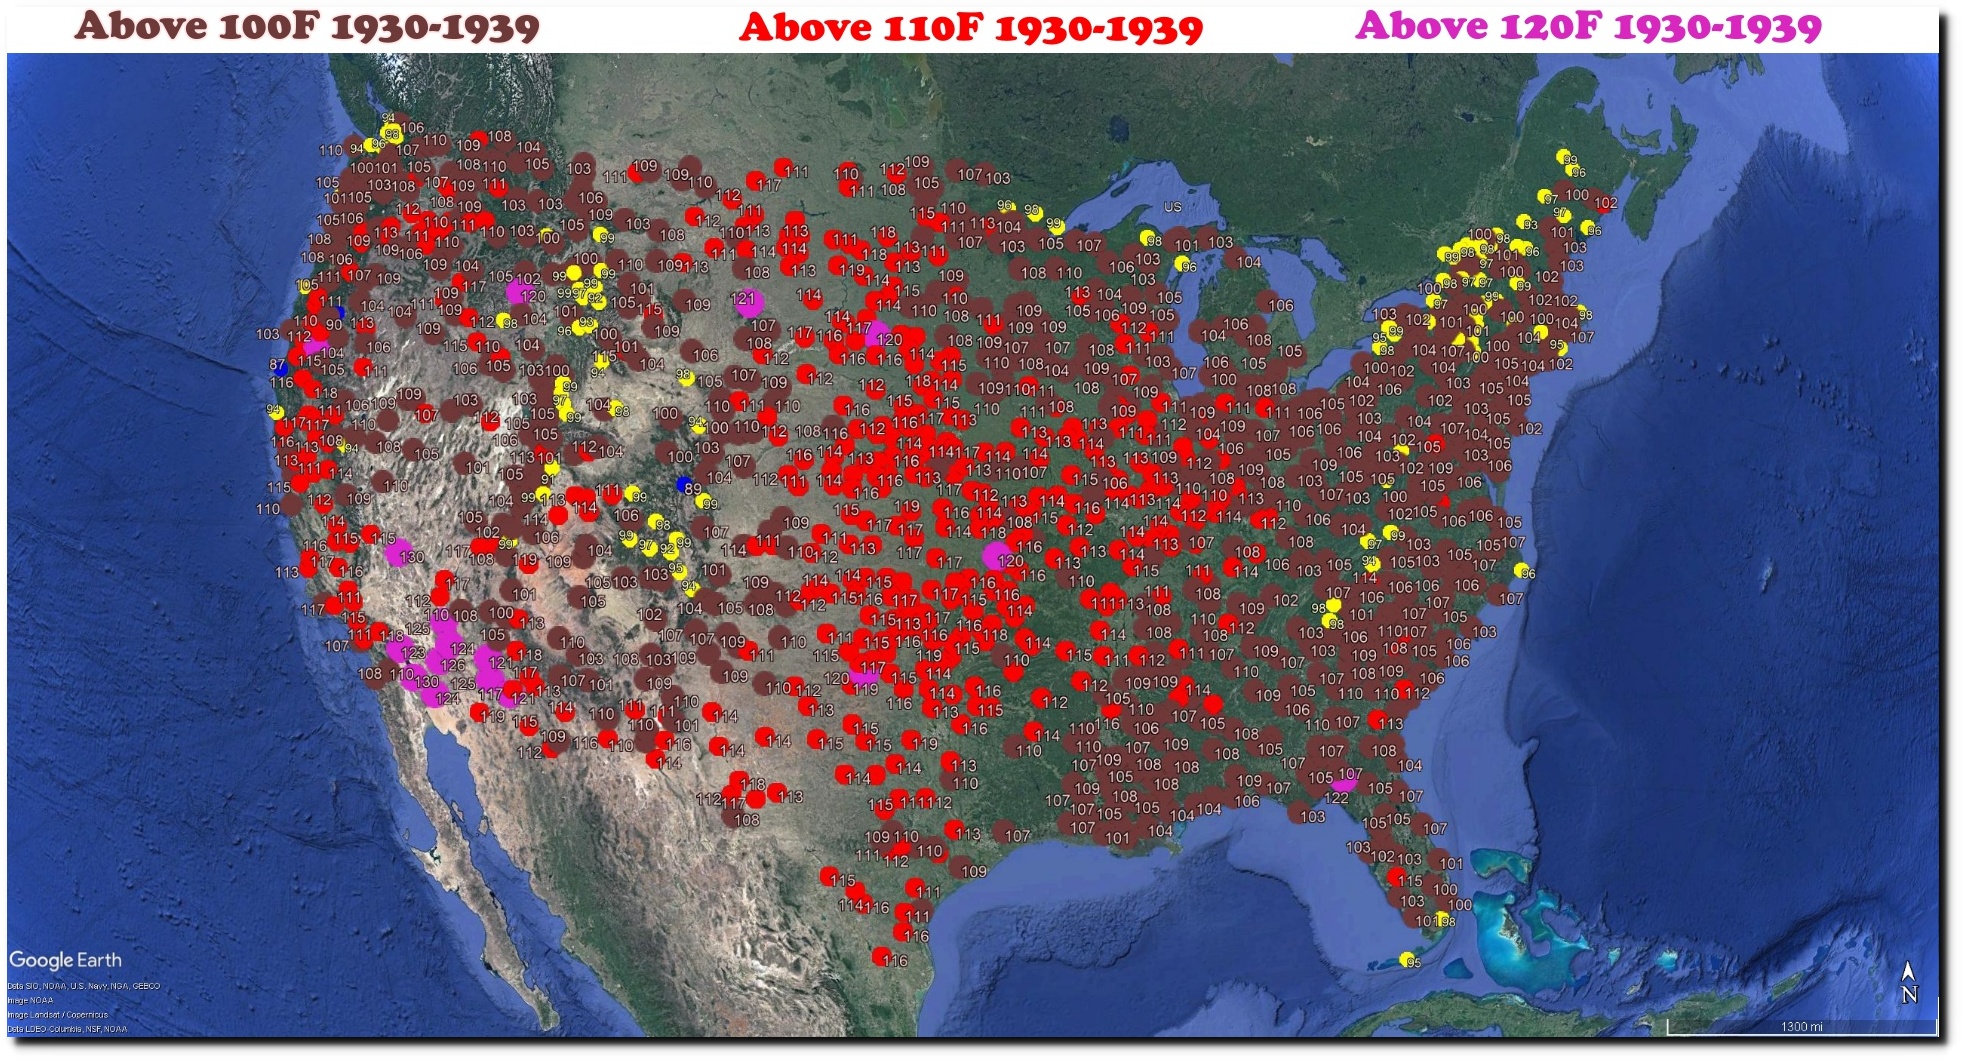
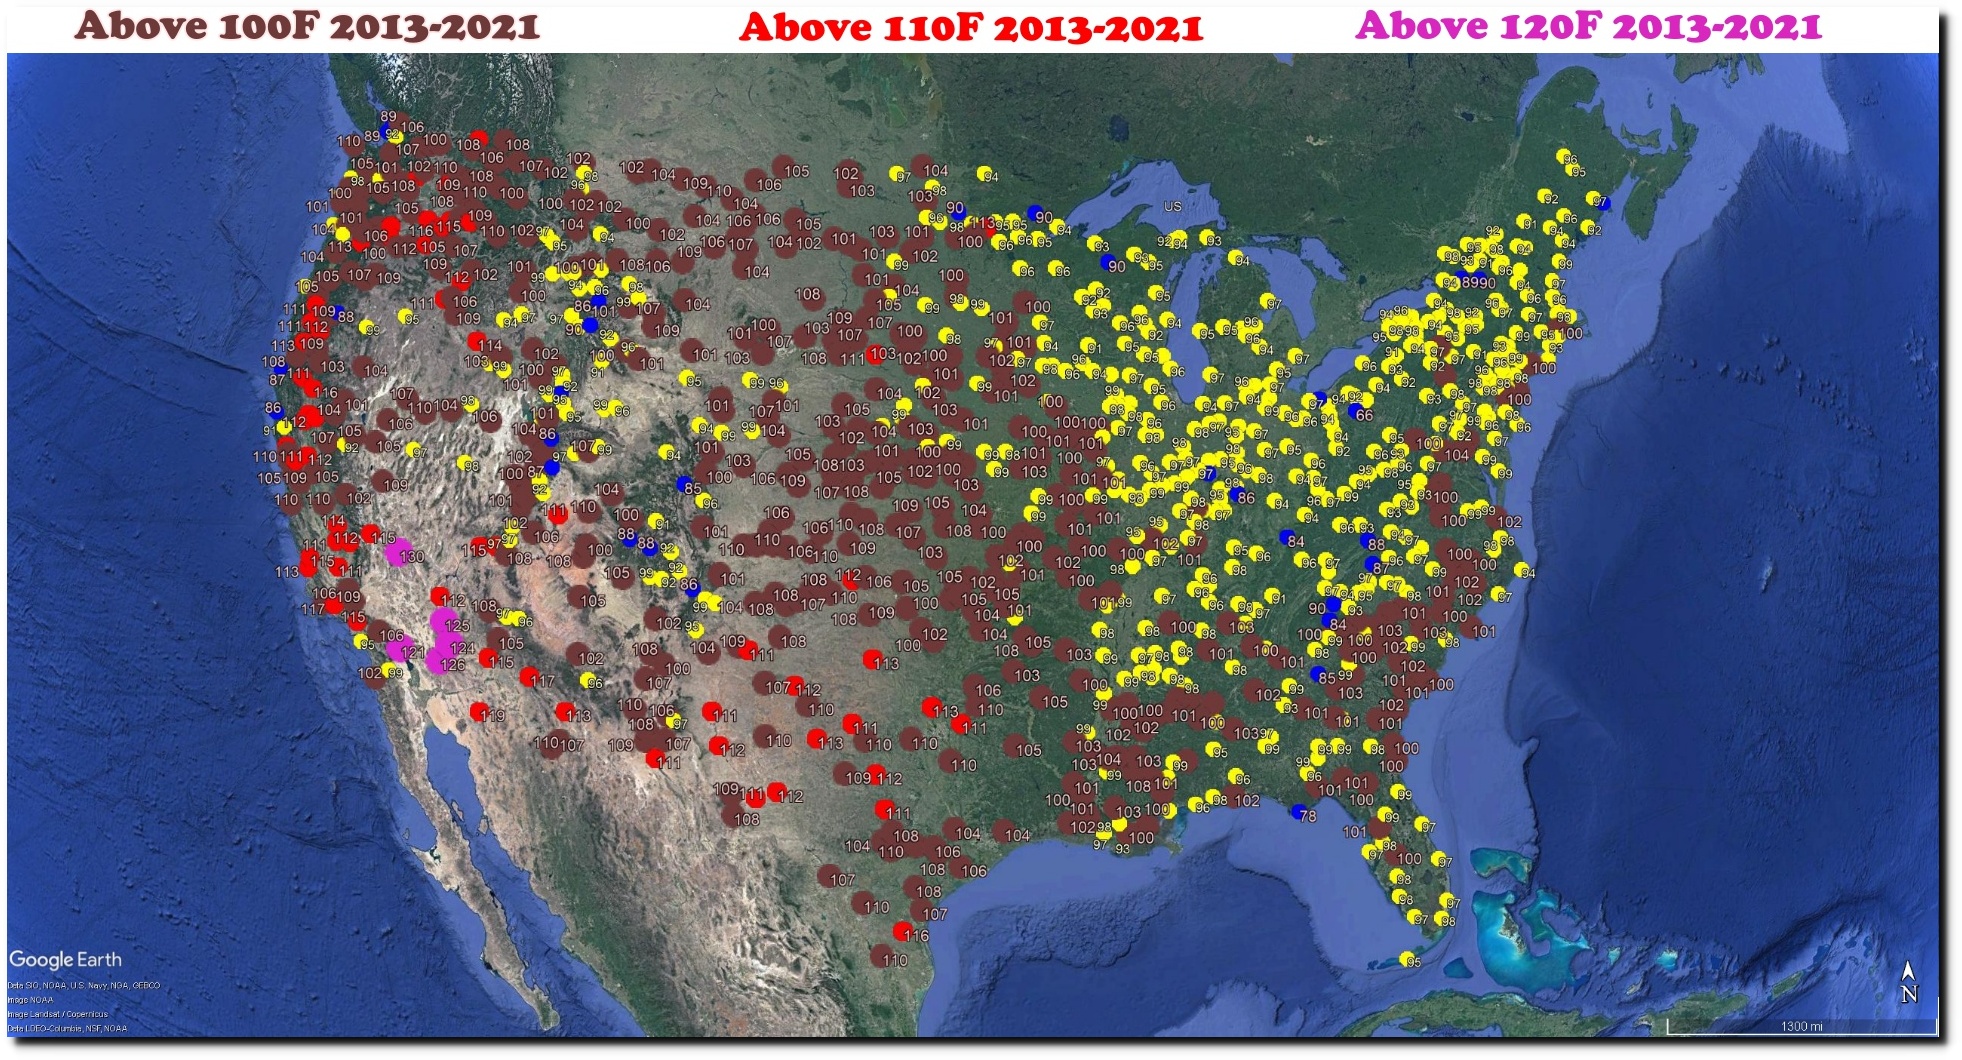
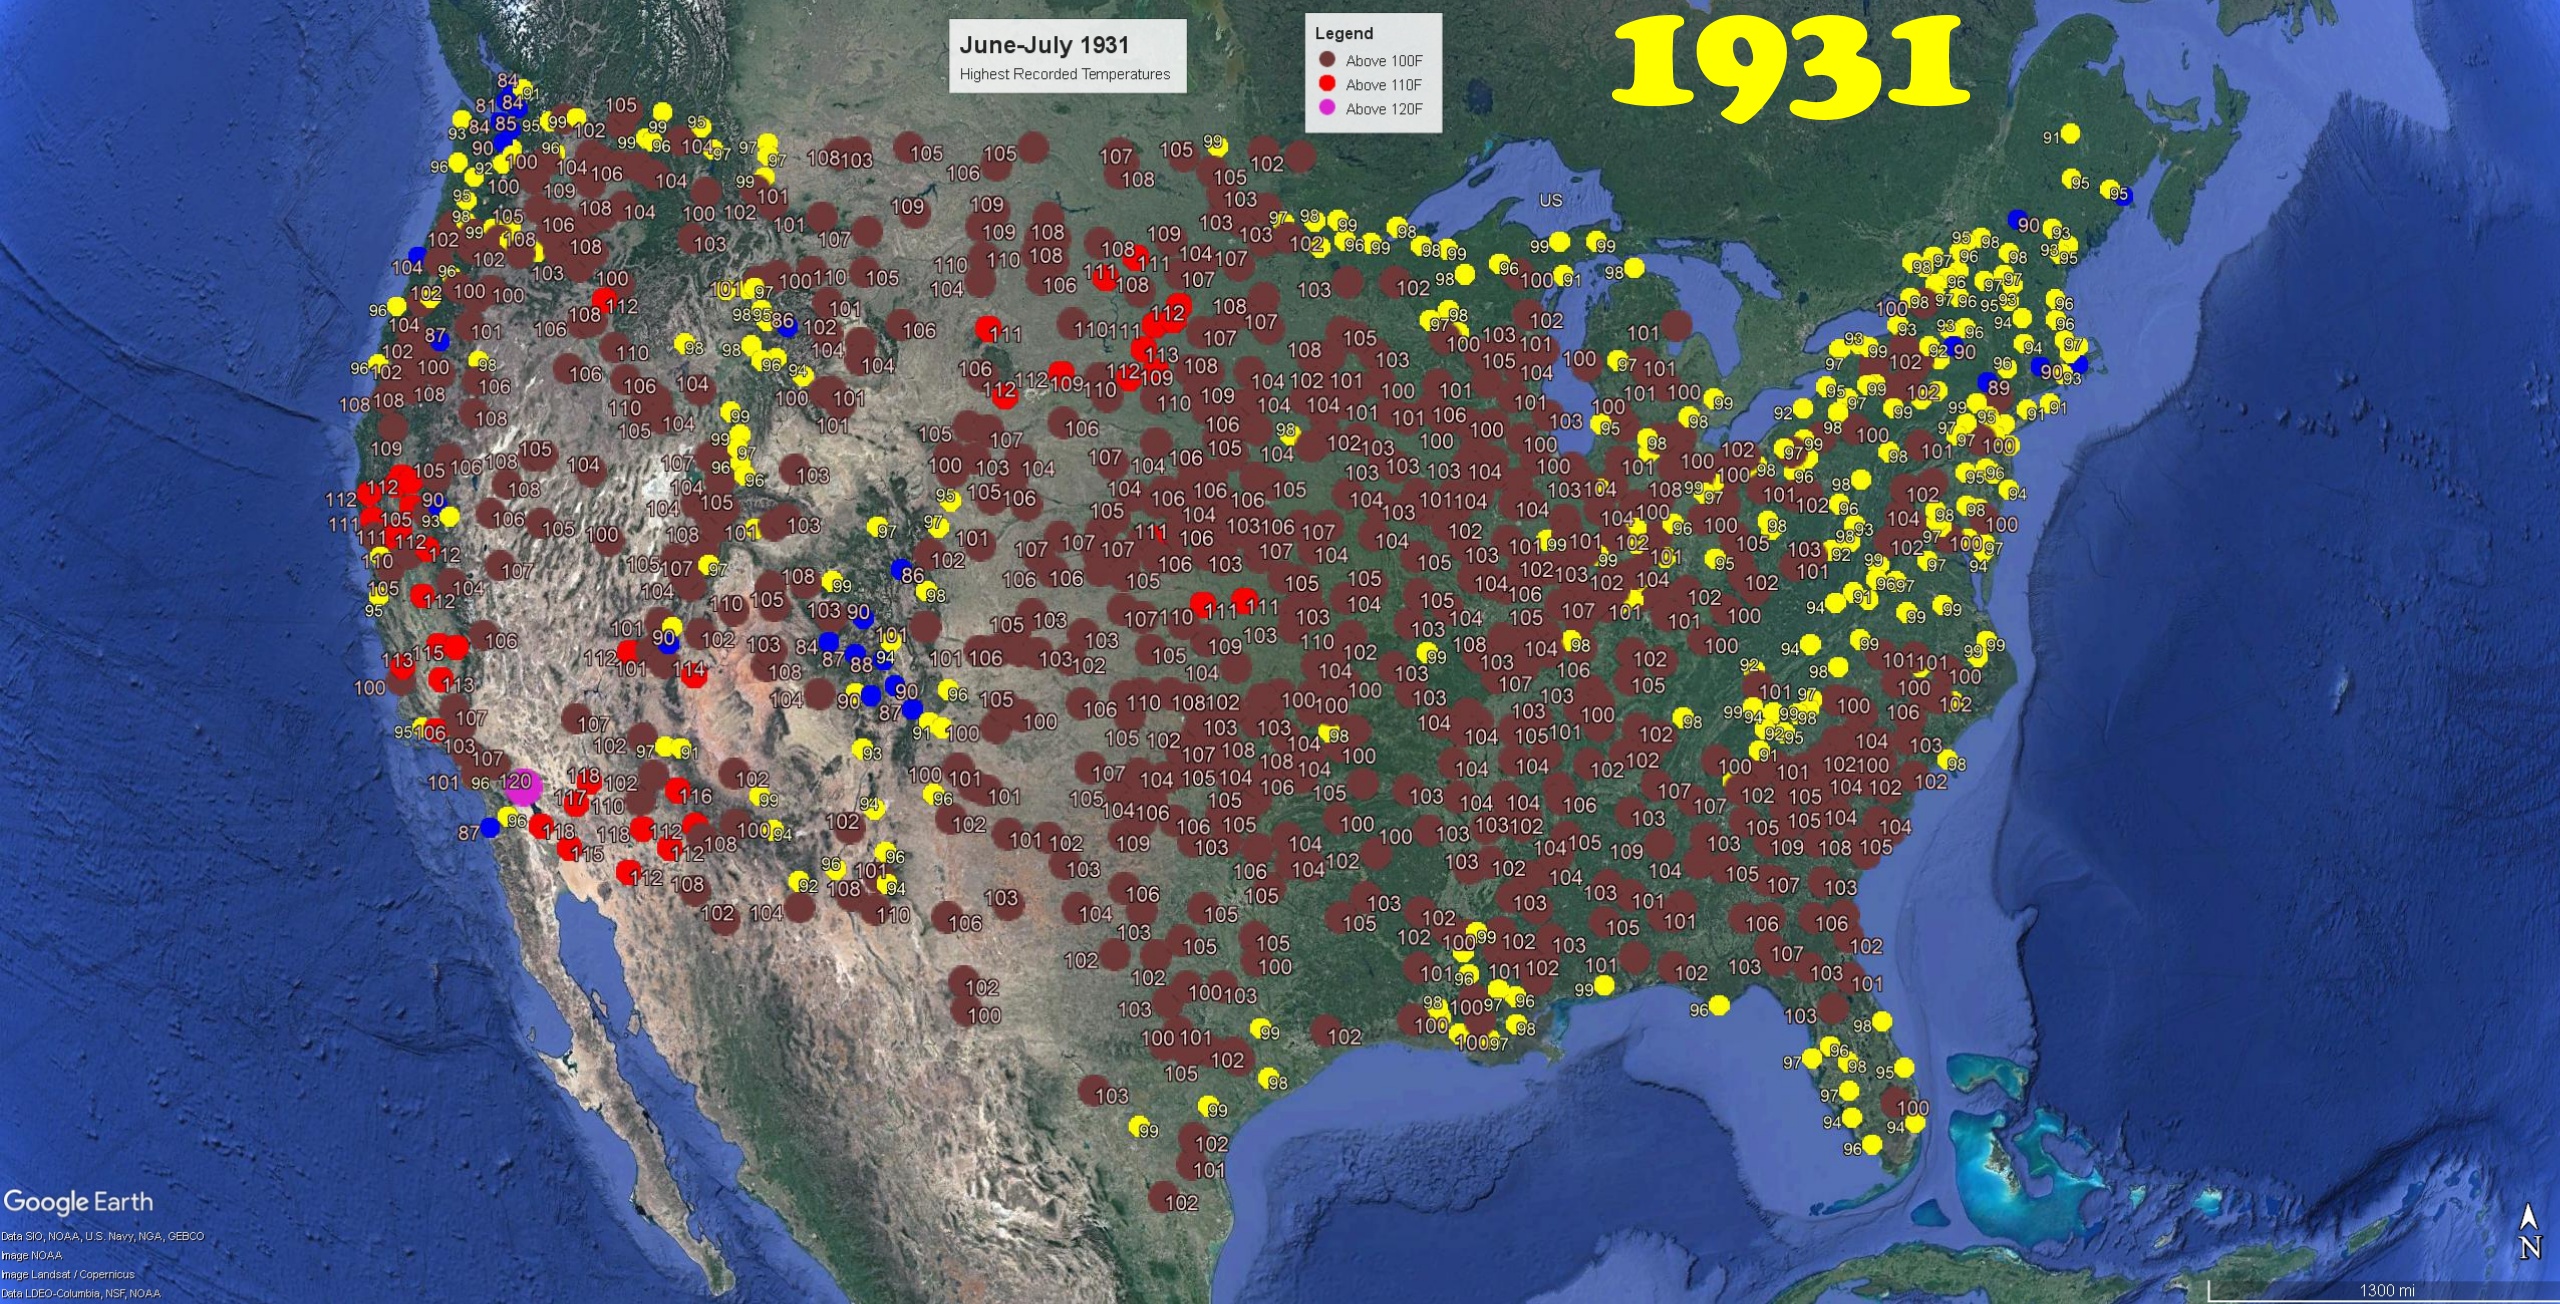
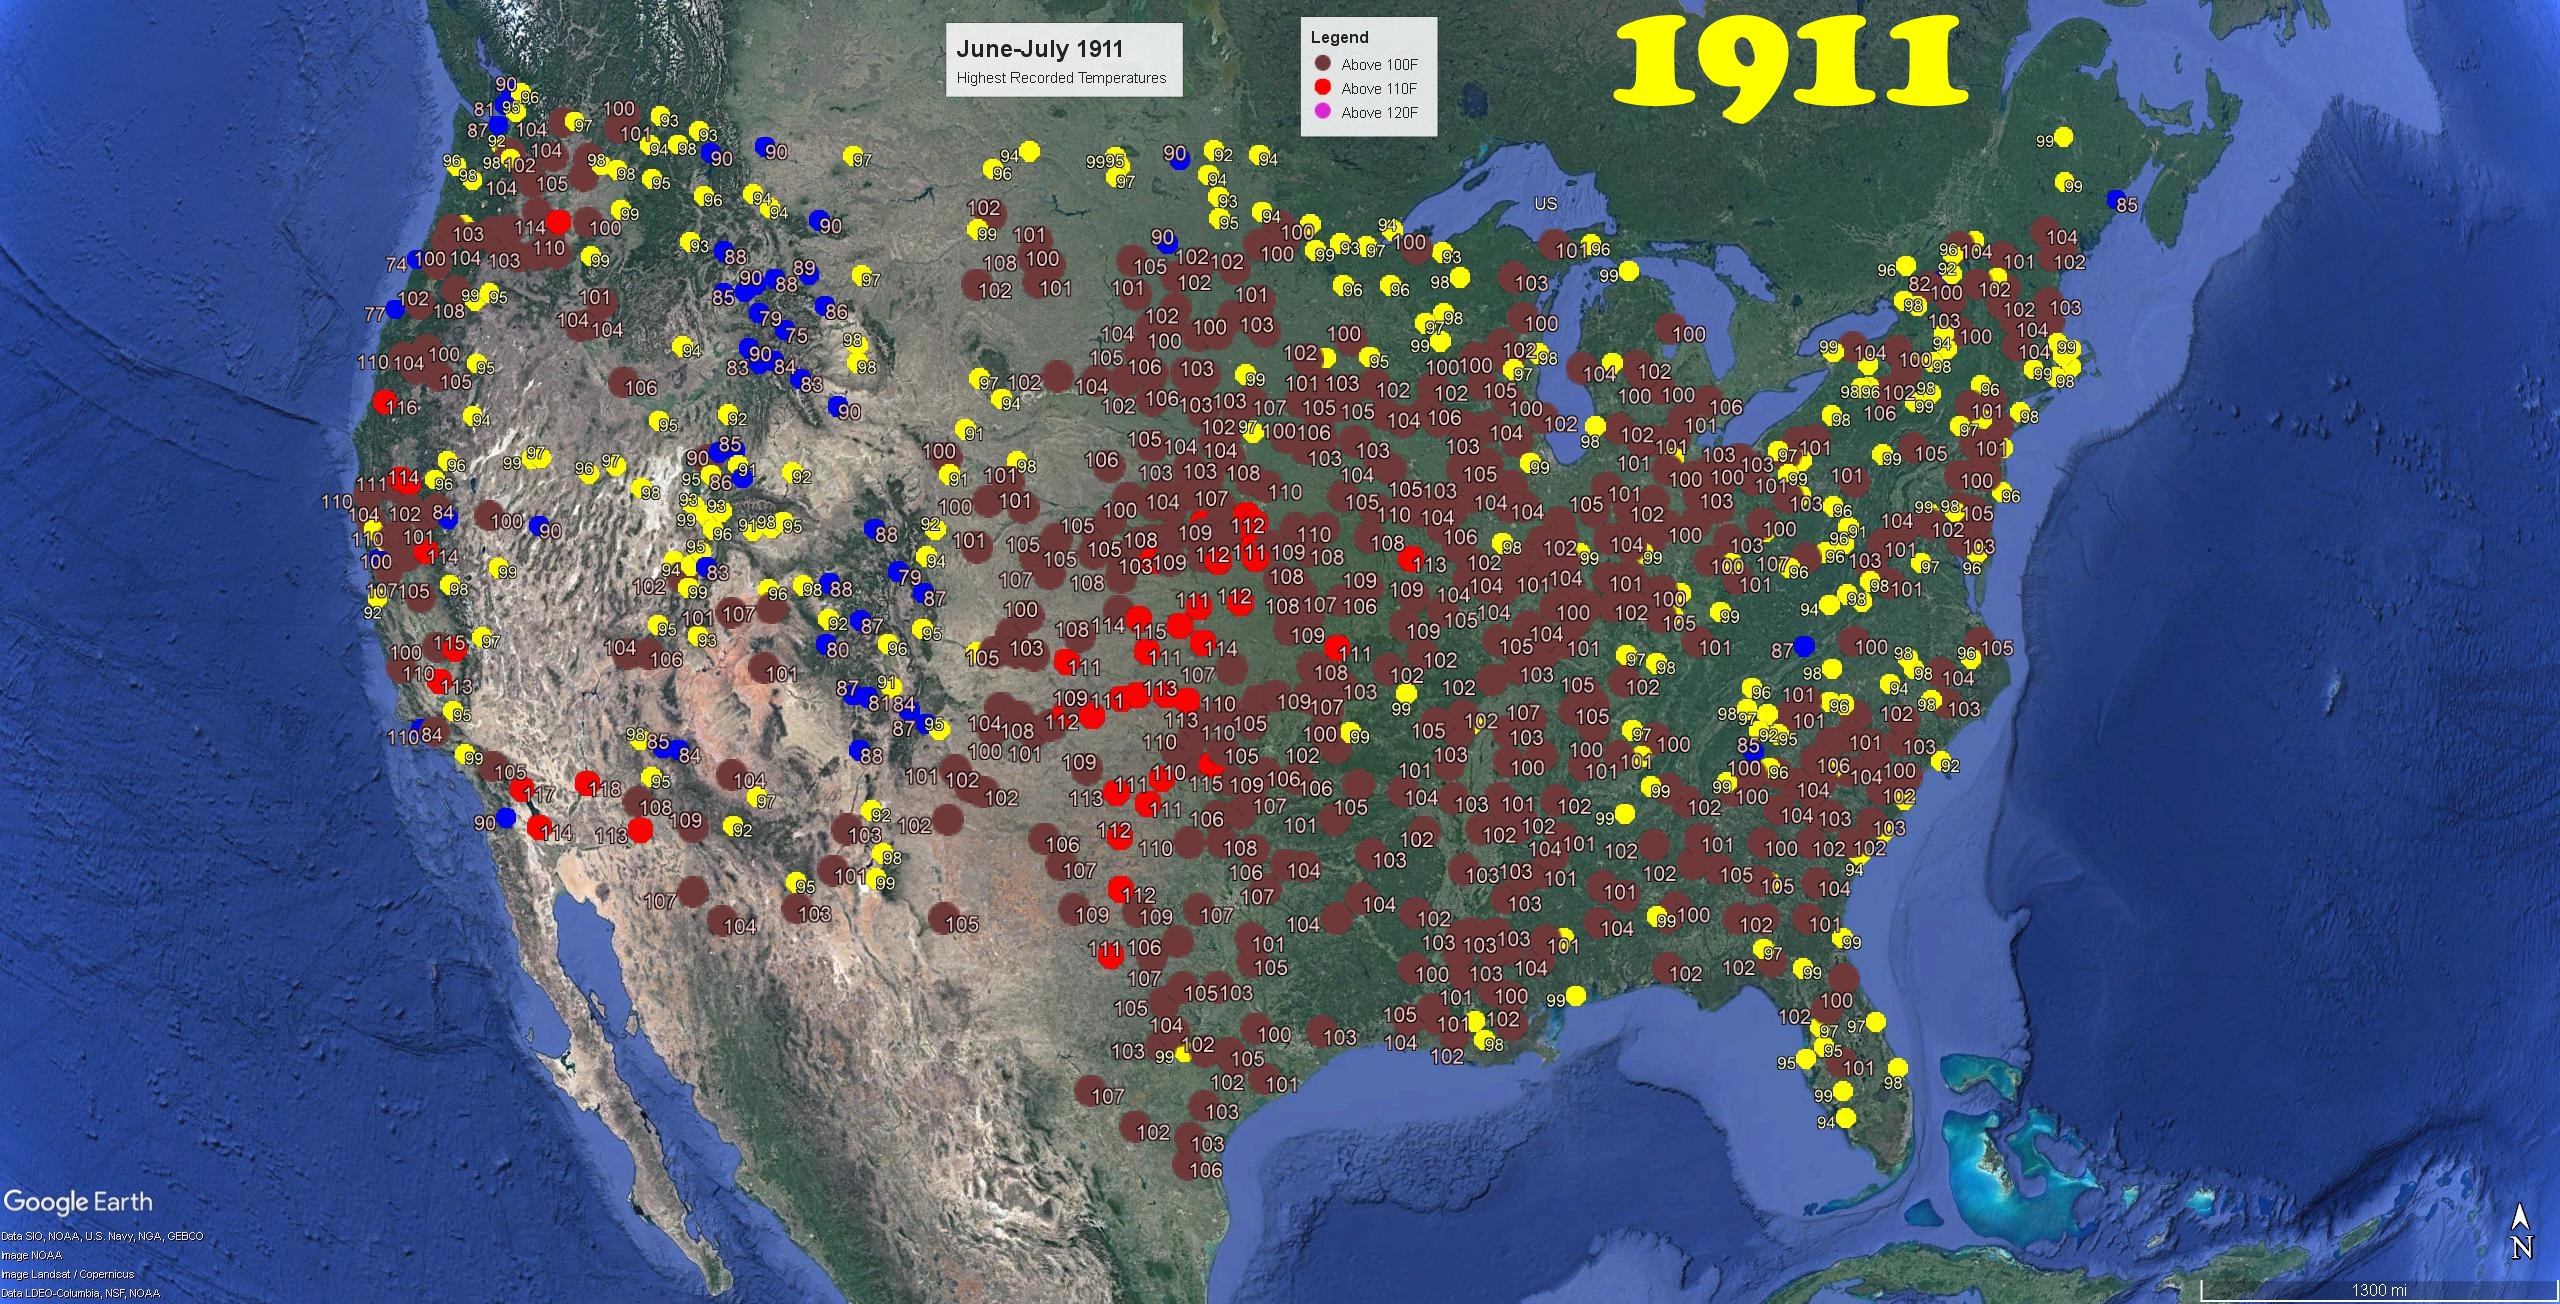
The 1930s were much hotter than recent years. There is no comparison.

Posted in Uncategorized
Leave a comment
“Speaking Truth To Power”
The vaccine marketing team is well paid.

Posted in Uncategorized
Leave a comment
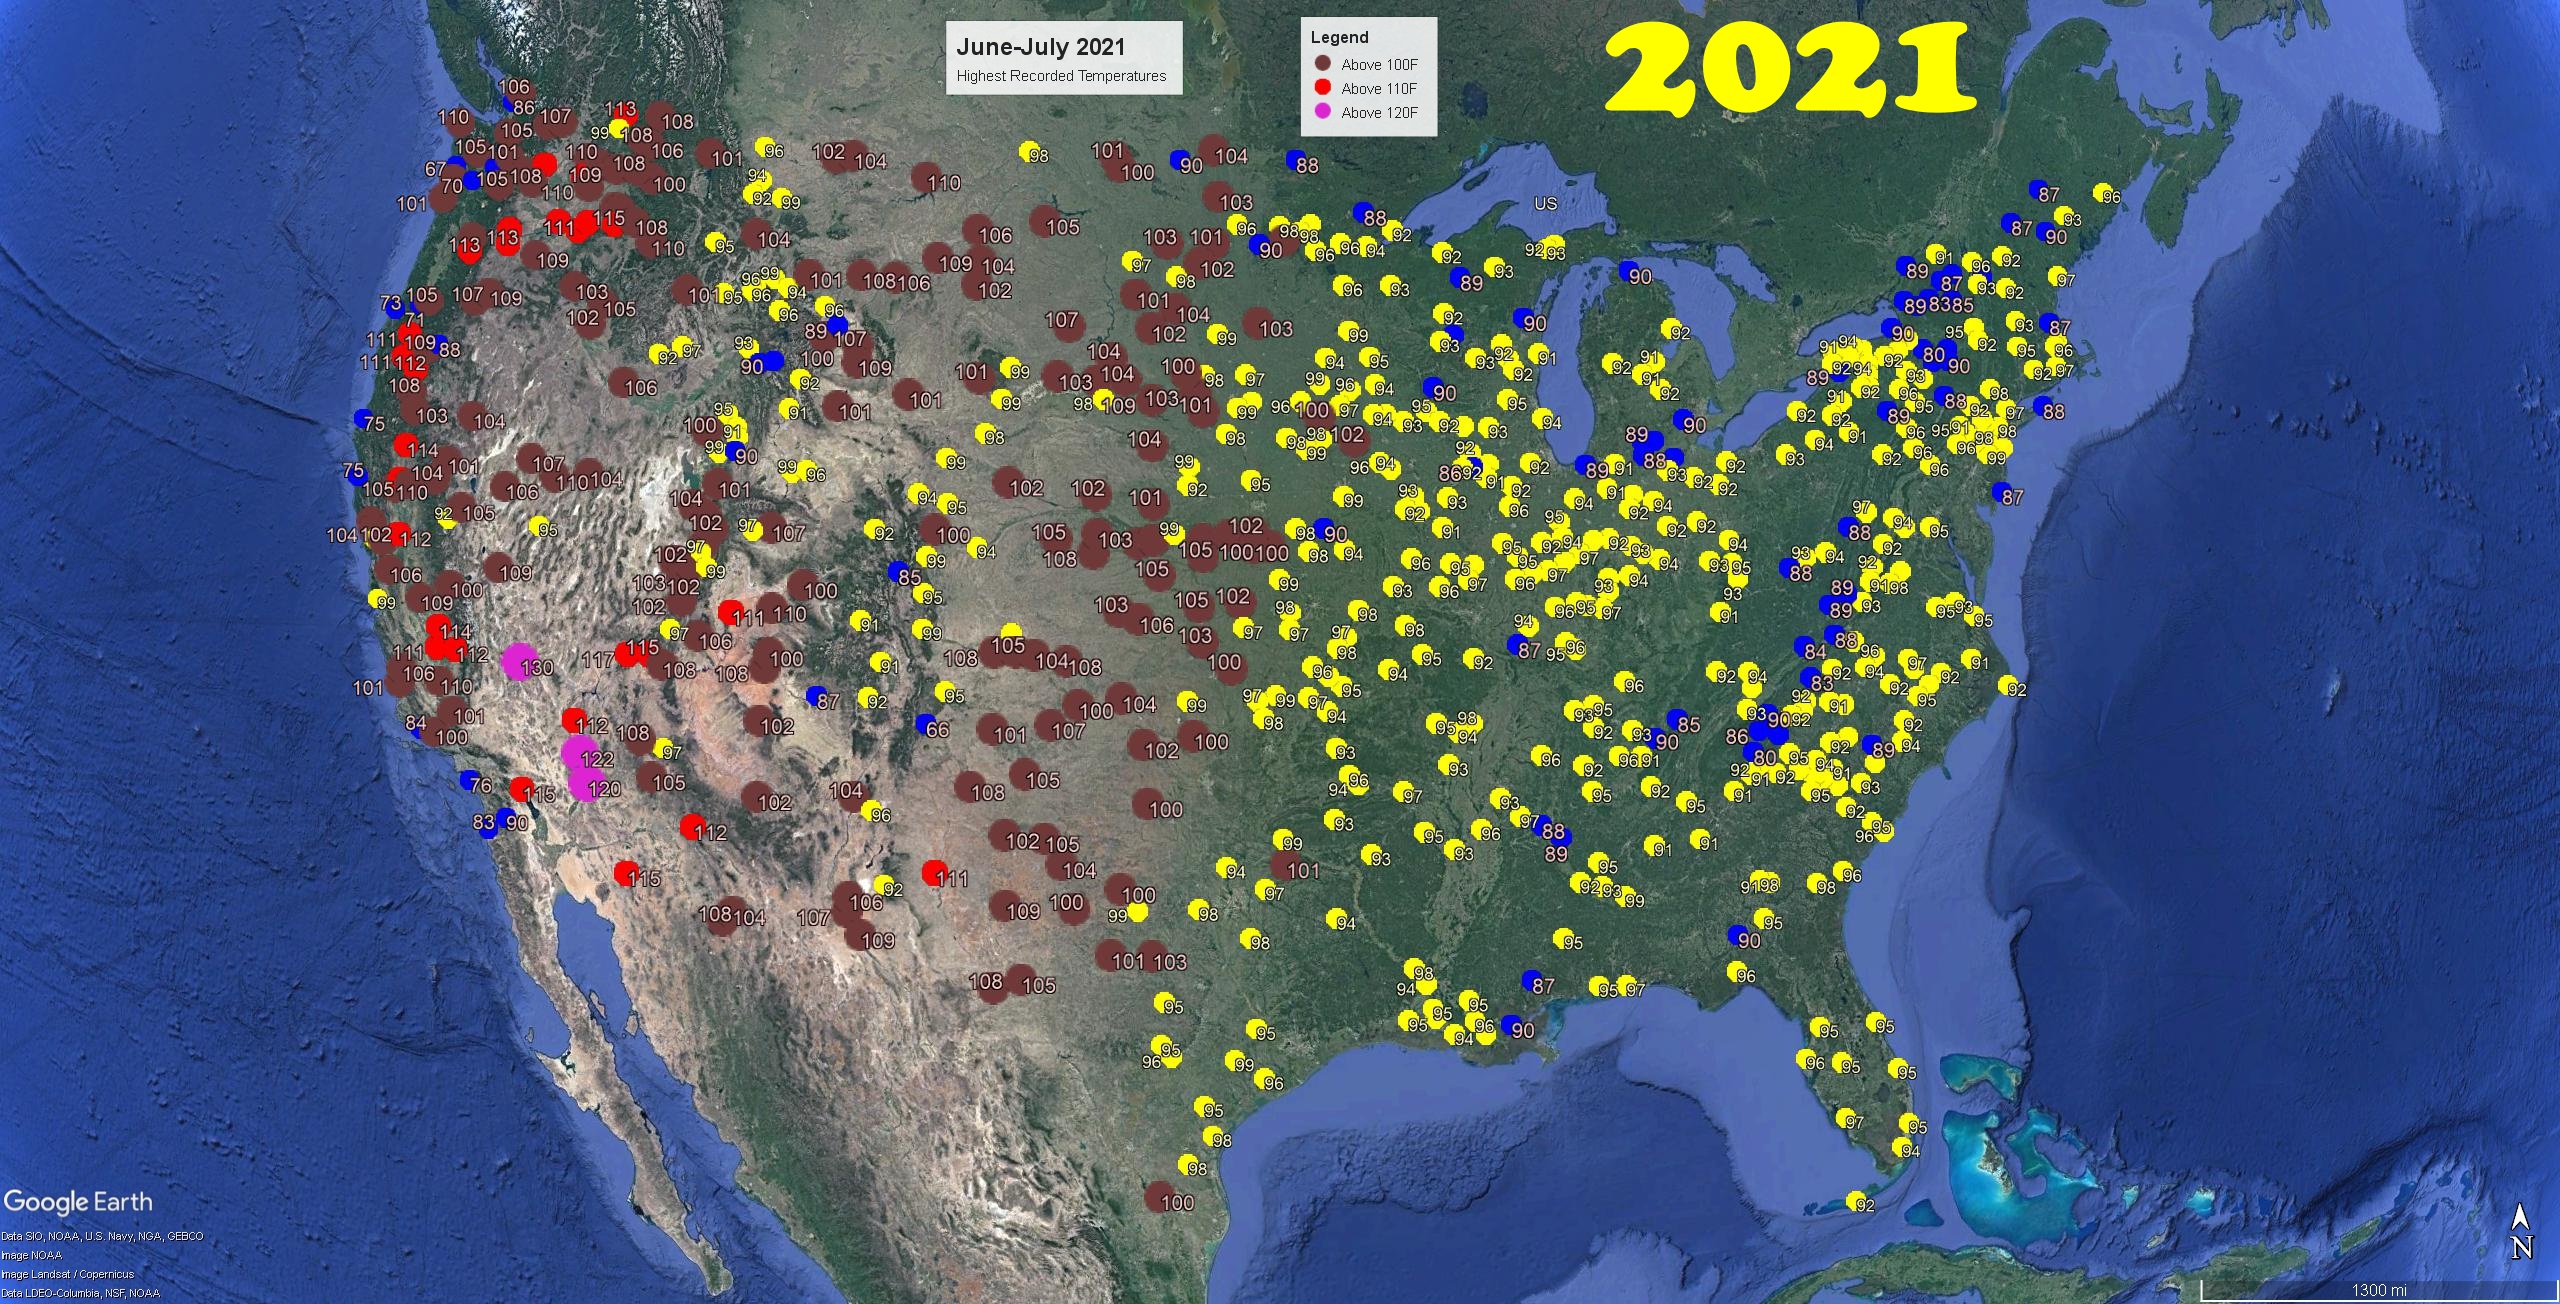
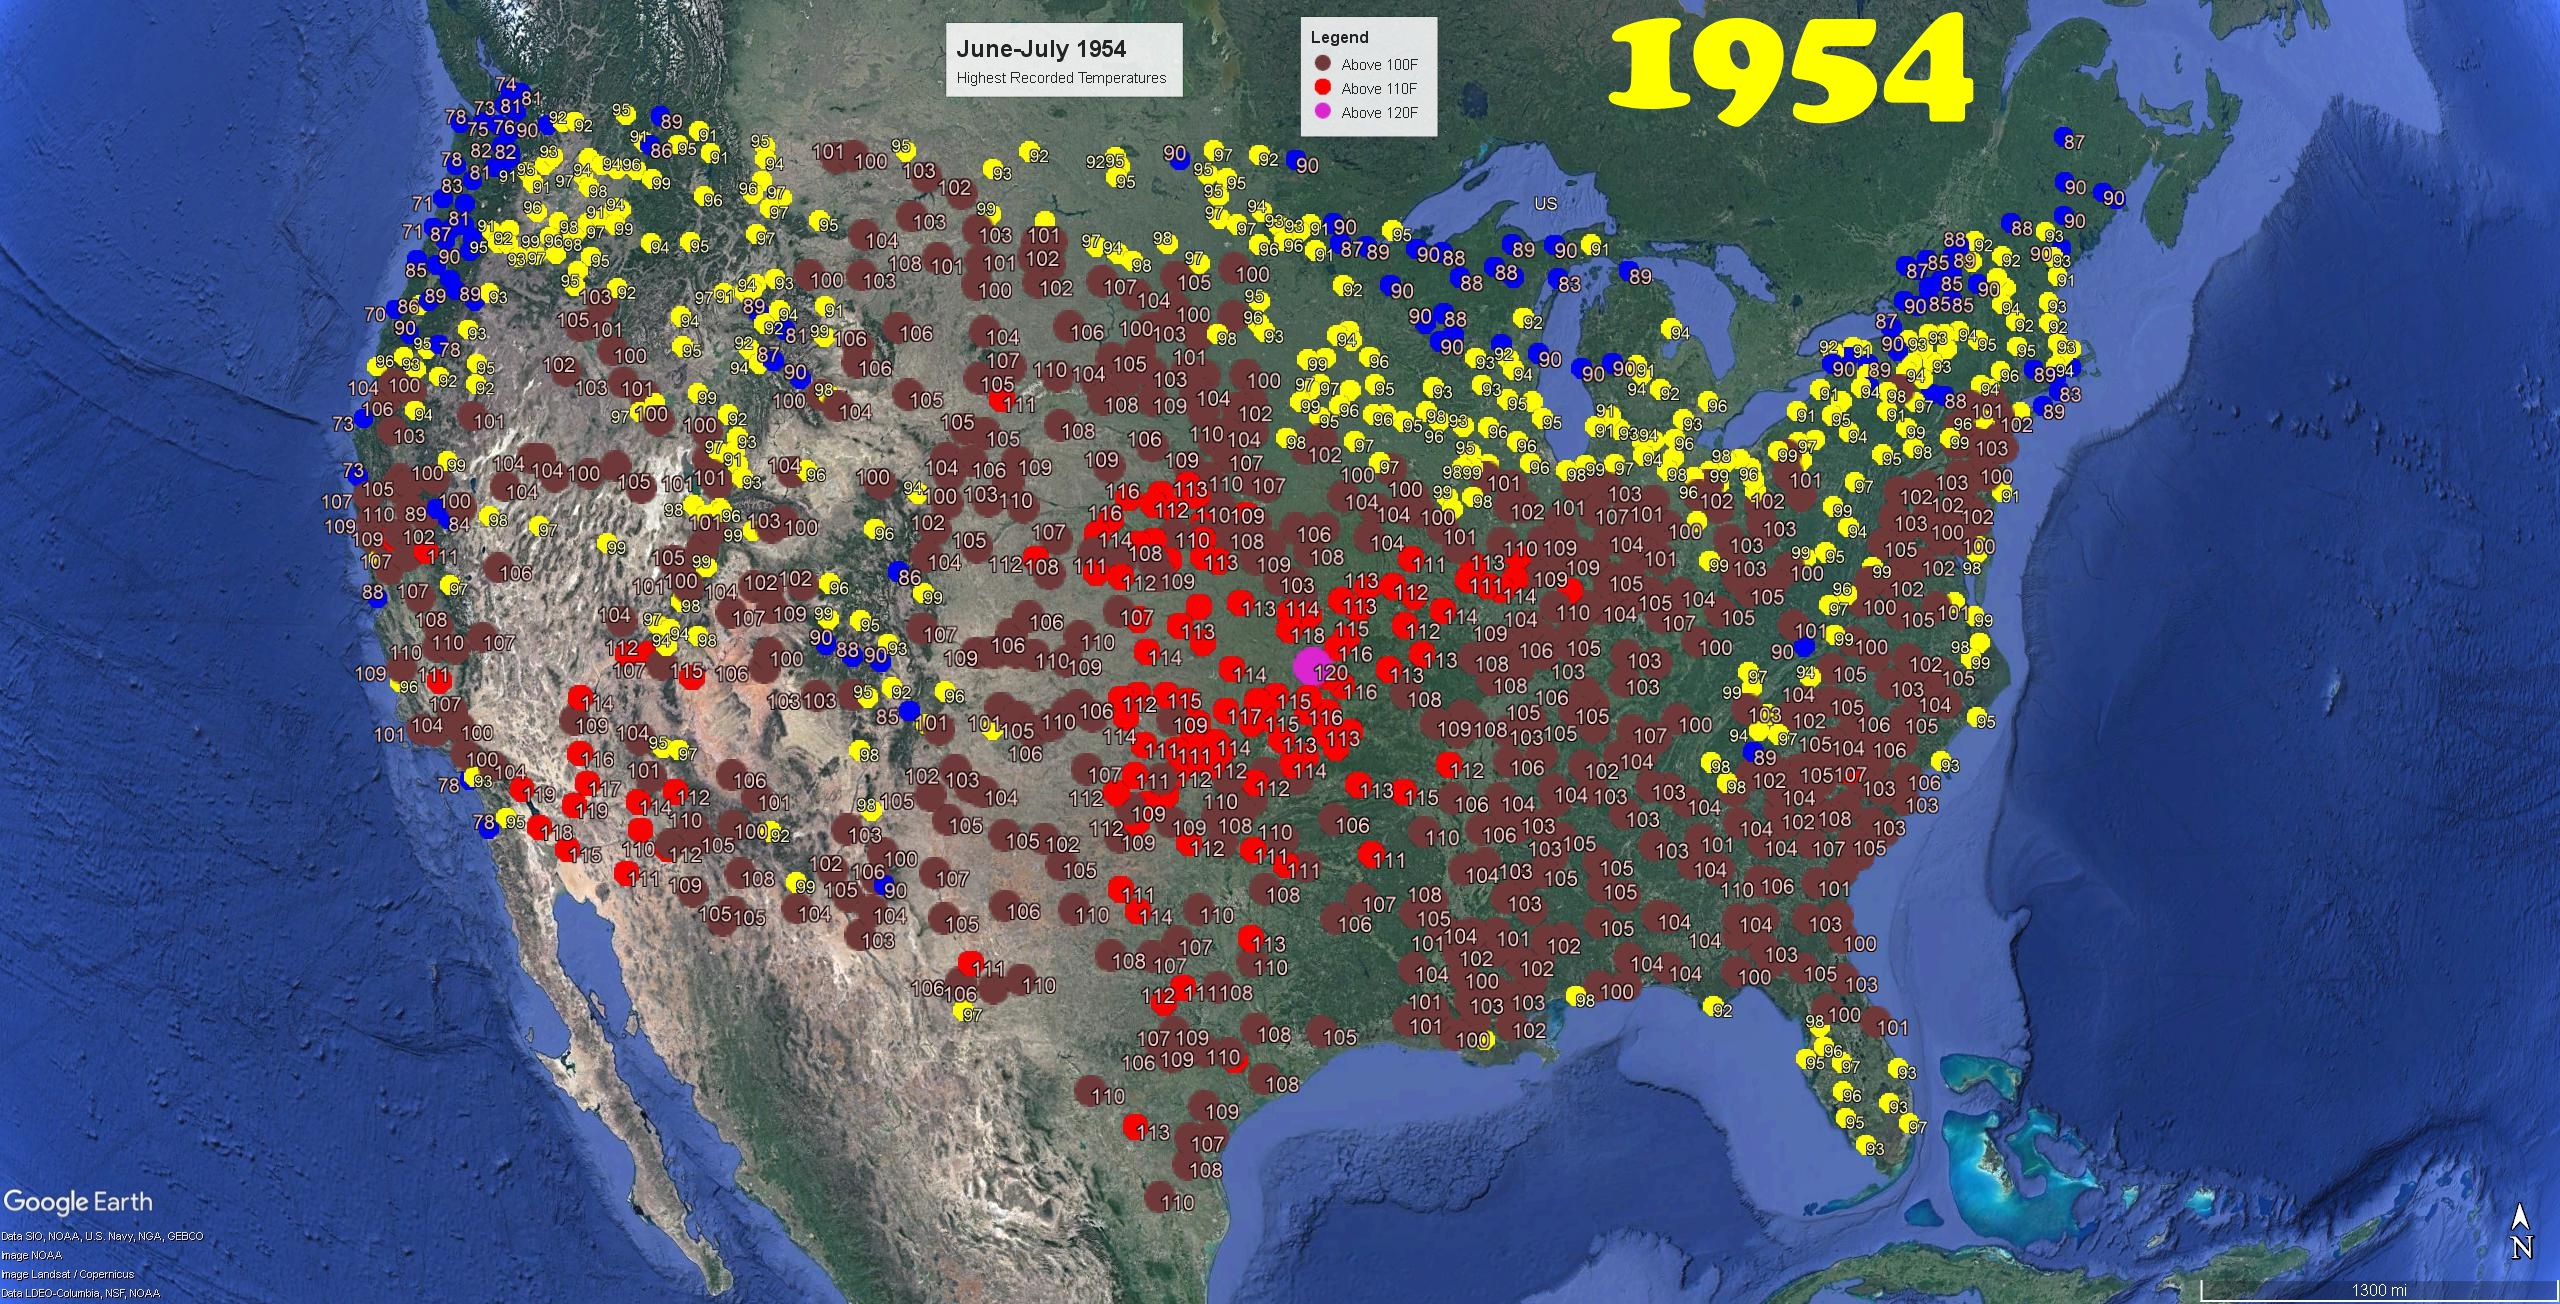
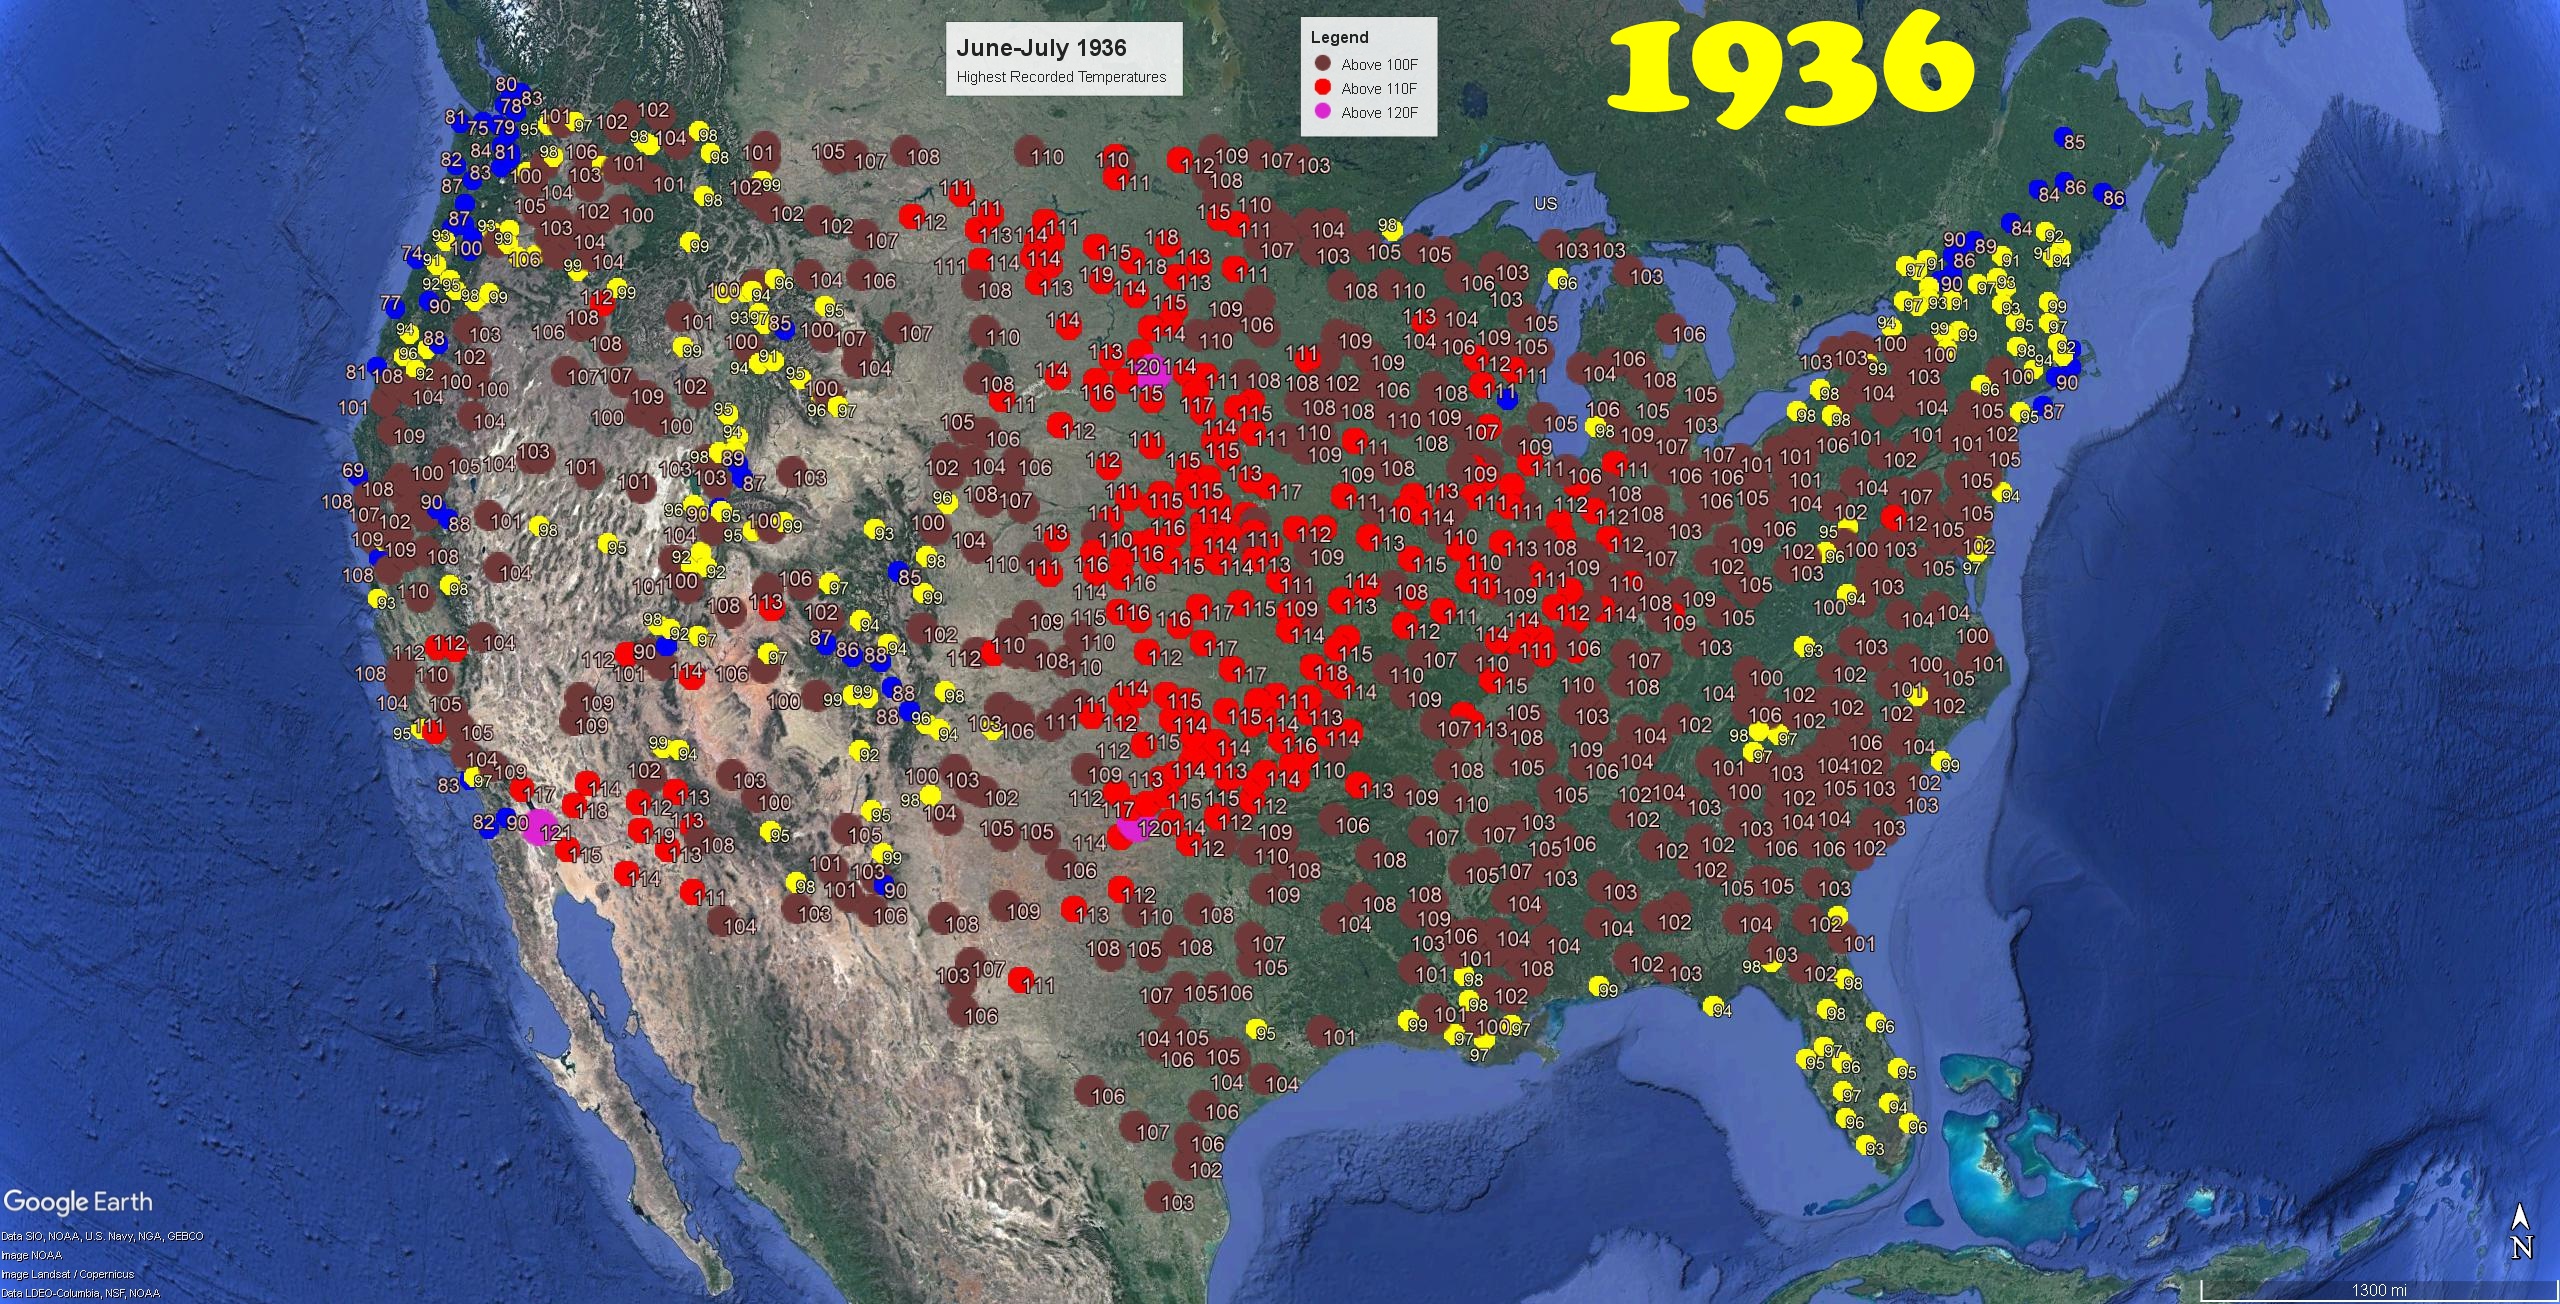
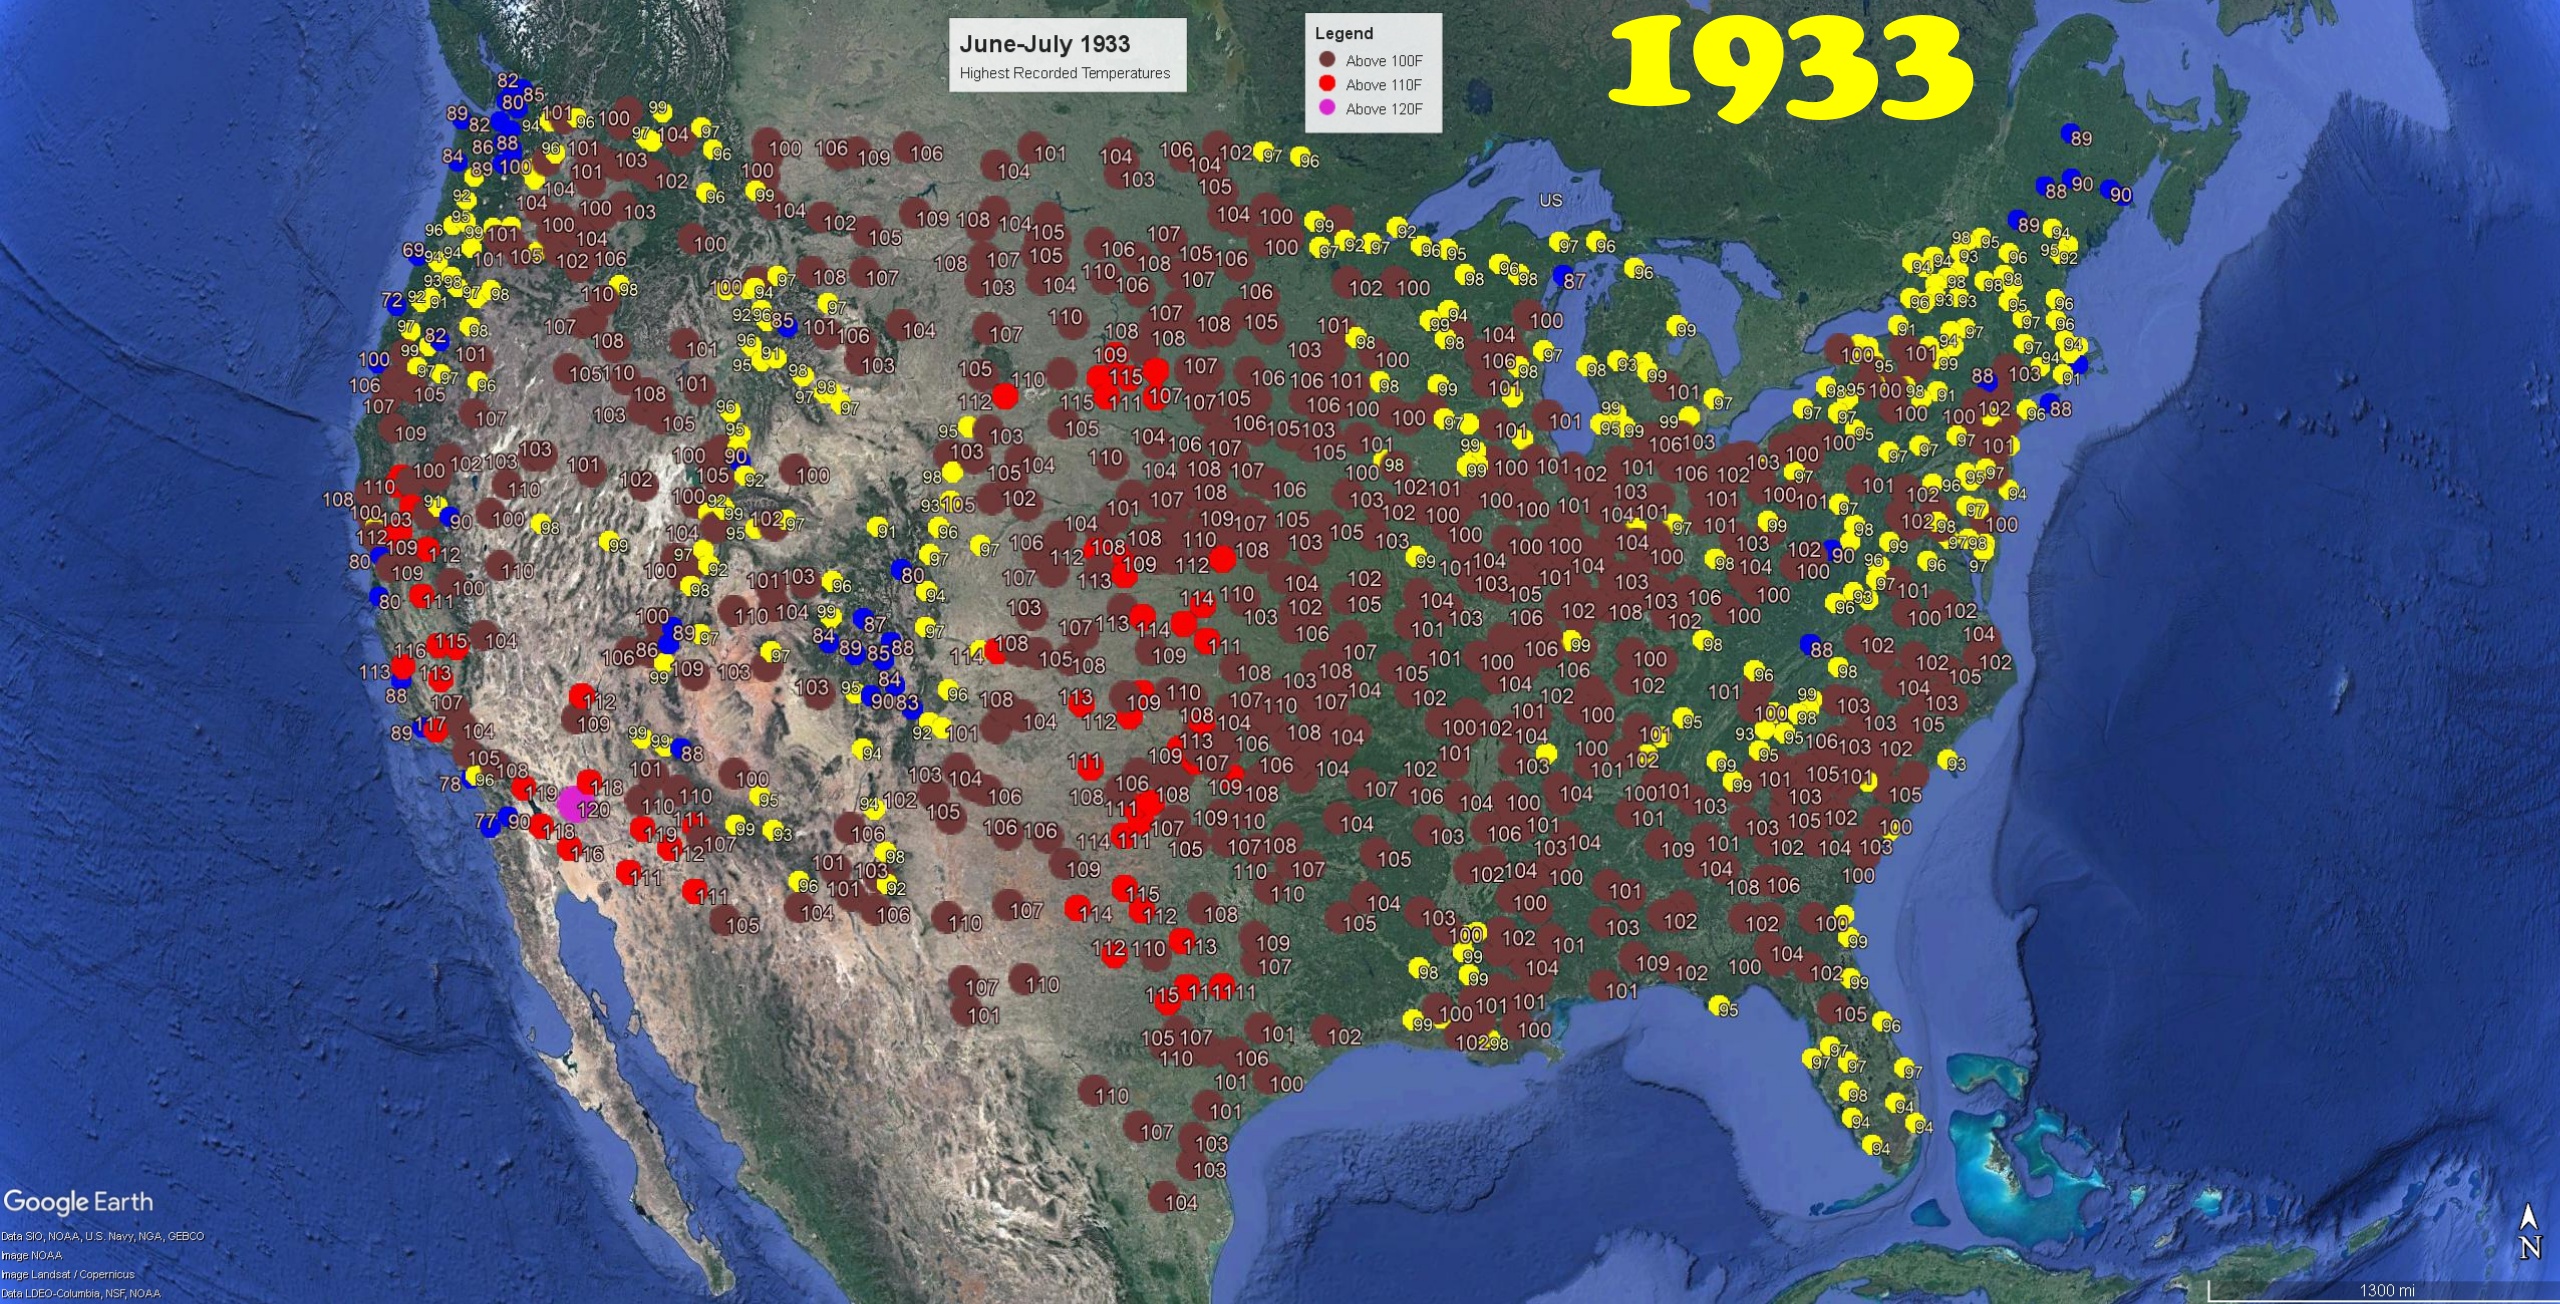
Record Heat Of 2021
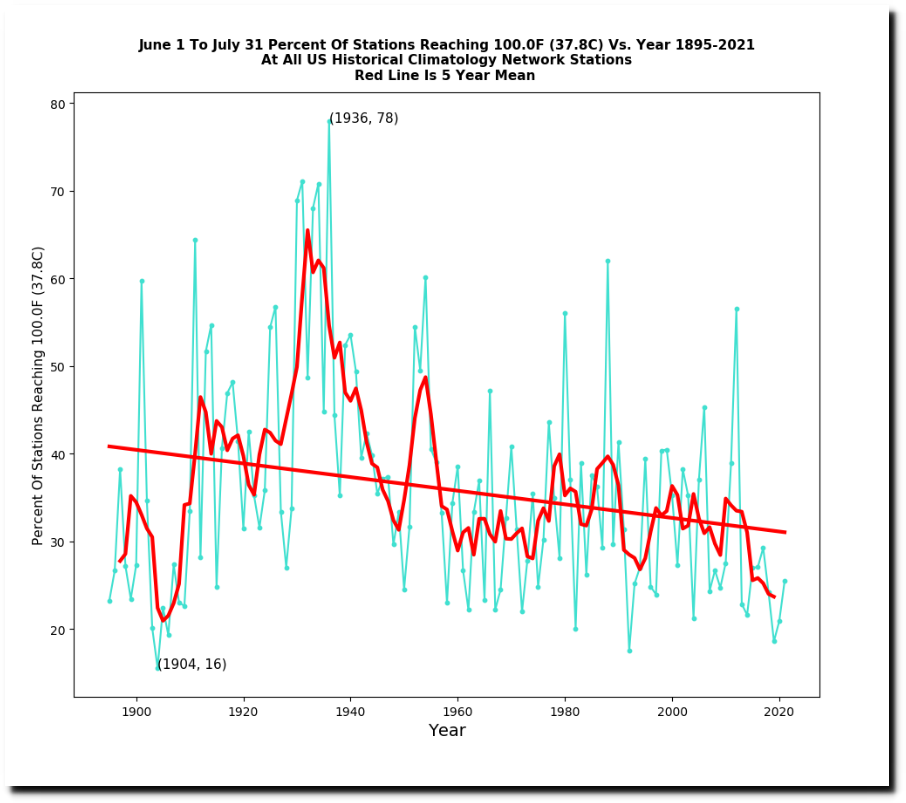
During 2021, 100 degree temperatures have been confined to the western half of the country. During many previous years 100 degree temperatures blanketed the country.



Posted in Uncategorized
Leave a comment