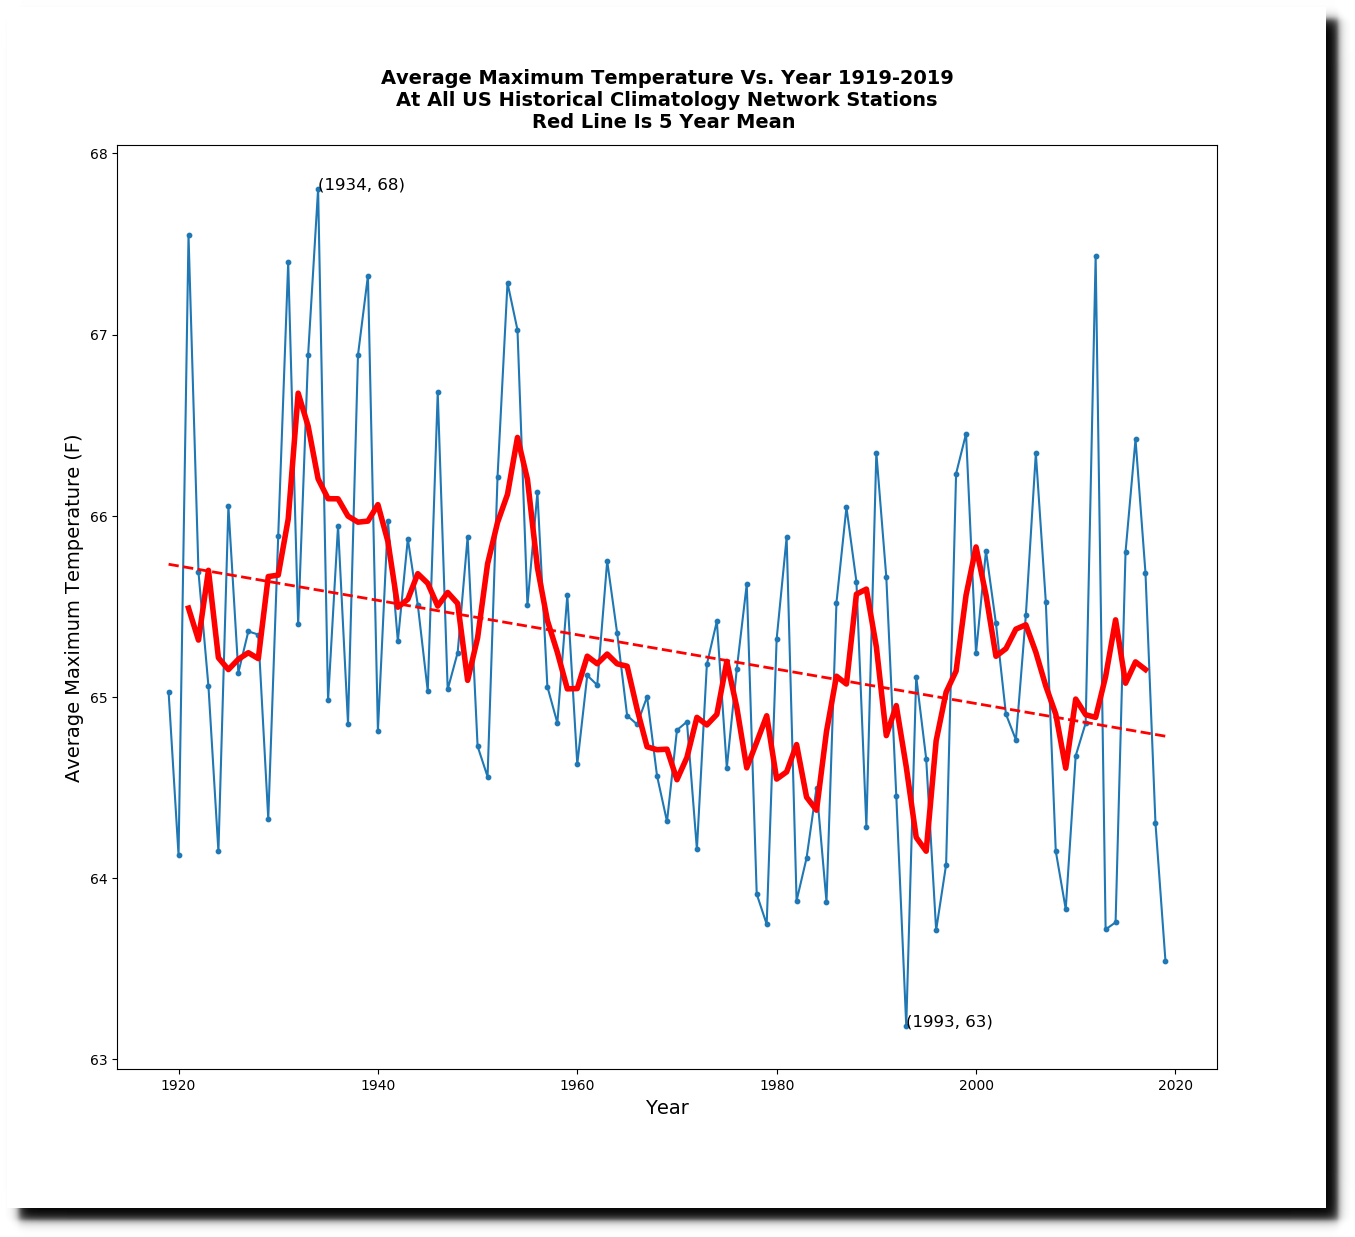
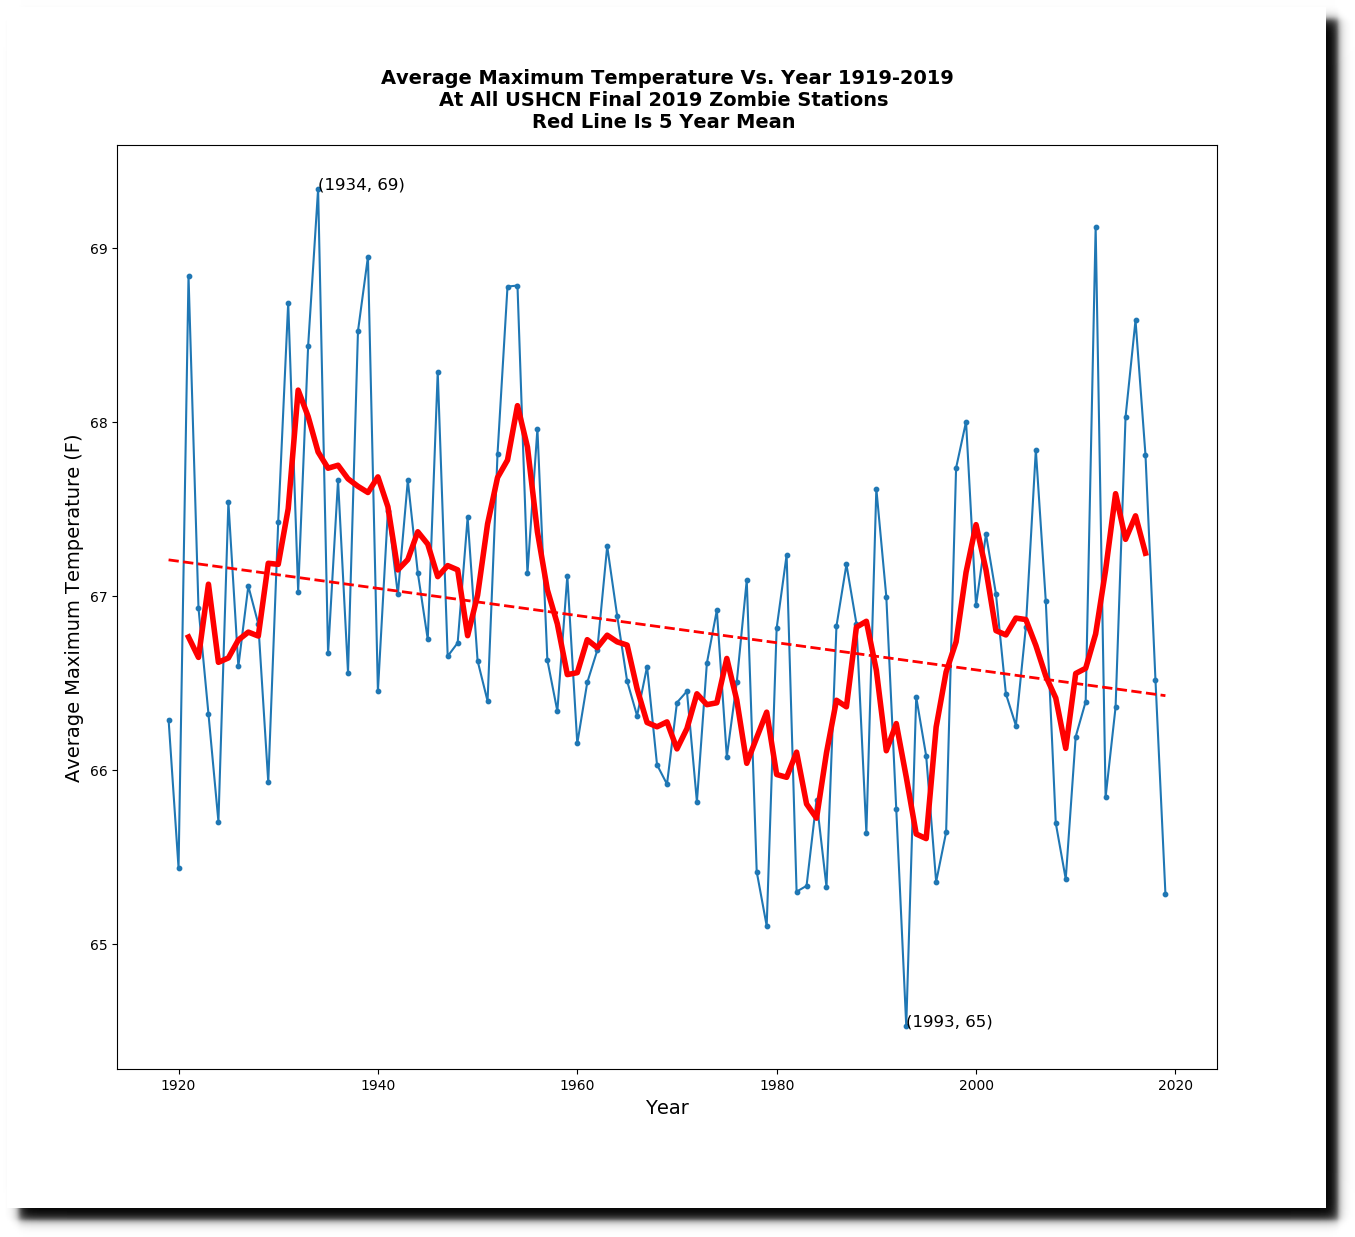
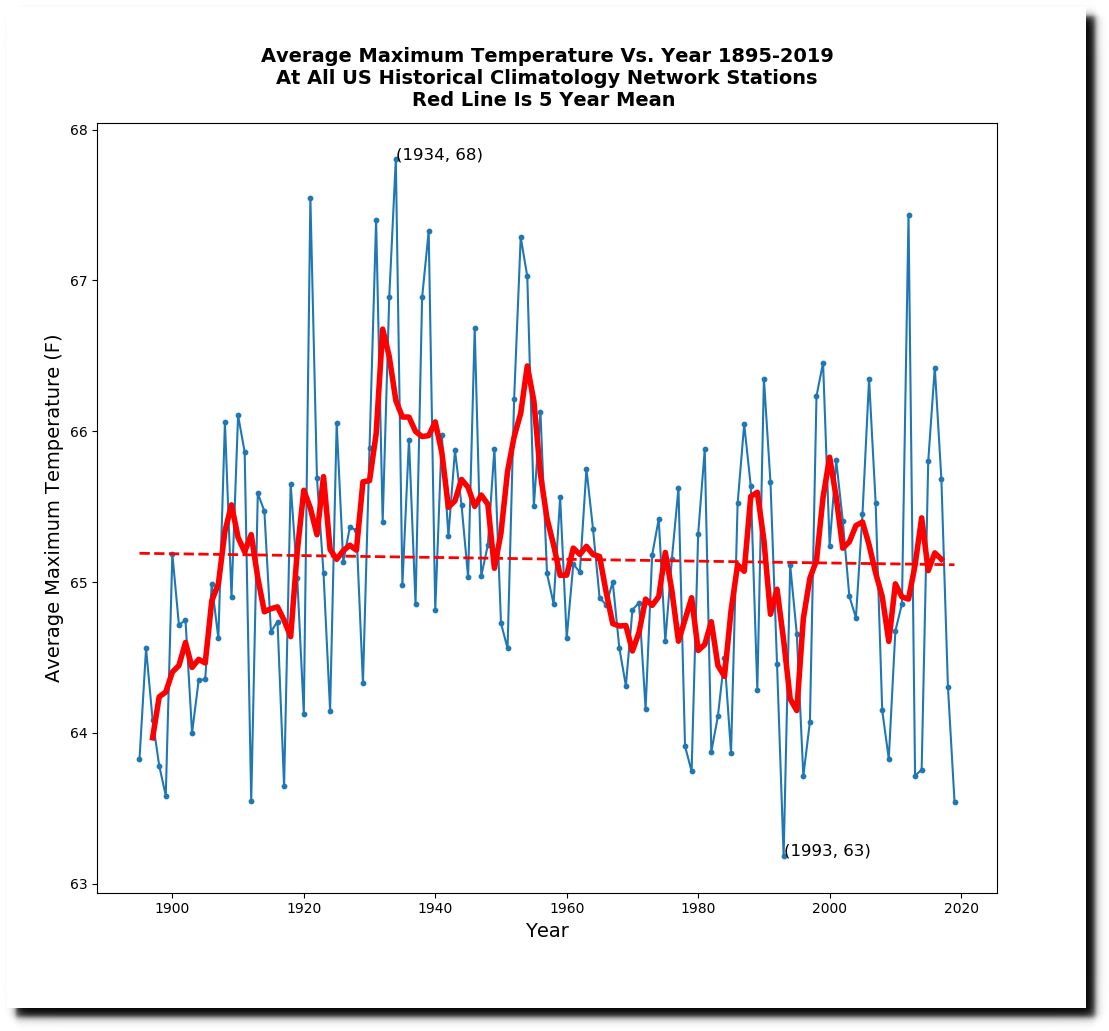
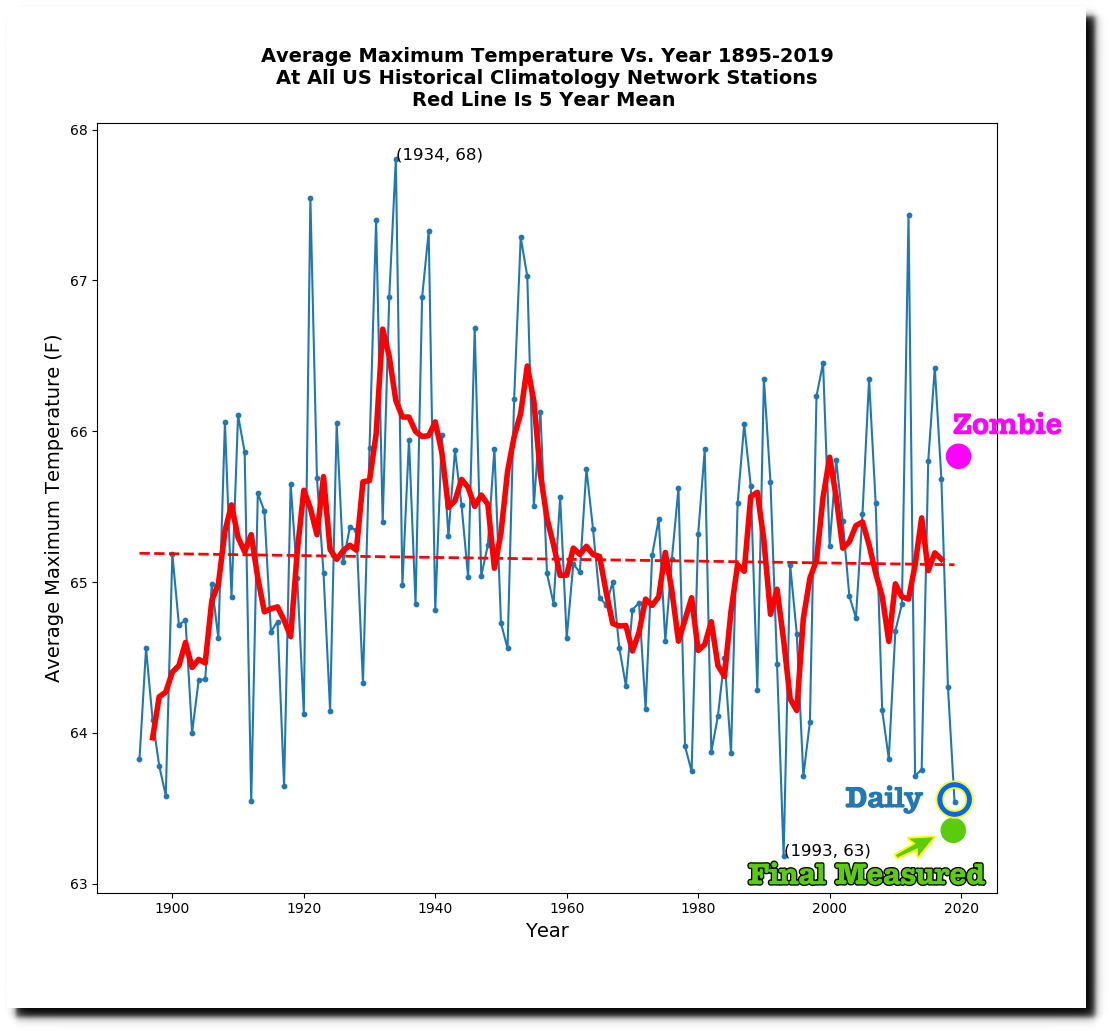
Daily temperature data from NOAA’s United States Historical Climatology Network shows that US maximum temperatures last year were tied for second coolest on record with 1912. The only cooler year was 1993, which was affected by the eruption of Mt. Pinatubo. The trend is strongly downwards since the 1930s.
But NOAA alters the data to turn cooling into warming, and they changed 2019 from second coolest to 71st coolest, or 54th warmest.

Climate at a Glance | National Centers for Environmental Information (NCEI)
NOAA does not adjust daily temperature data, rather they calculate monthly averages and adjust the monthly data. Their monthly “raw” temperatures are very similar to what I calculate from the daily temperatures. NOAA’s “final” data set is very similar to their published graphs, like the one above.
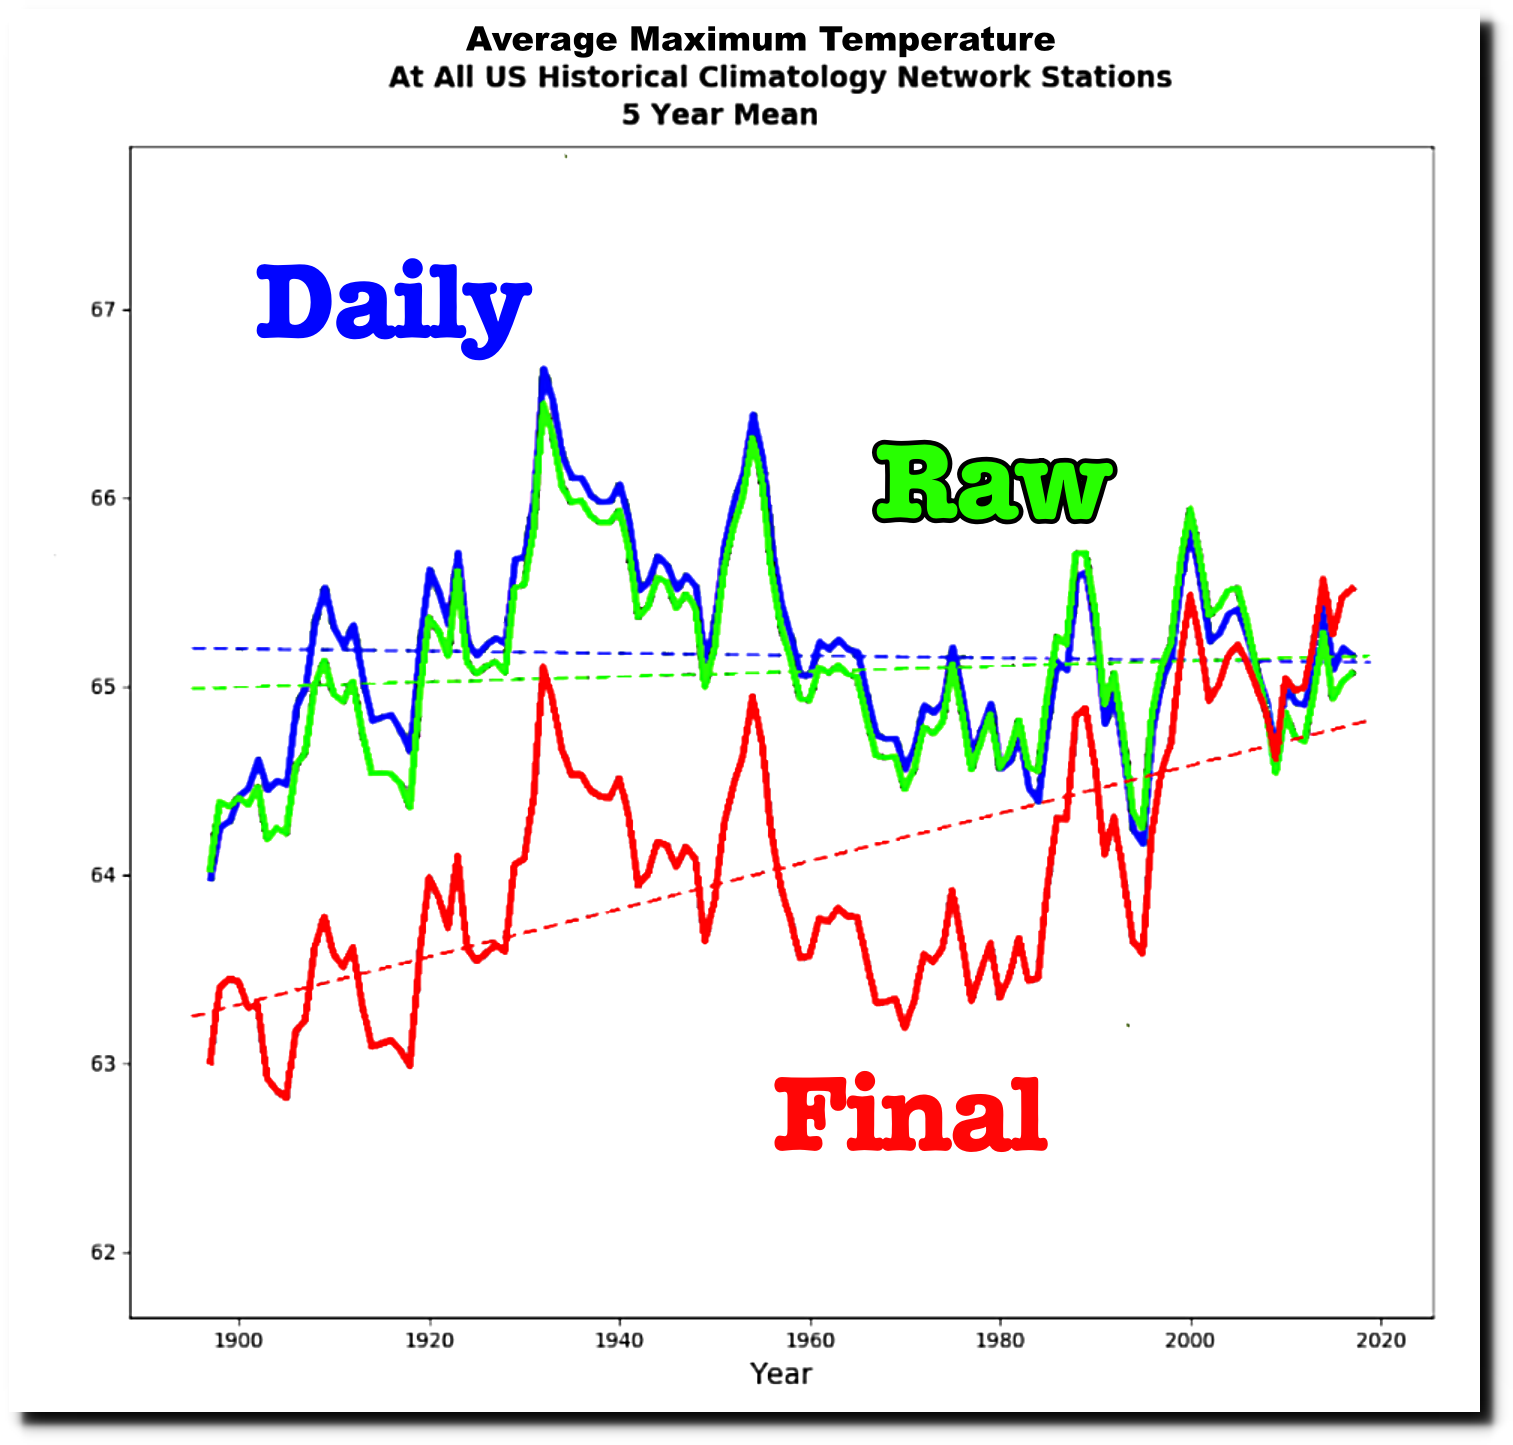
The adjustments are done in two stages. First is a time of observation adjustment (TOB), and then comes the final adjustment.
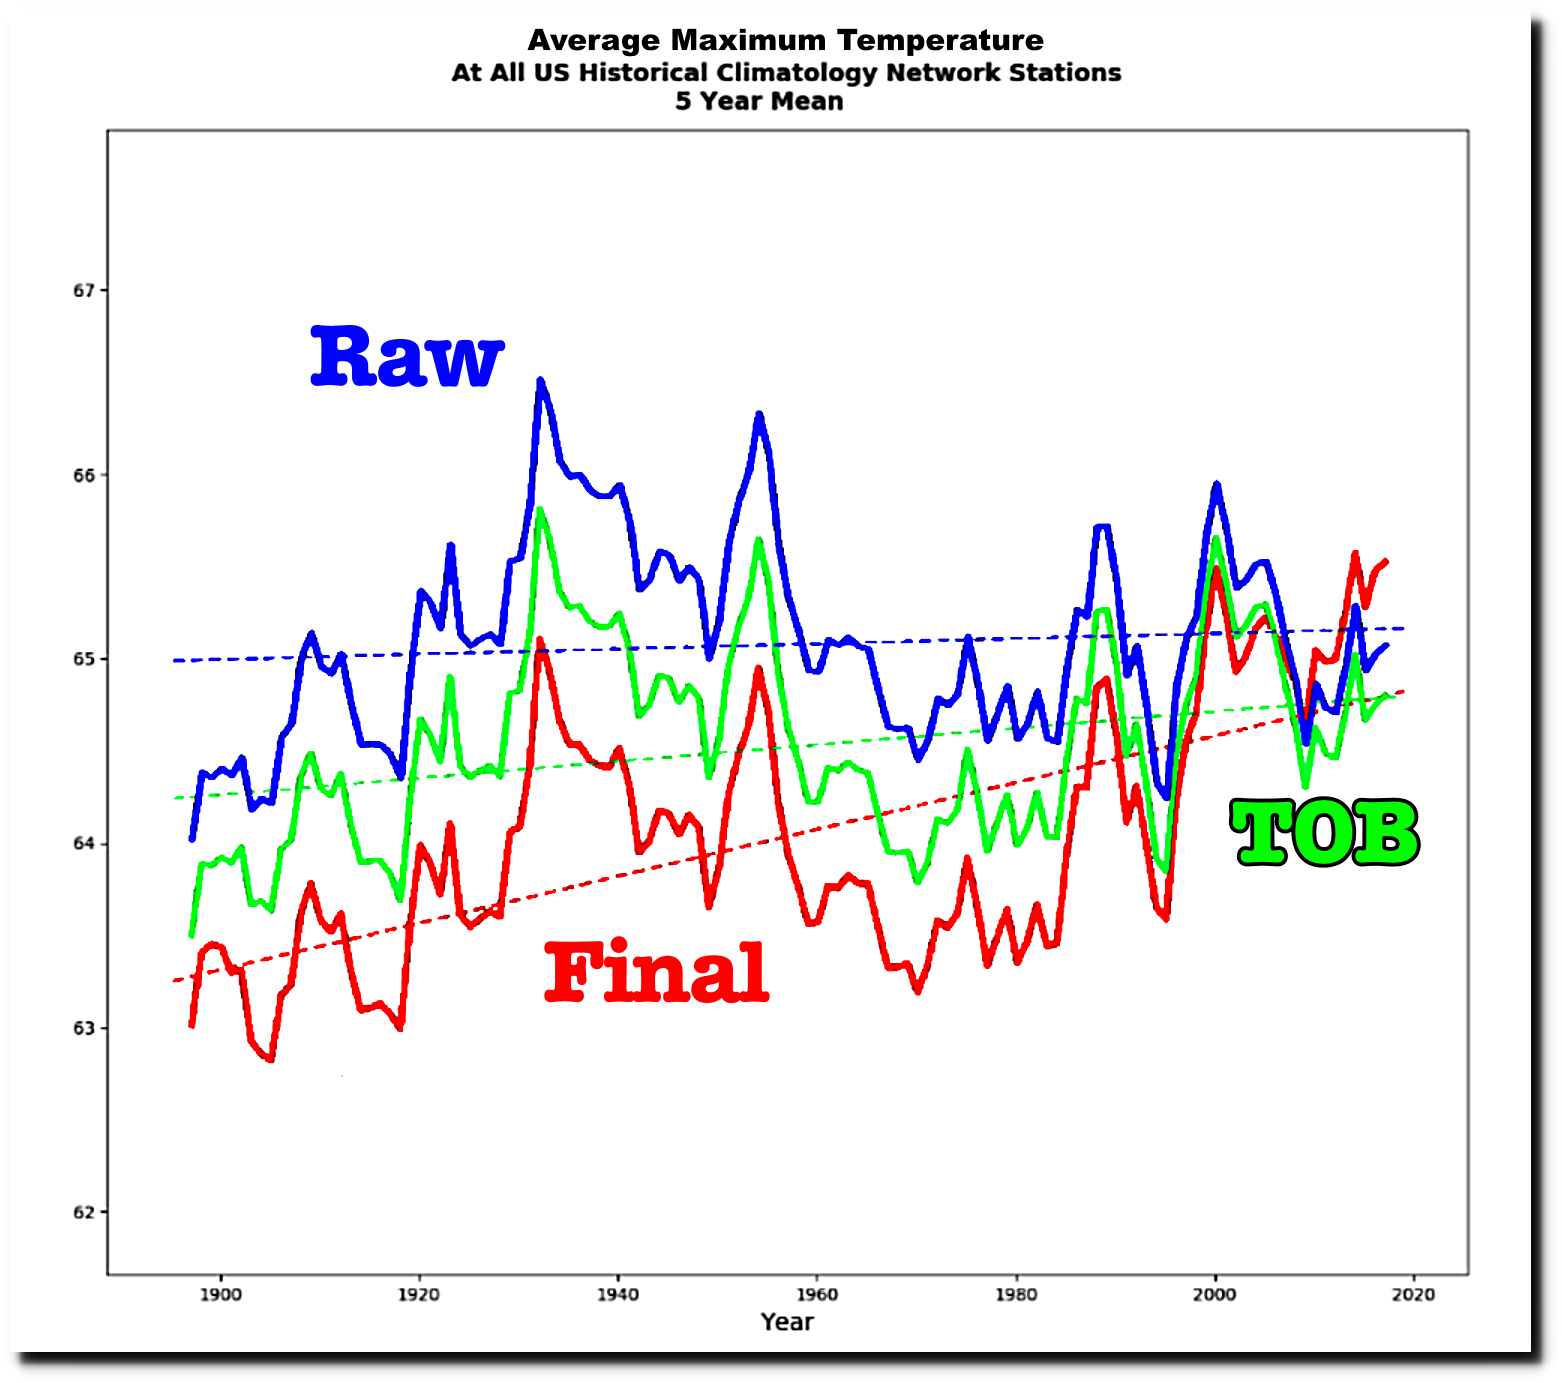
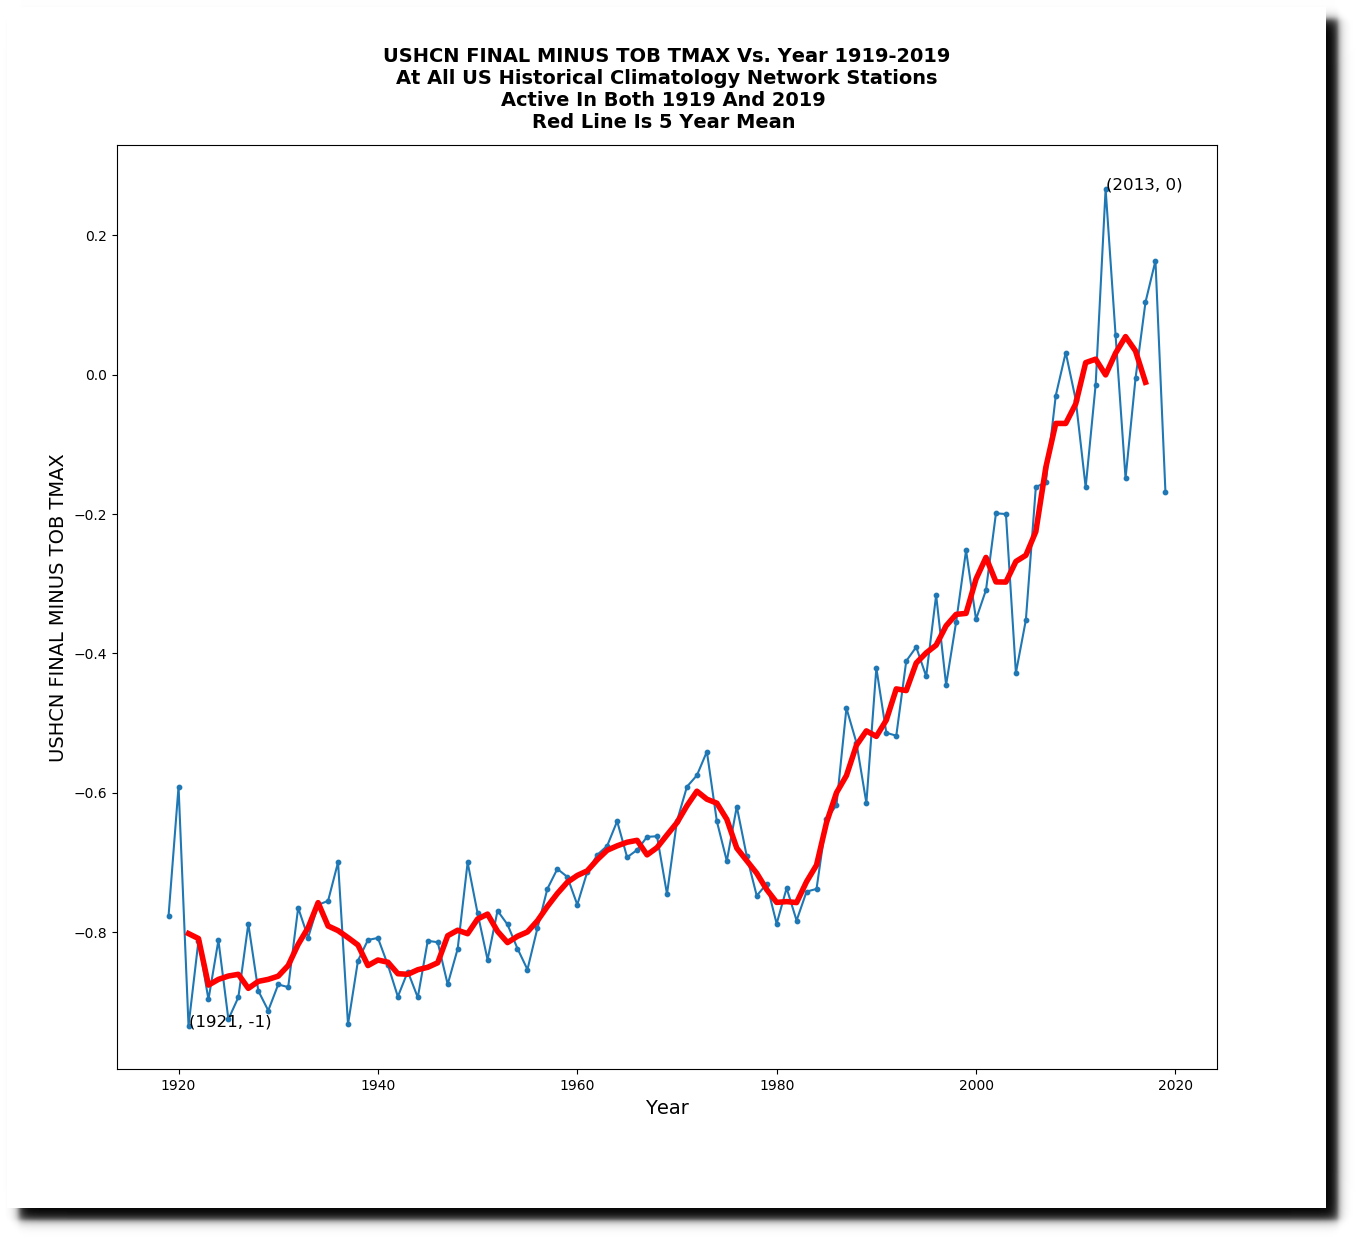
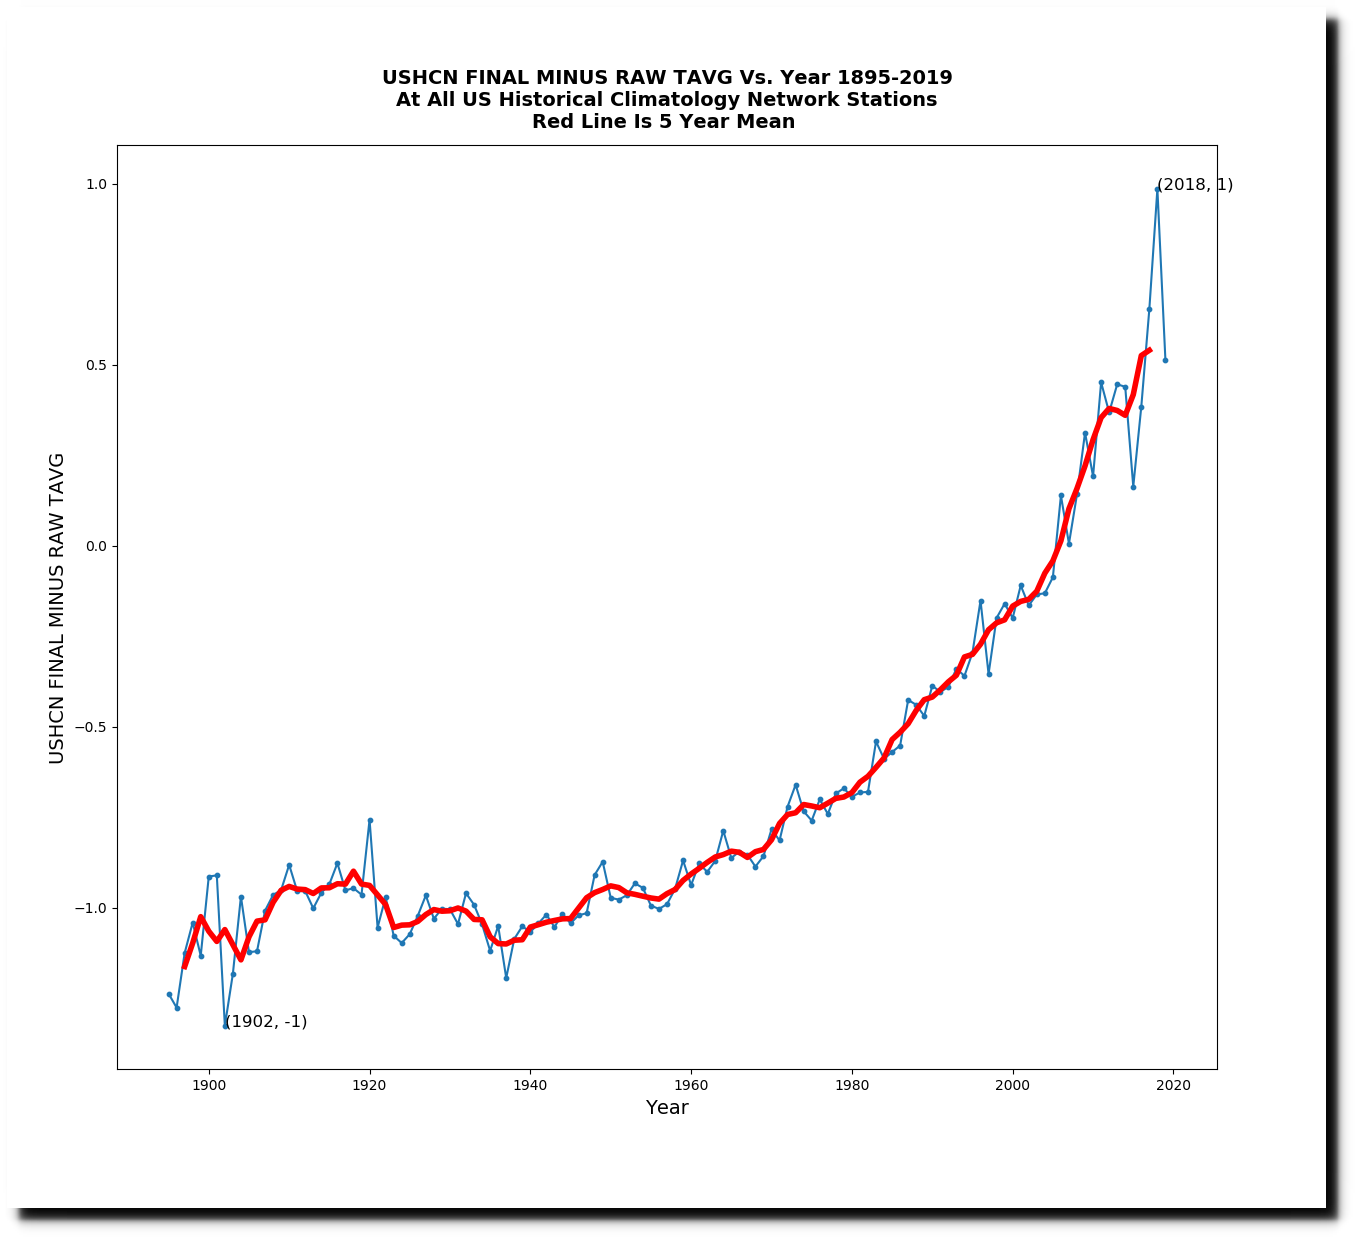
Temperatures prior to 1980 are cooled more than a degree, and recent temperatures are warmed nearly one degree. There is a hockey stick after the year 1980.
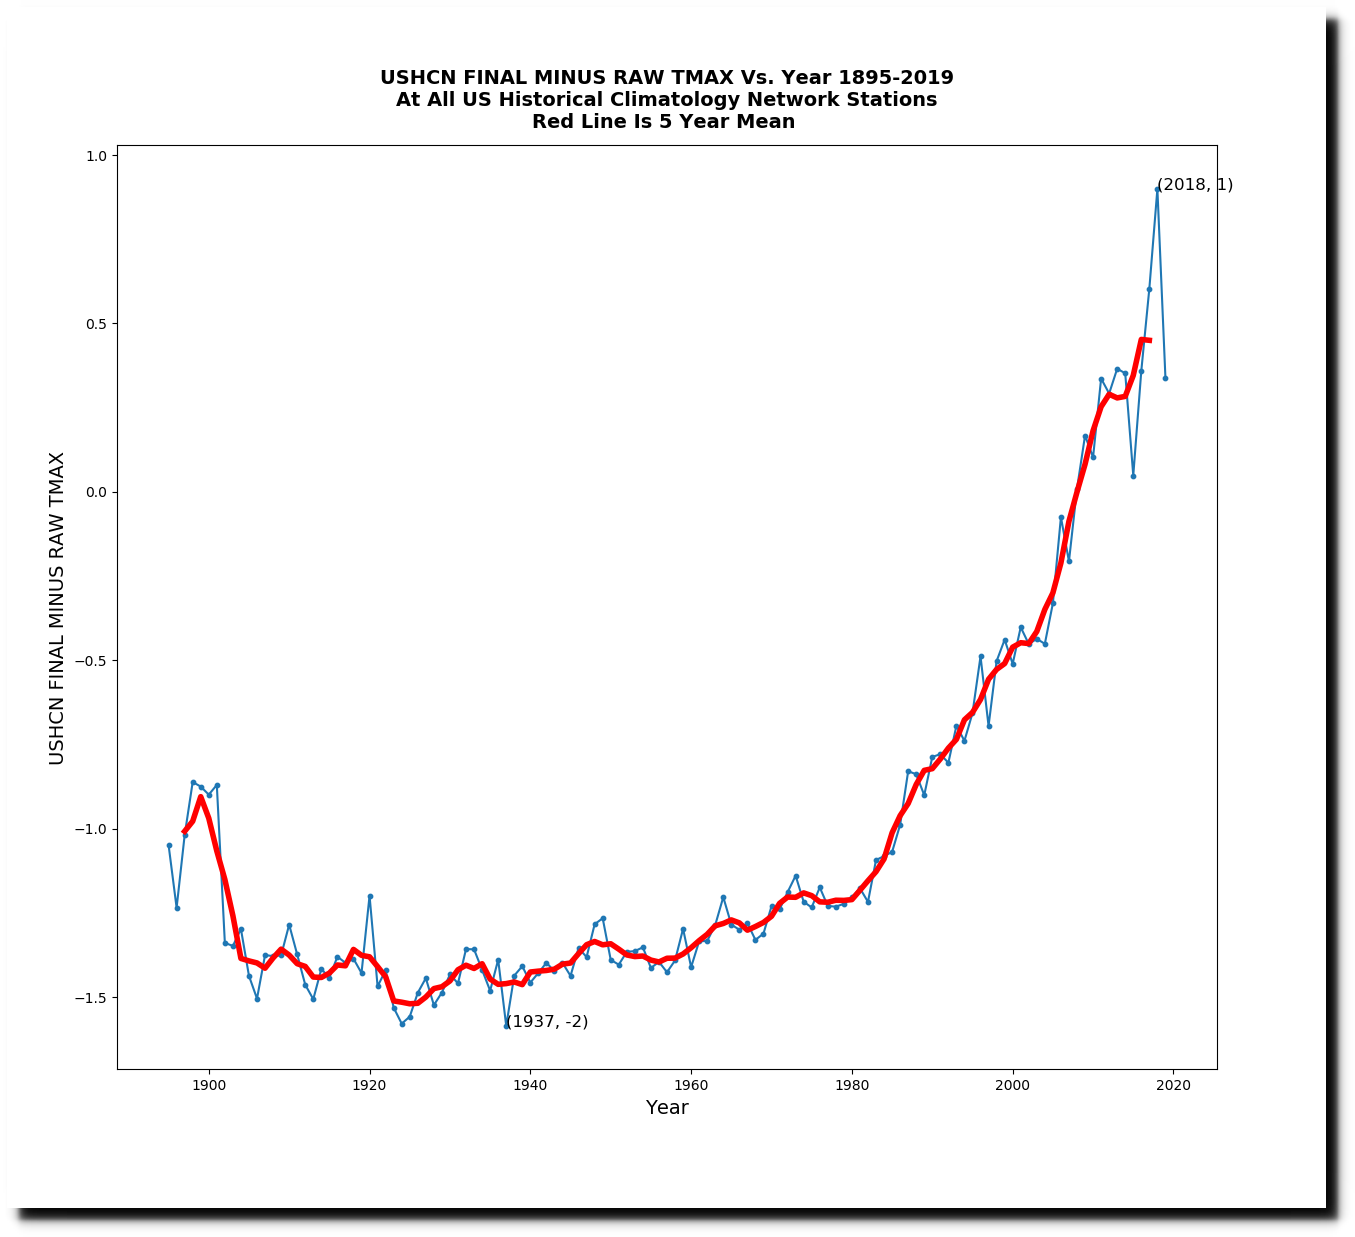
Time of Observation Bias adjustments are small, and haven’t changed for 20 years. The vast majority of data tampering is done in the final adjustment.
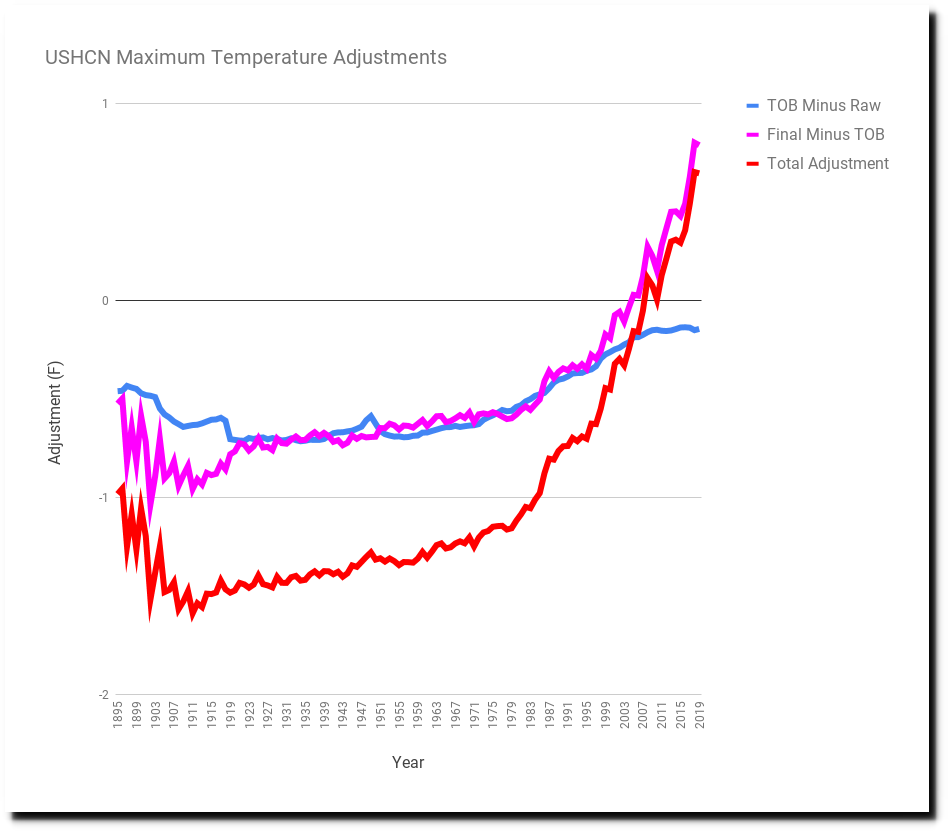
Since the year 1980, final and TOB adjustments are diverging in a hockey stick.’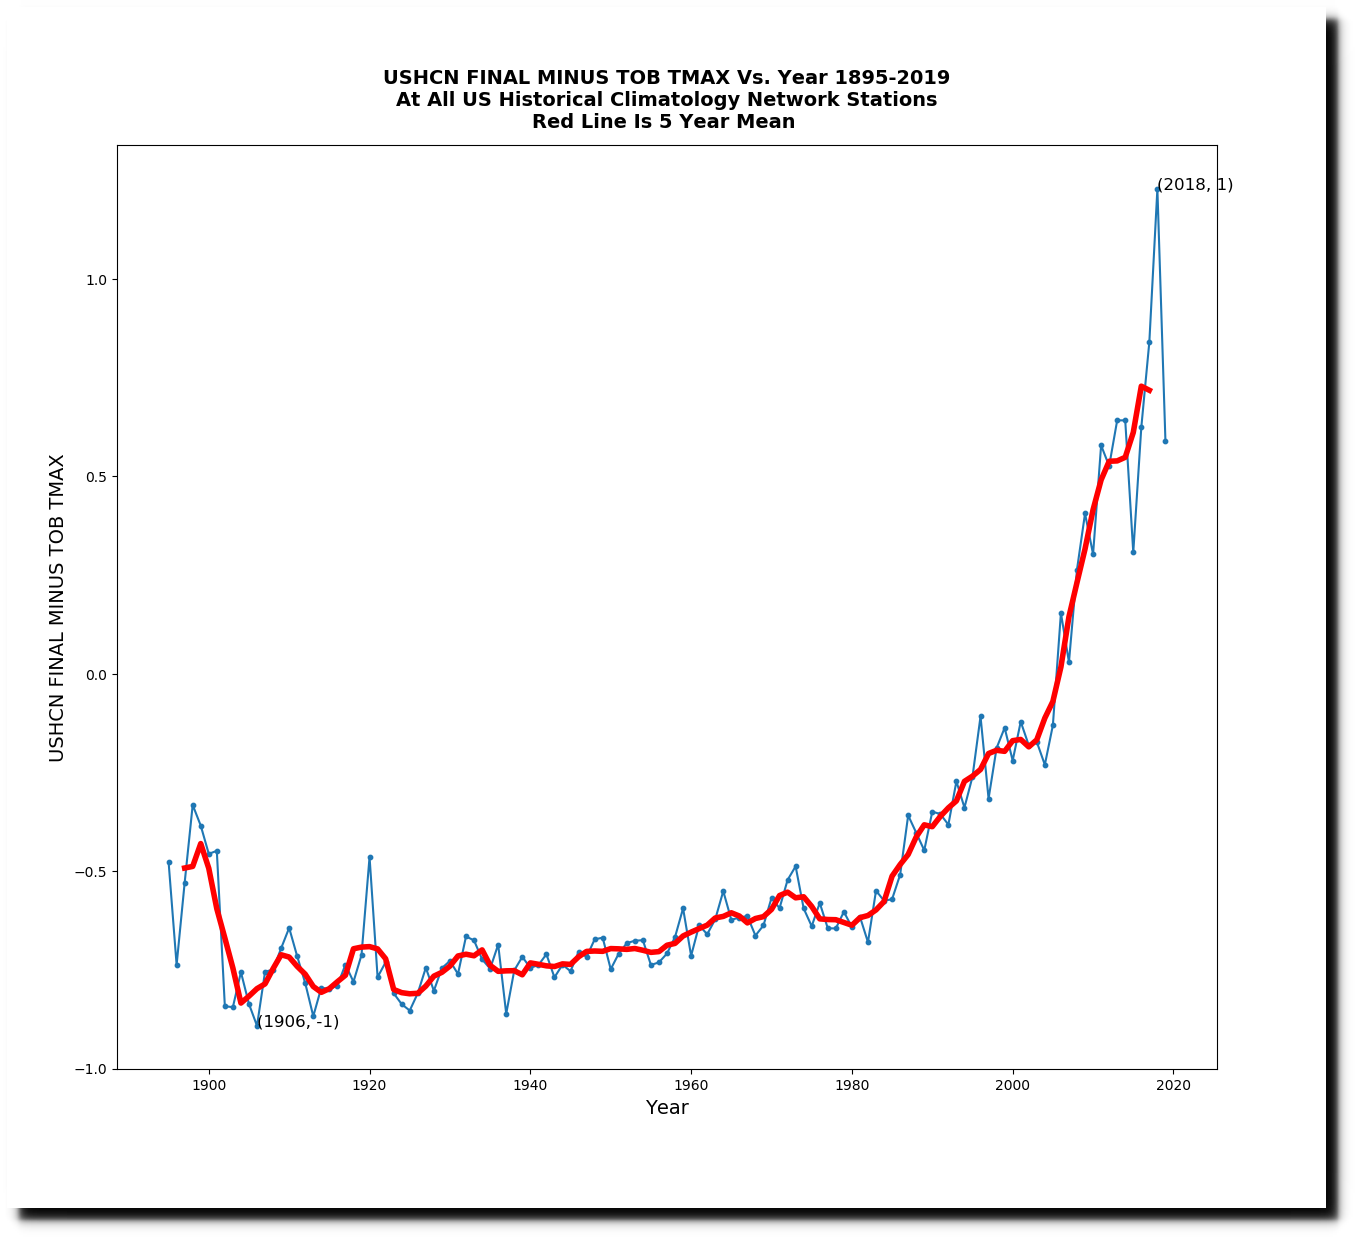
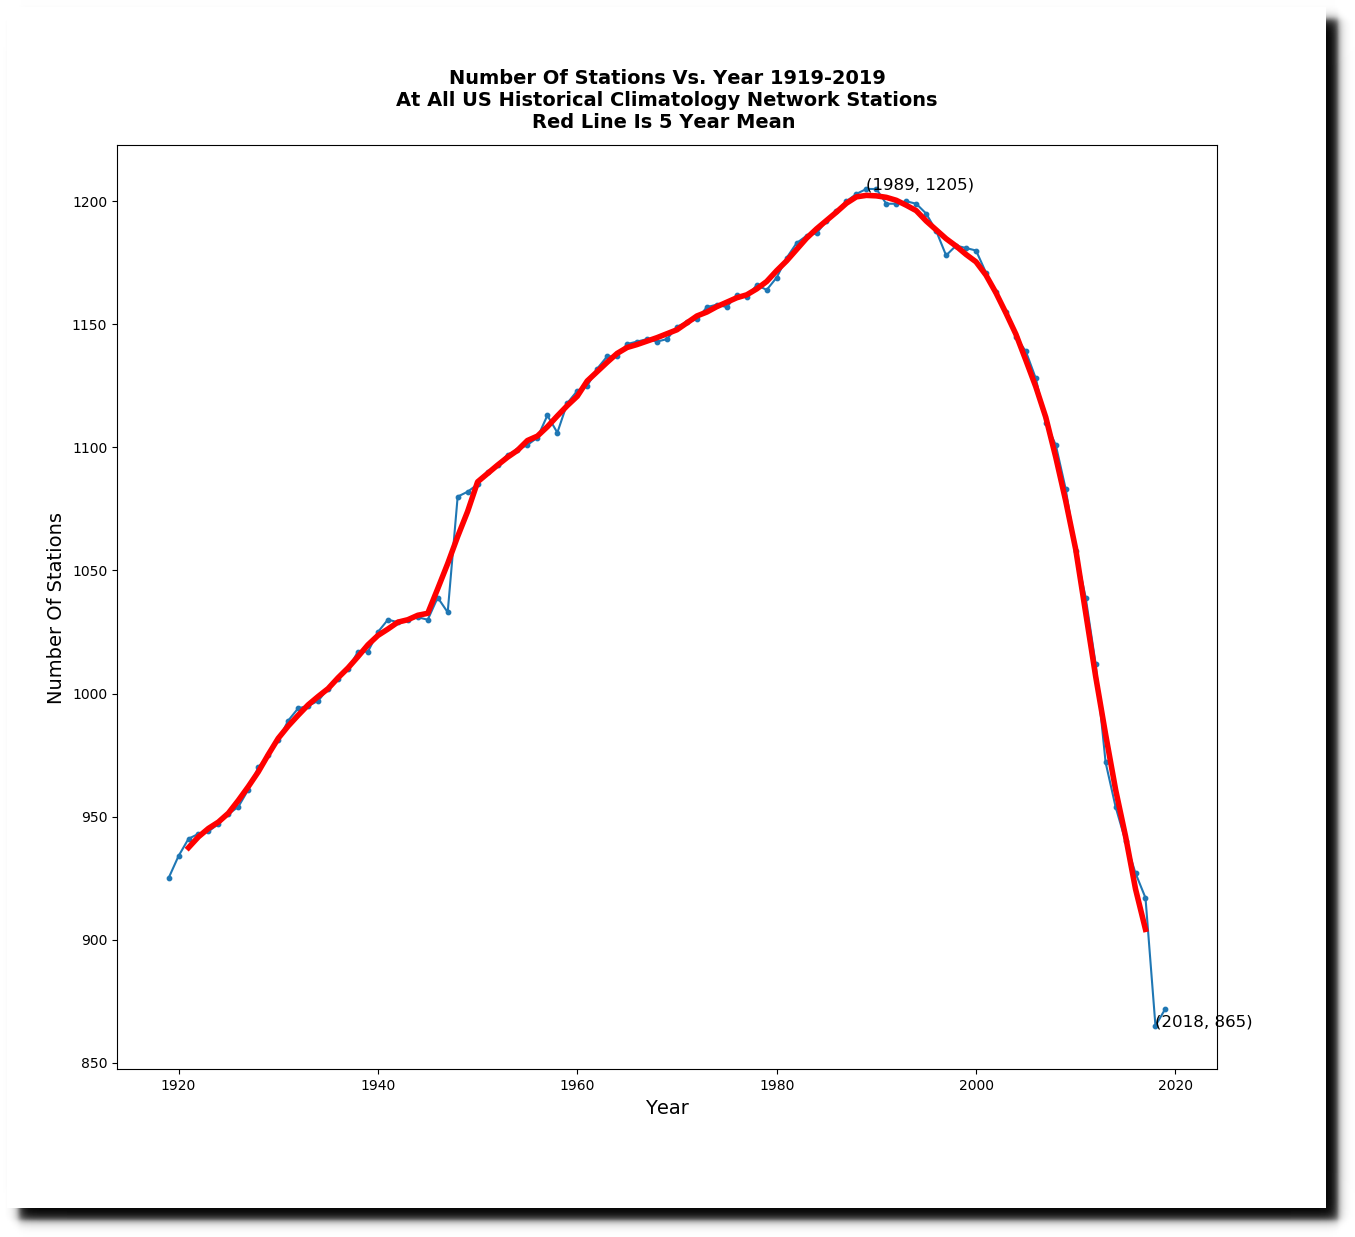
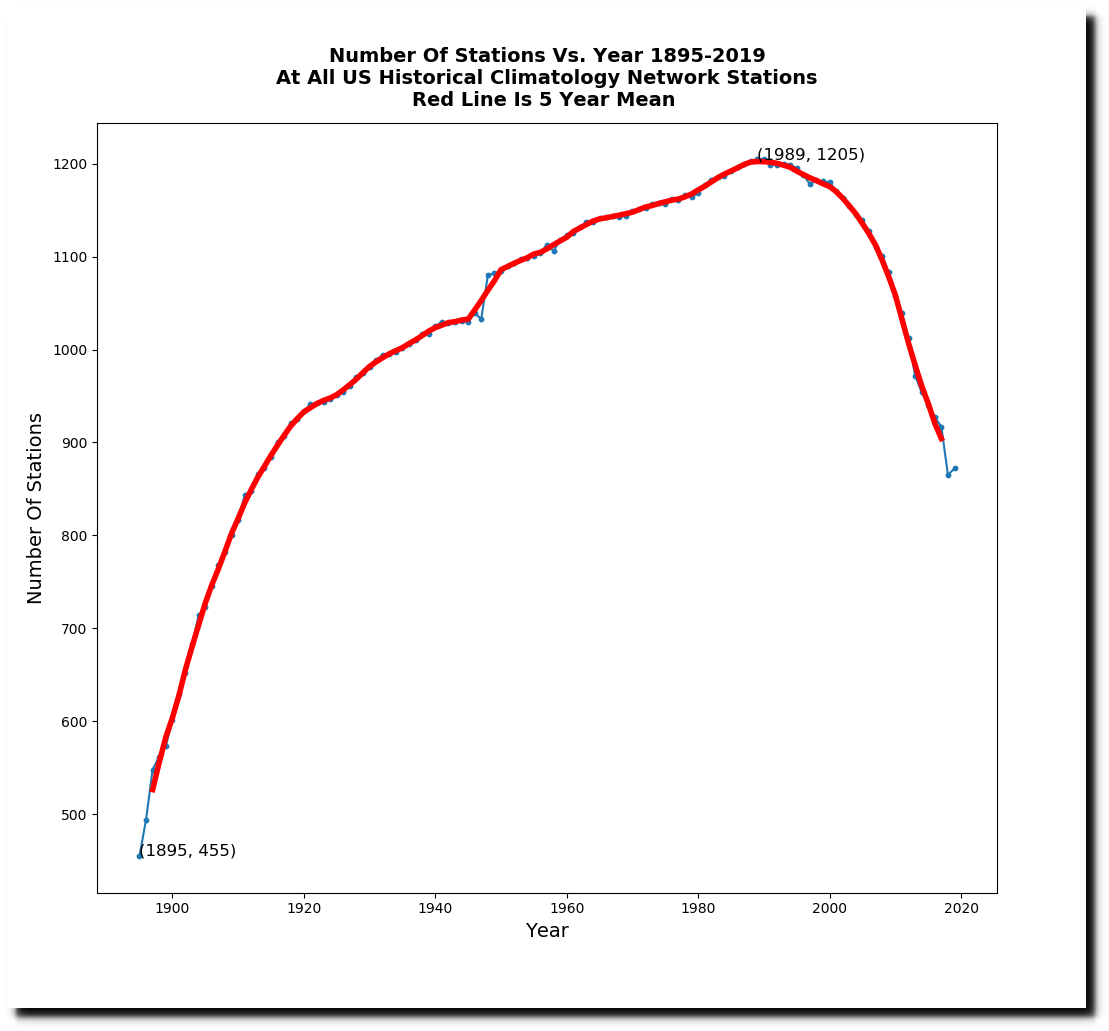
There has been a sharp decline in the number of reporting stations over the past 30 years.
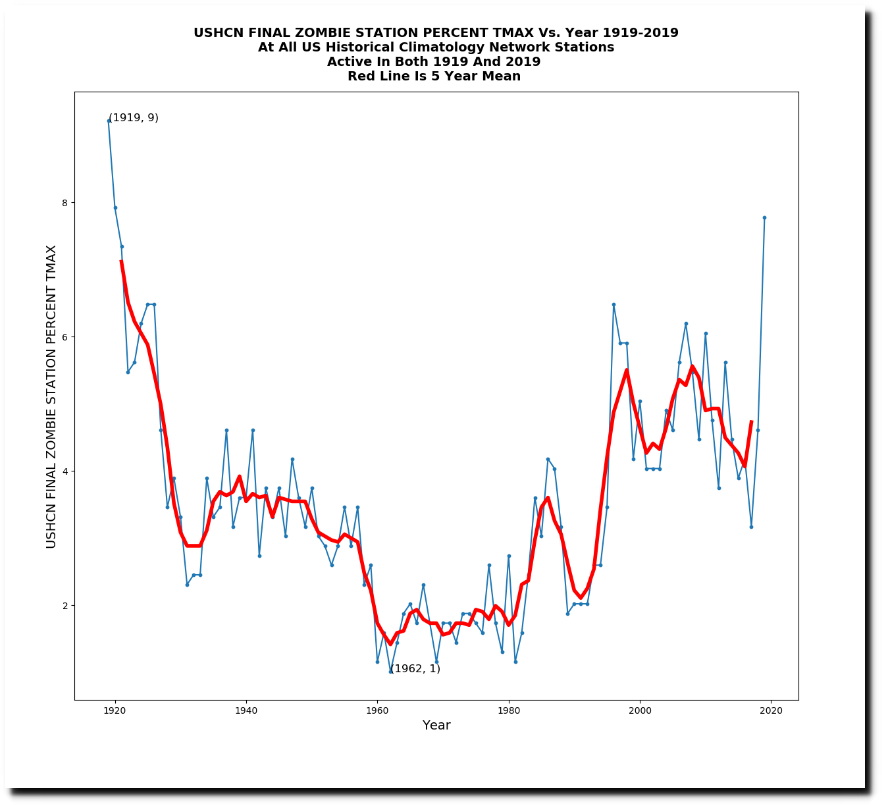
When NOAA doesn’t have data for a station, they fabricate it. More than 40% of the data is now “estimated” from a computer model.
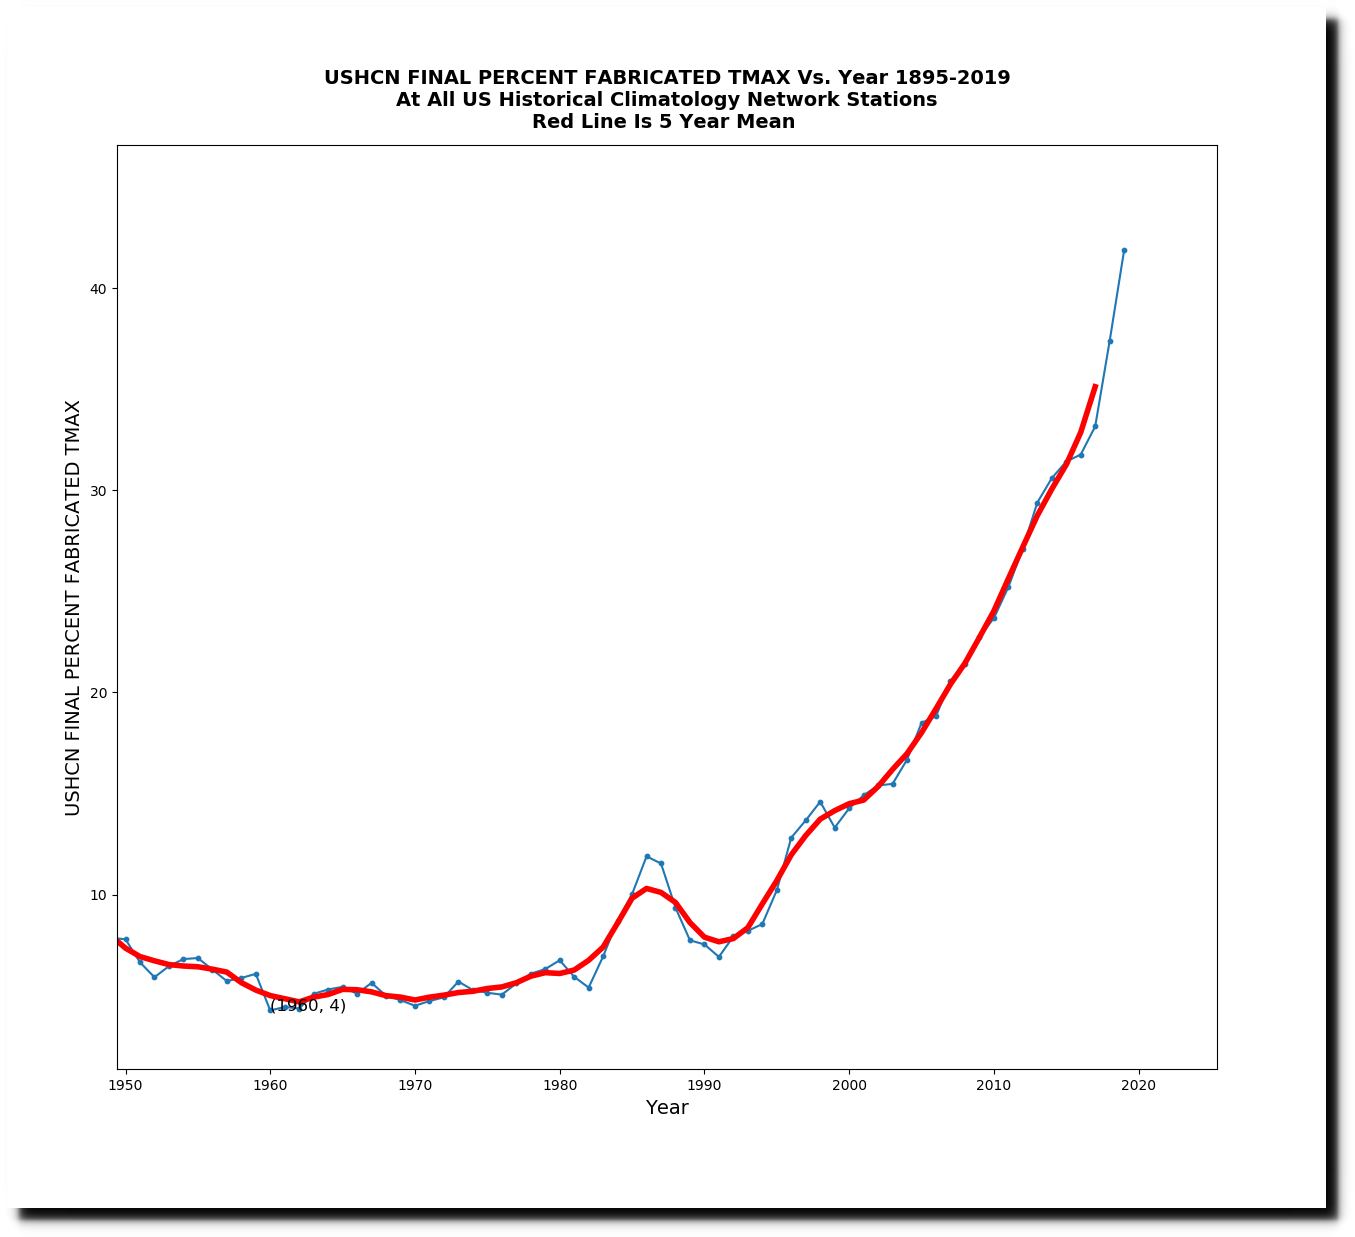
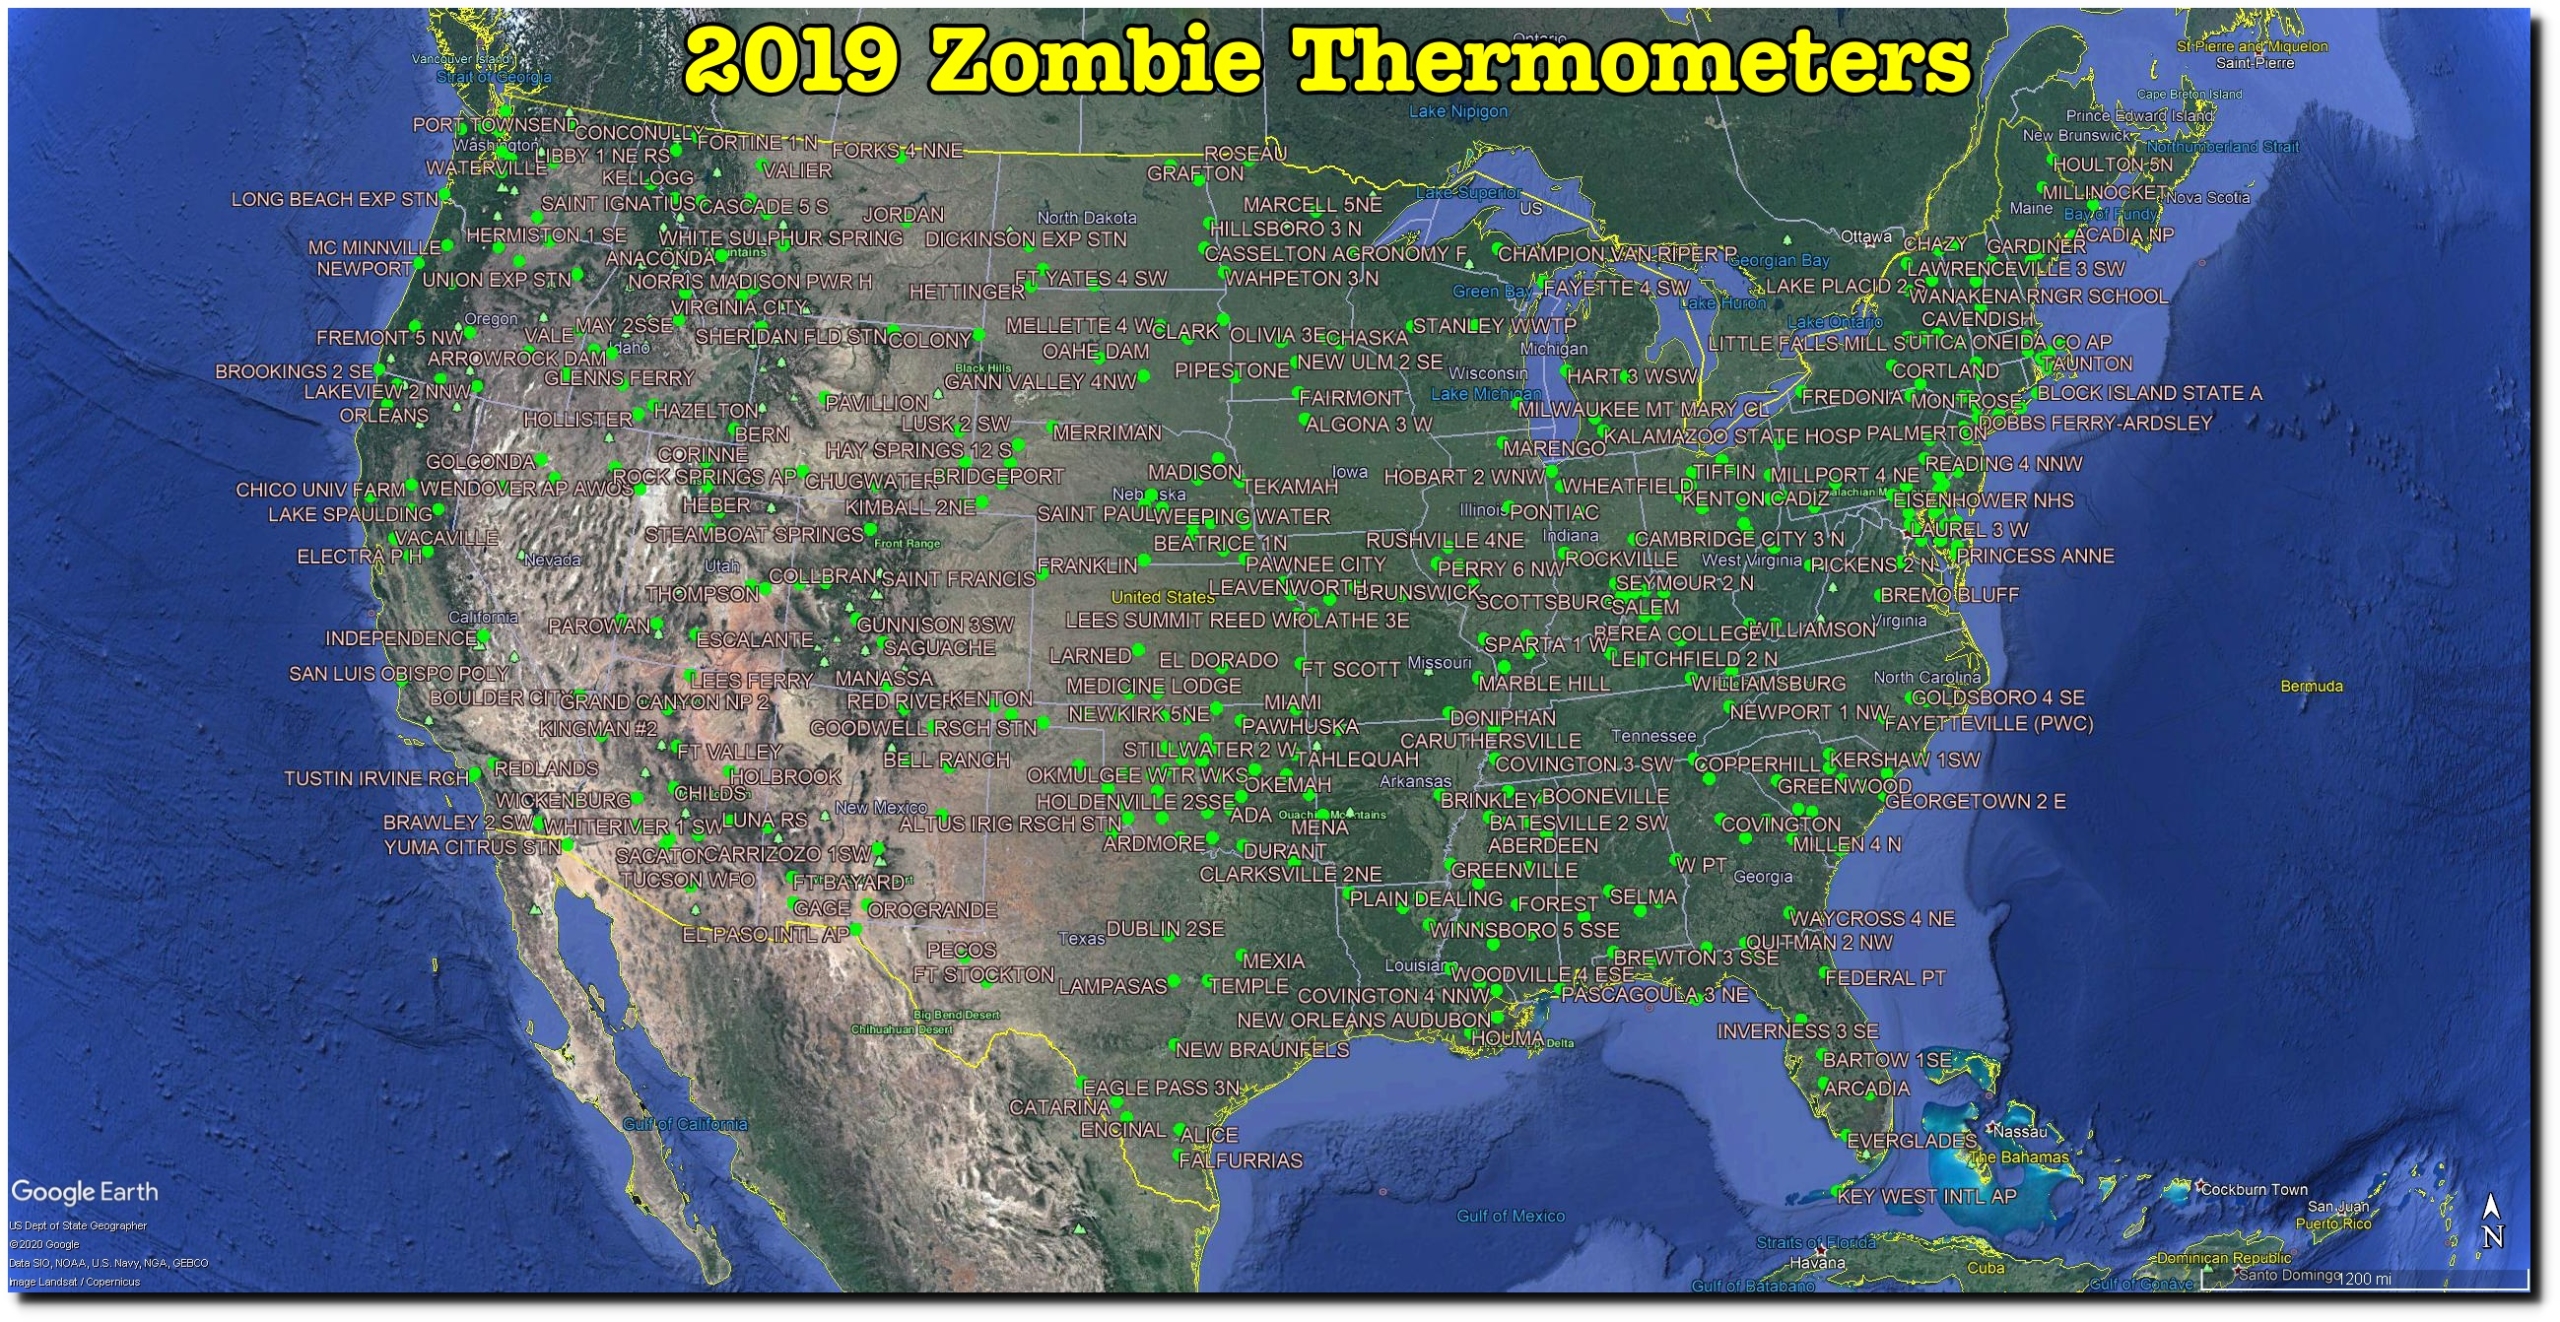
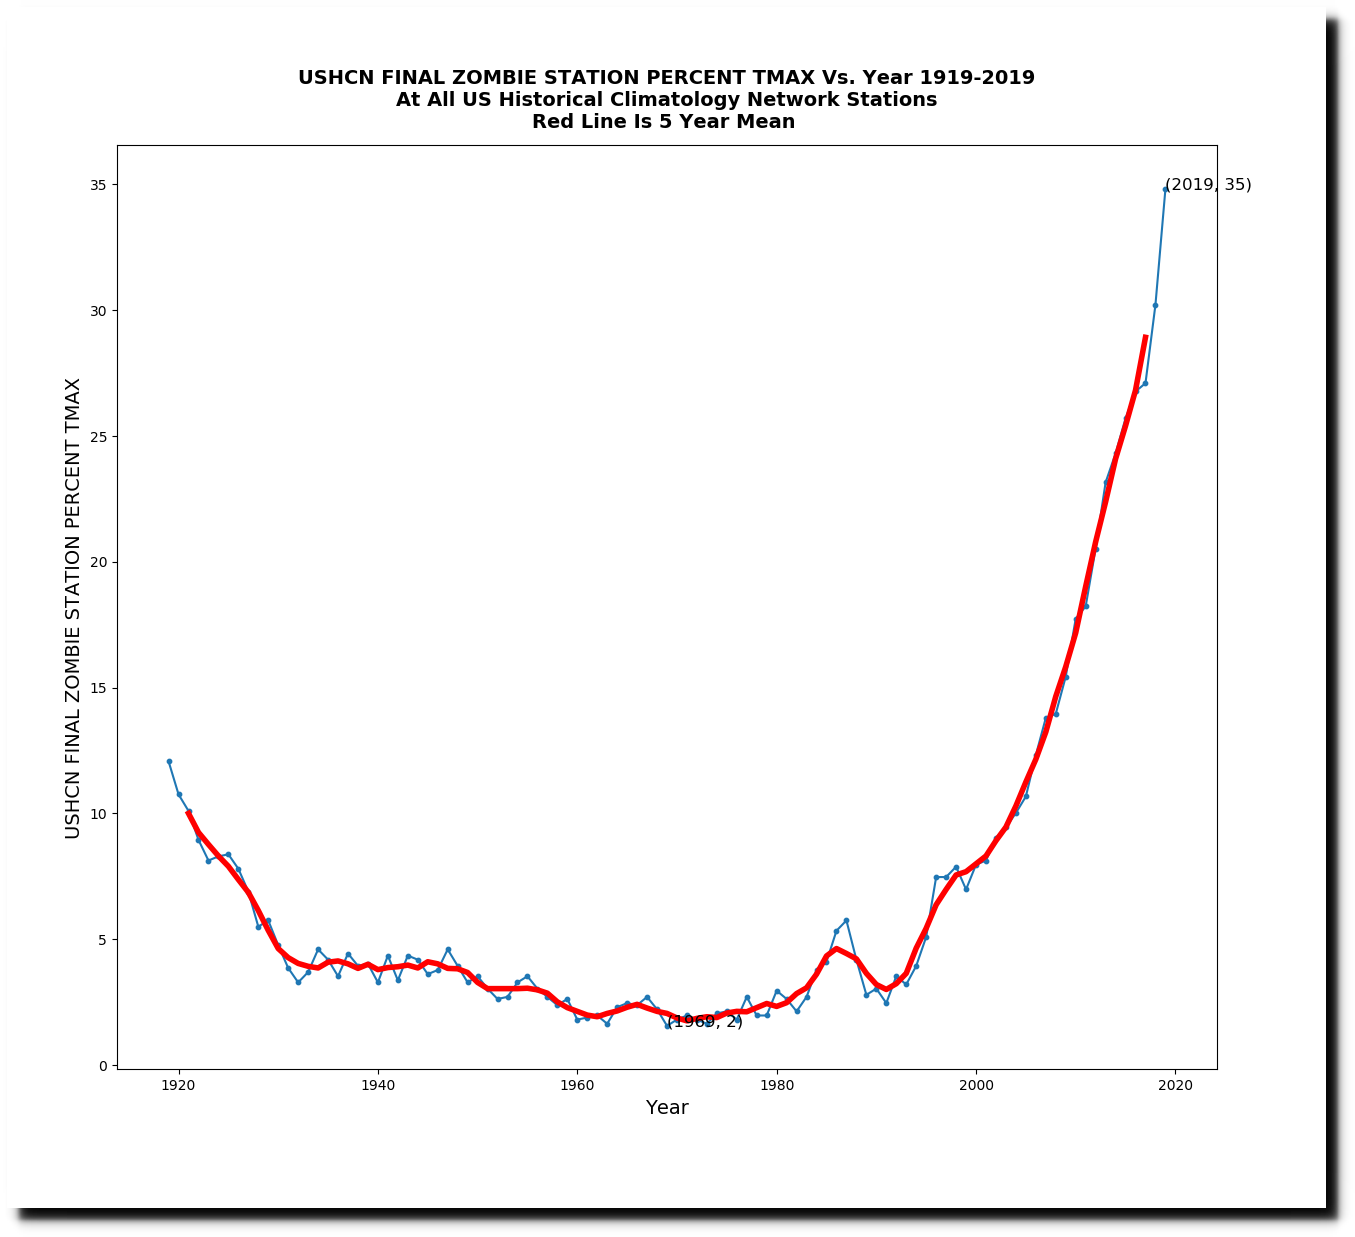
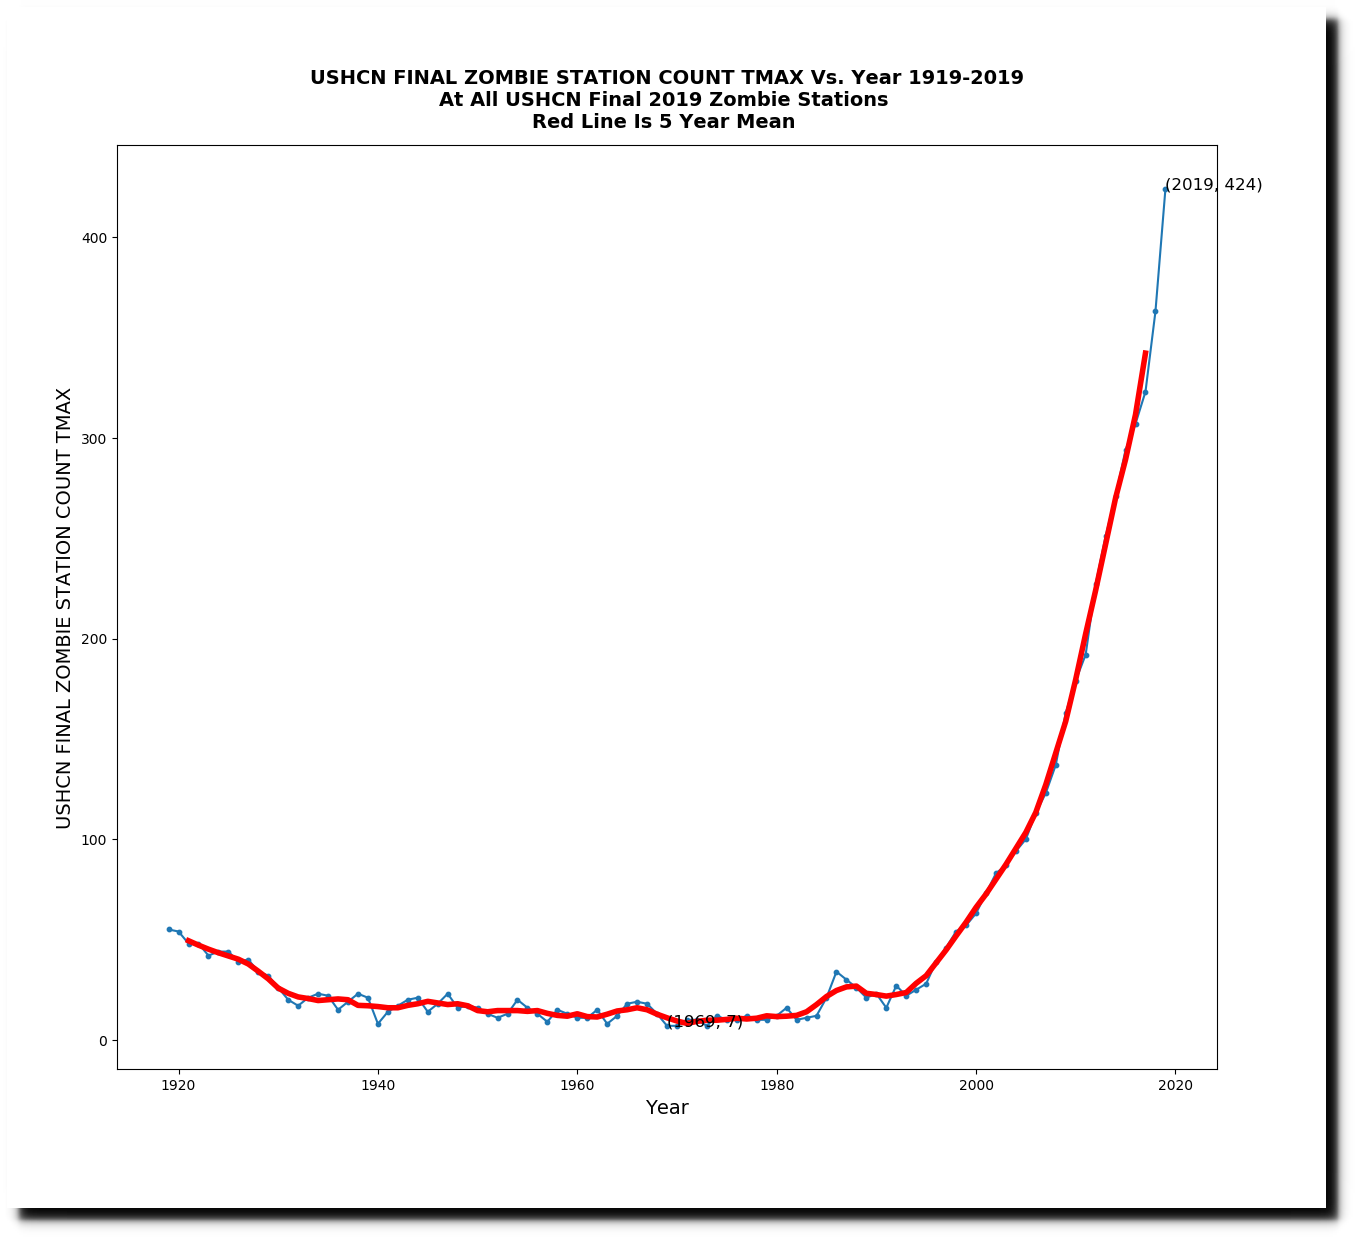
More than one third (424) of the 1,218 USHCN stations had estimated data for all 12 months in 2019. These fake (zombie) stations averaged about two degrees warmer than the adjusted measured stations and the raw daily measurements.

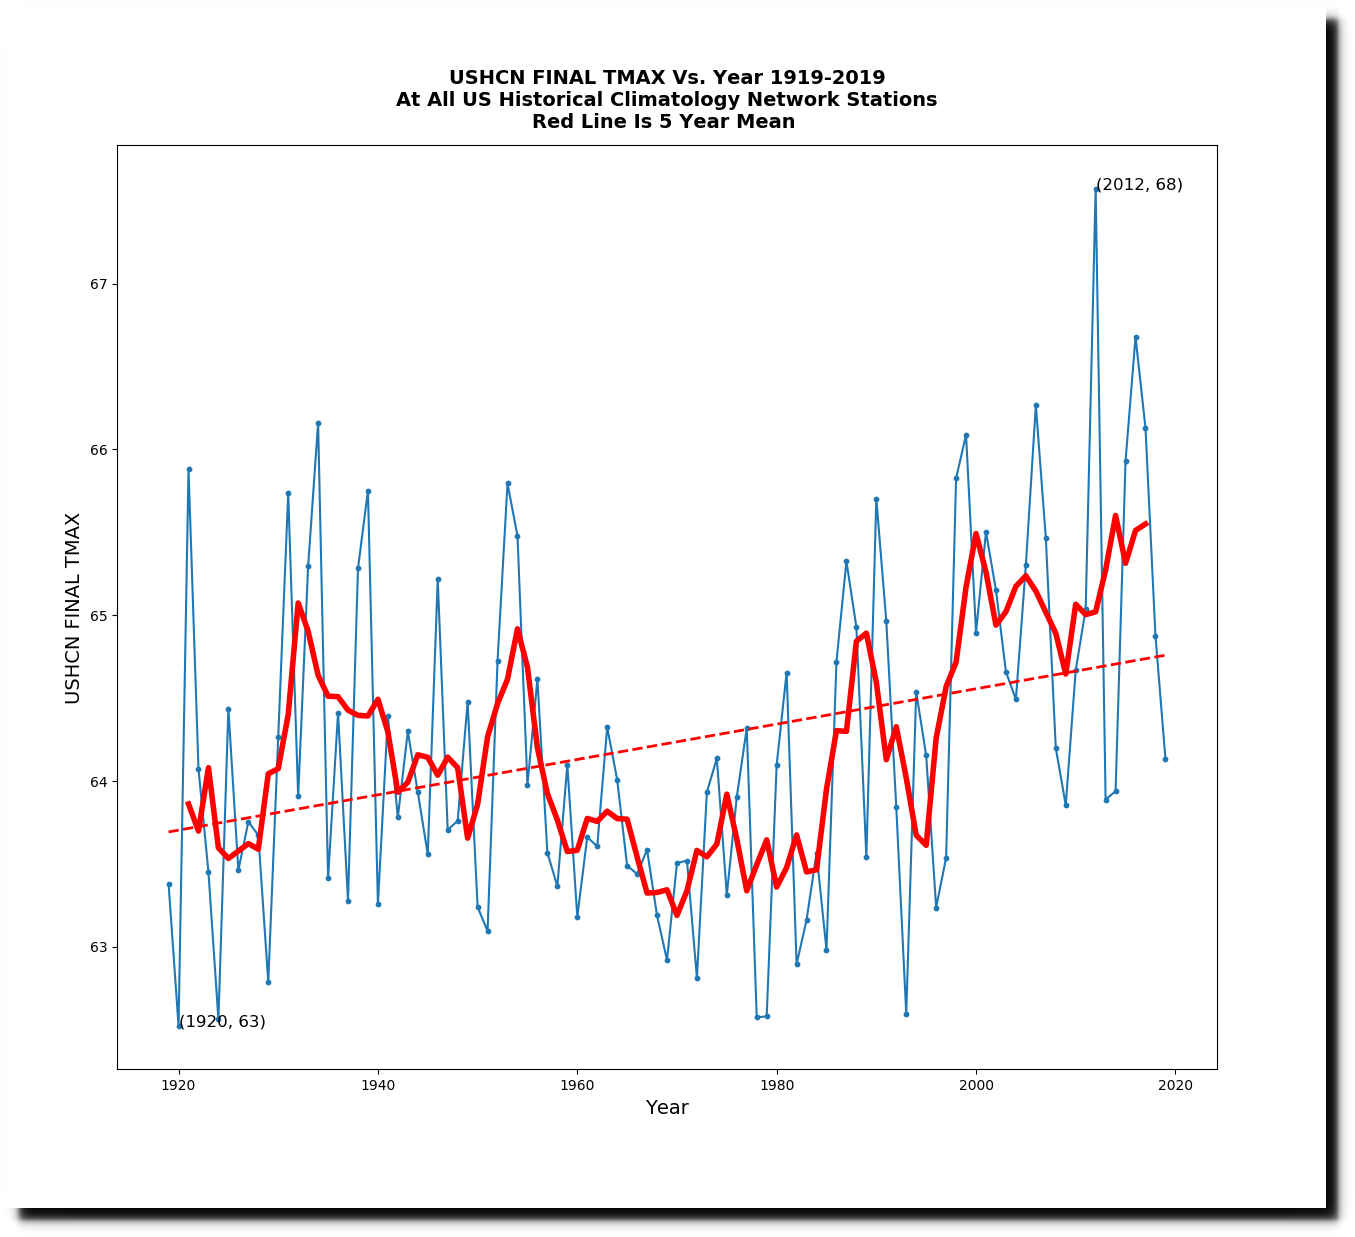
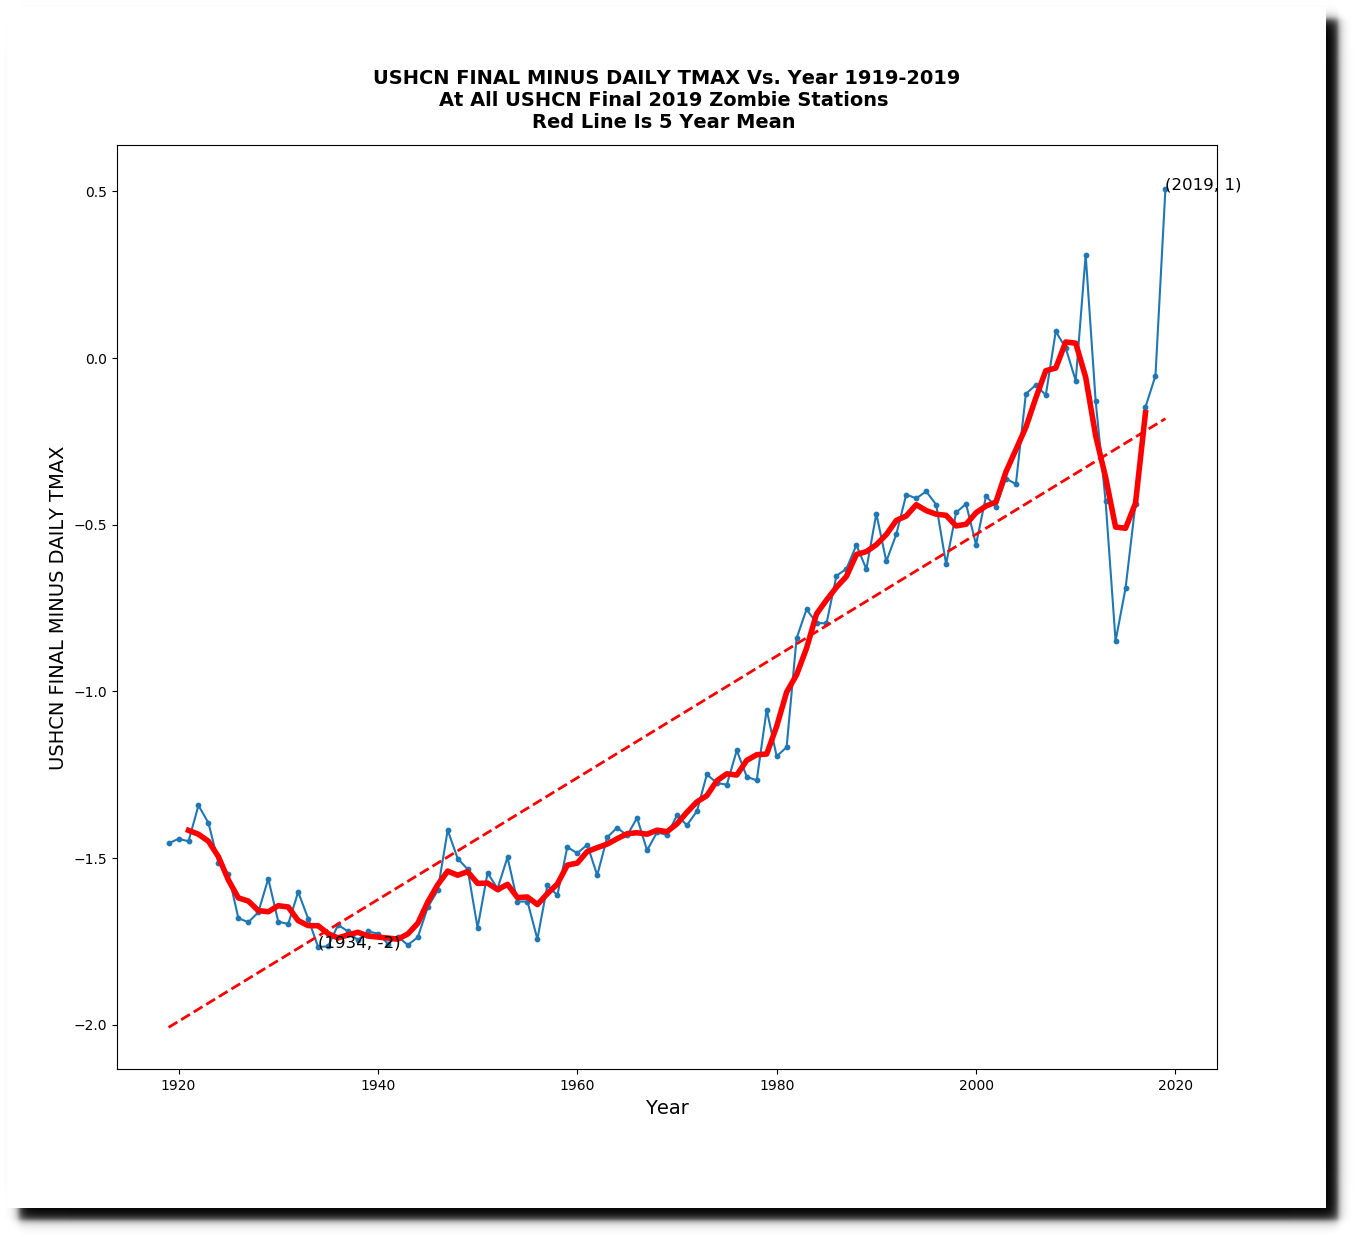
It would be easy to jump to the conclusion that zombie stations are the cause of the post-1980 hockey stick, so I tried a different experiment to test that theory. I used the set of all 672 stations which had daily temperature data for both 1919 and 2019. This group only had 15% fake data in 2019, compared to 42% when using the group of all 1,218 stations.
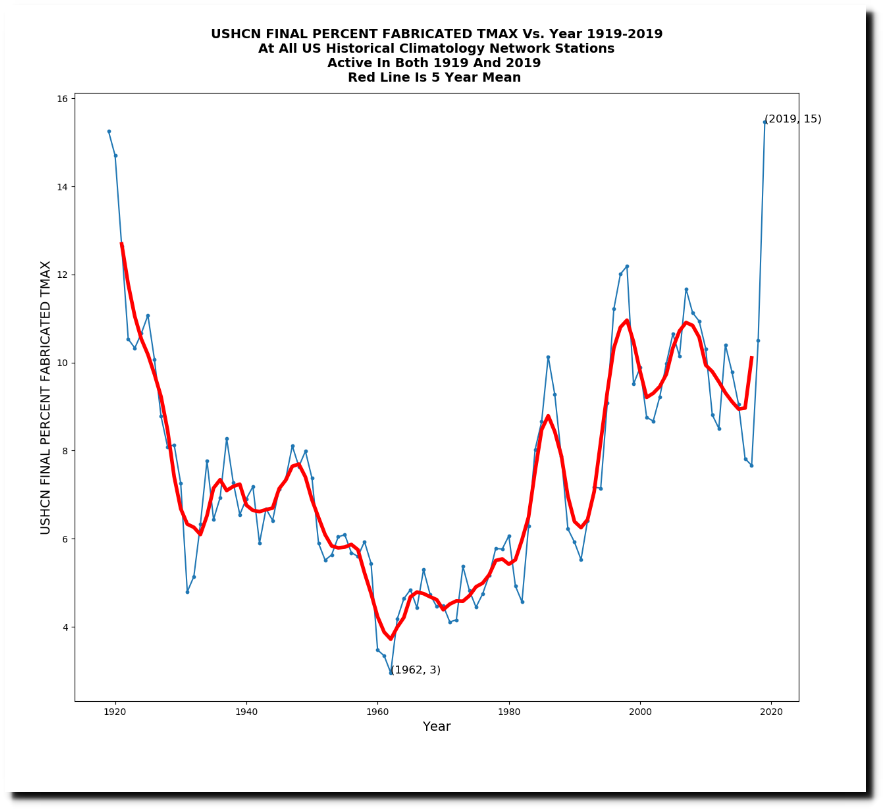
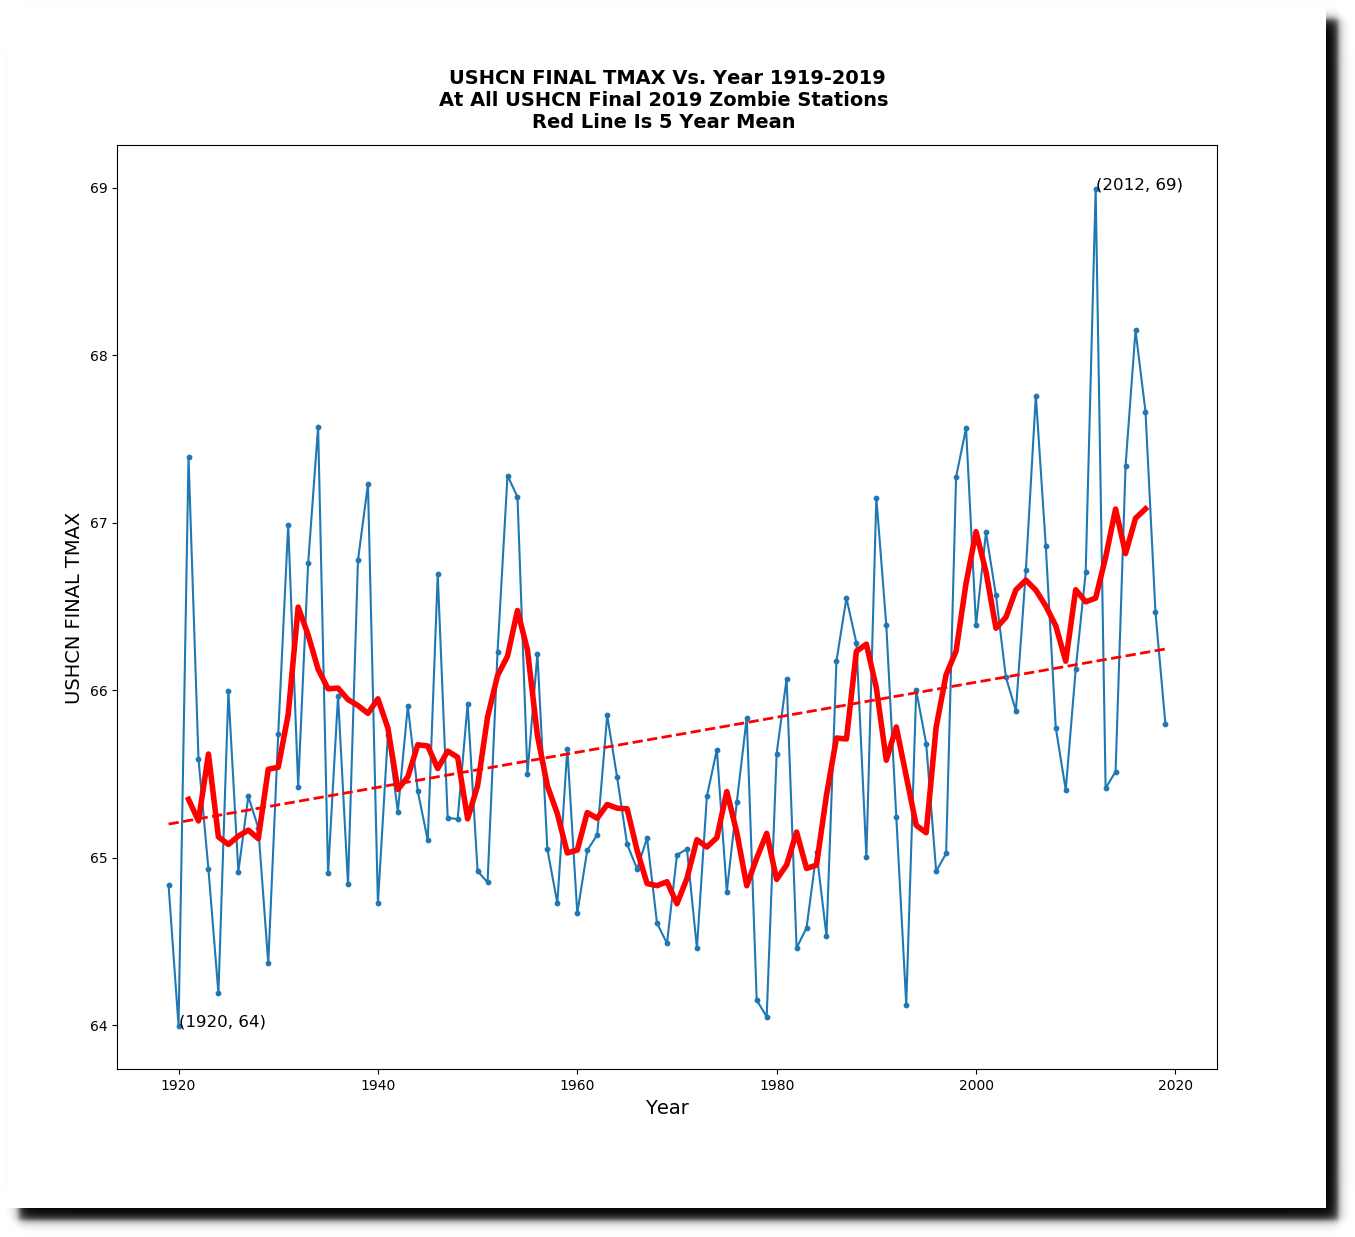
That group had 8% zombie stations, and shows similar patterns to the group of all 1,218 stations.
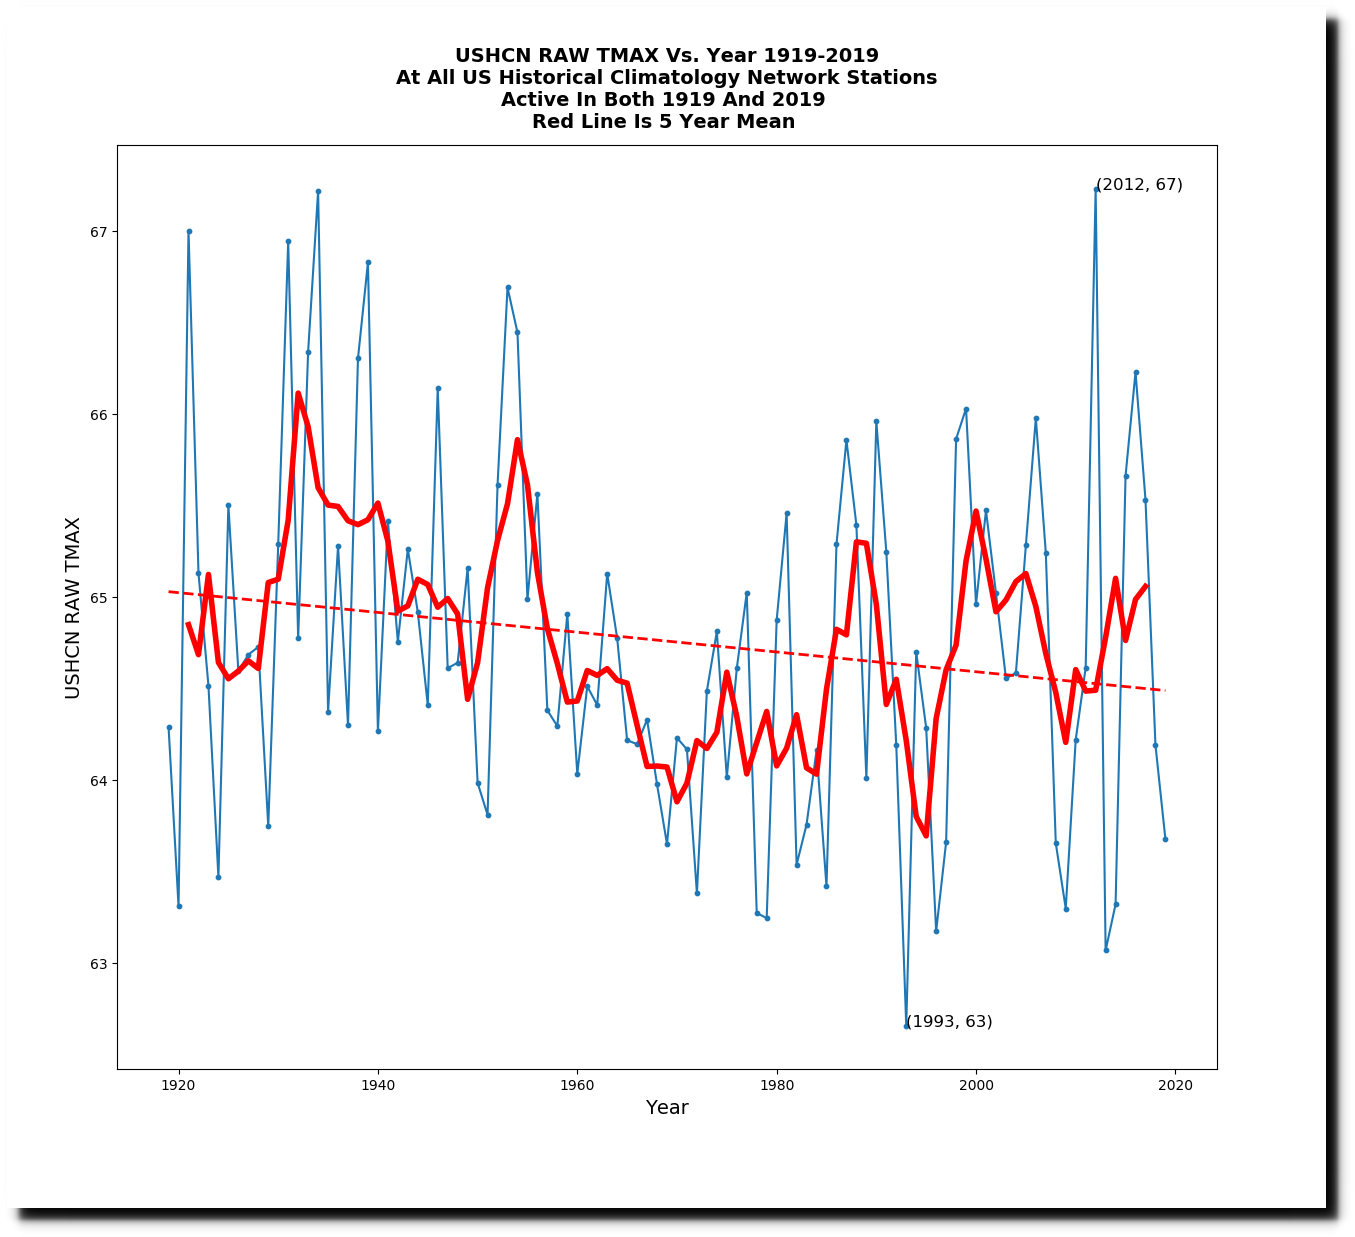
Raw temperatures show a downwards trend over the past century,
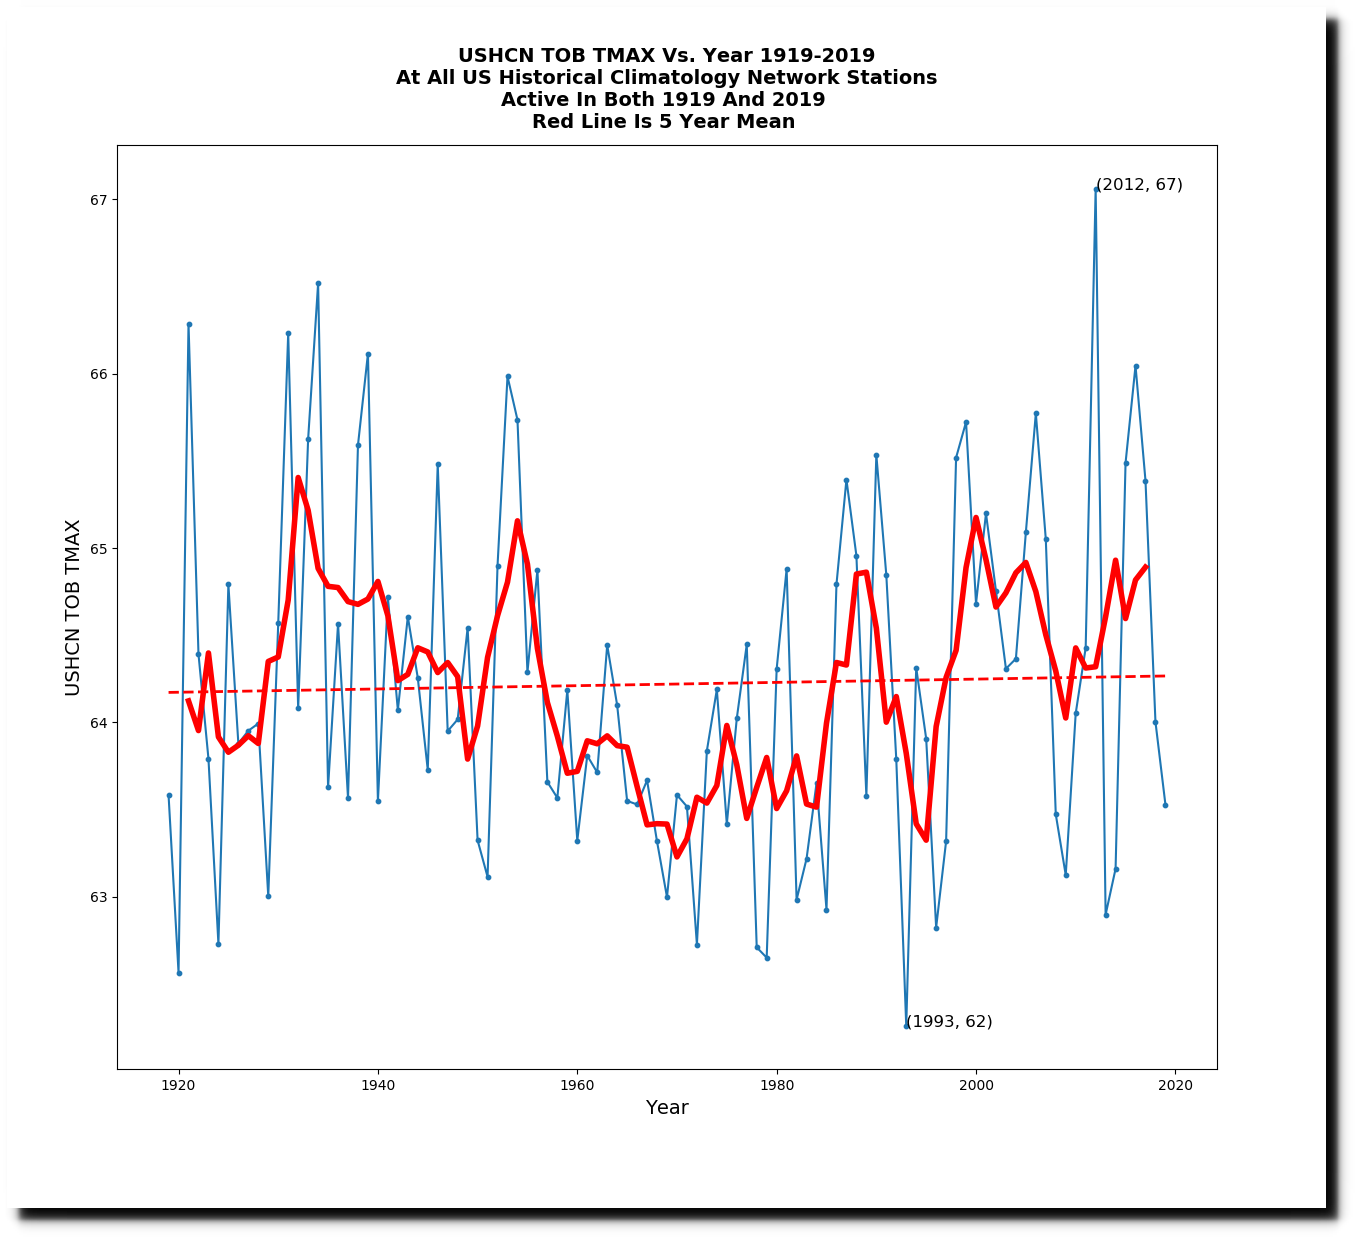
Time of observation bias adjusted shows a slight warming trend.
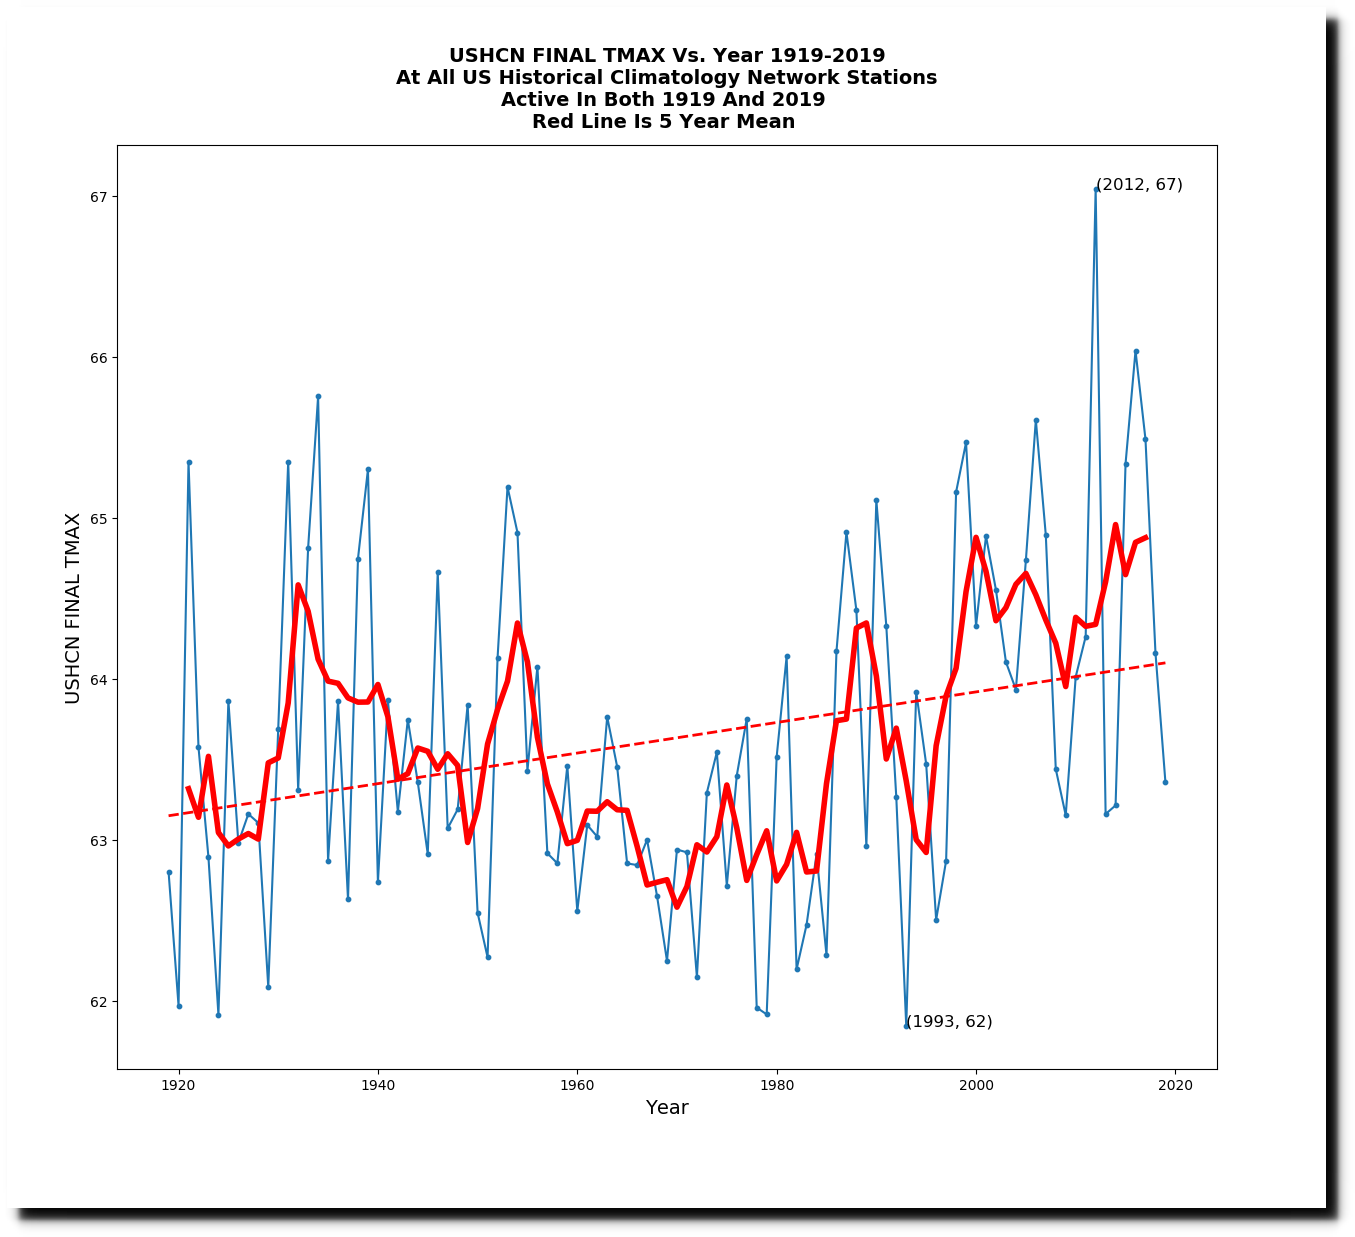
Final adjusted shows a strong warming trend since 1980.
Adjustments form a hockey stick after 1980.

The hockey stick appears in the final adjustment.
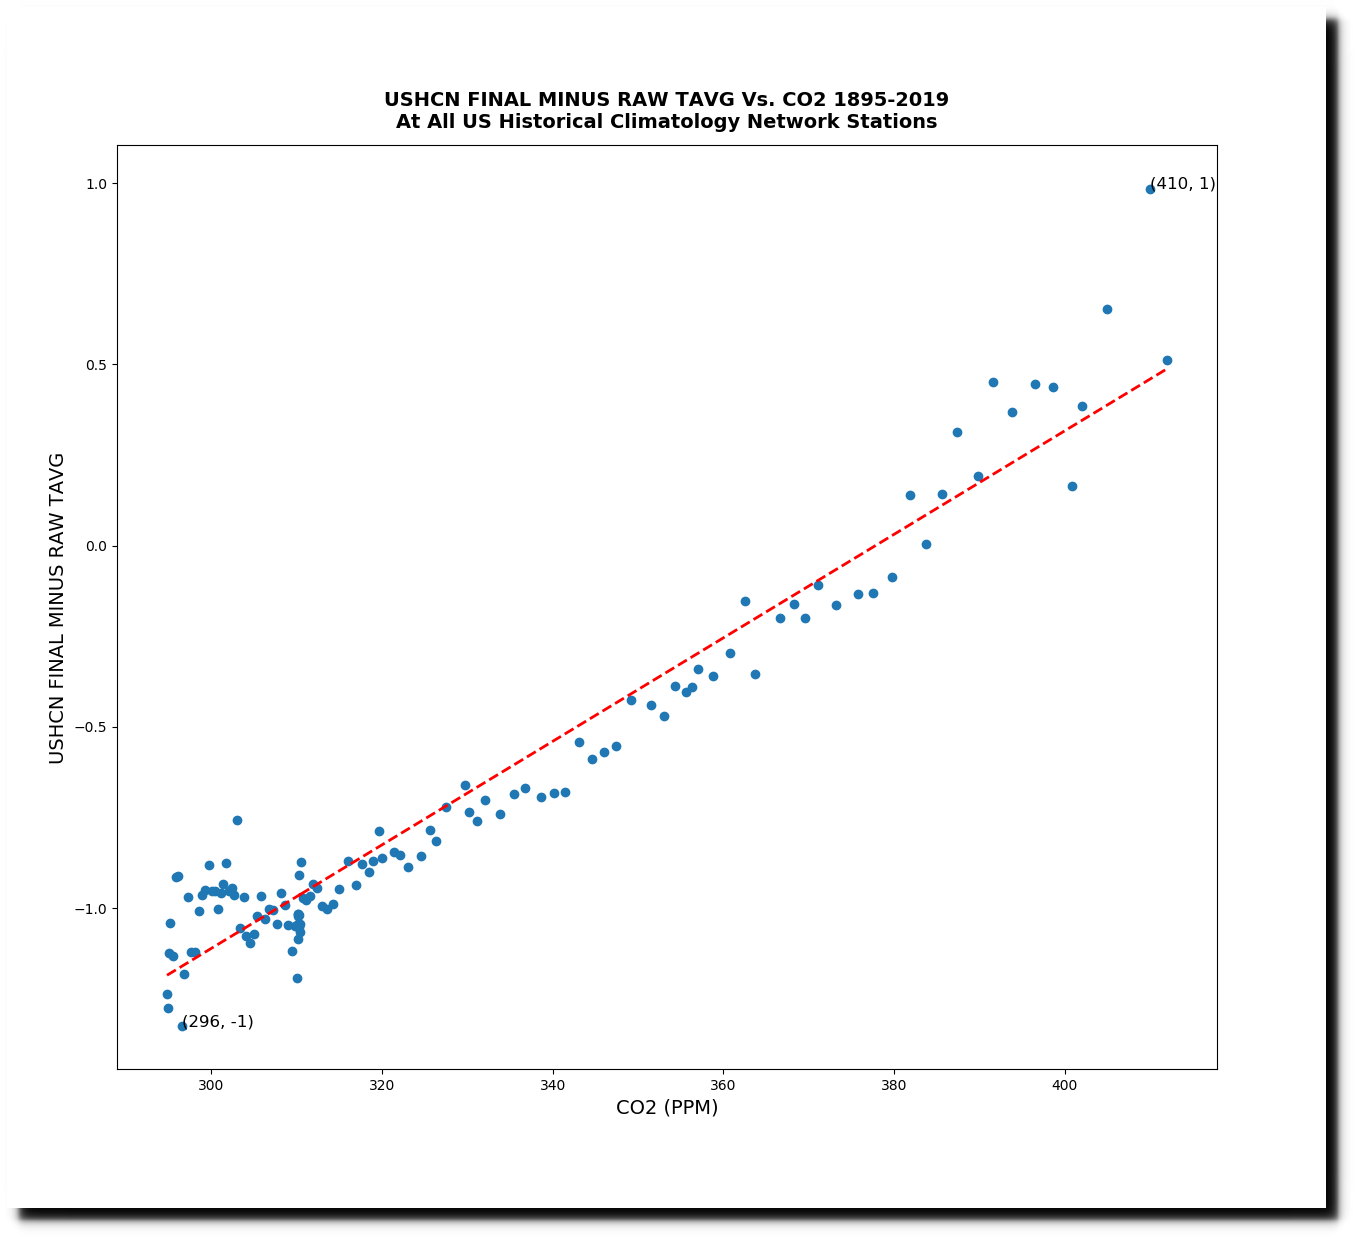
The average temperature adjustments being made very closely match the increase in CO2 over the past century.
The fake post-1980 hockey stick gets carried over into other data sets, like this one which shows a sharp rise in the area of the US with unusually high summer maximum temperatures since 1980.
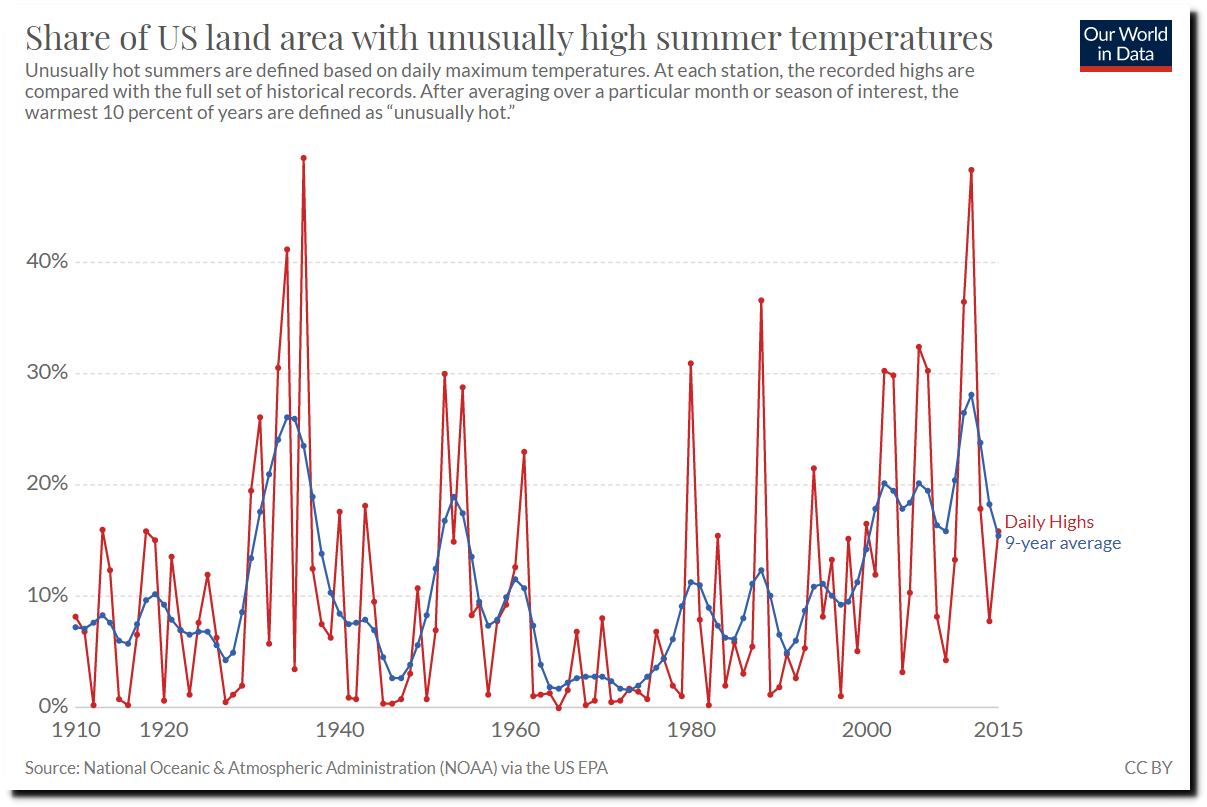
Natural Disasters – Our World in Data
This post-1980 rise doesn’t exist. It is not present in the National Climate Assessment.
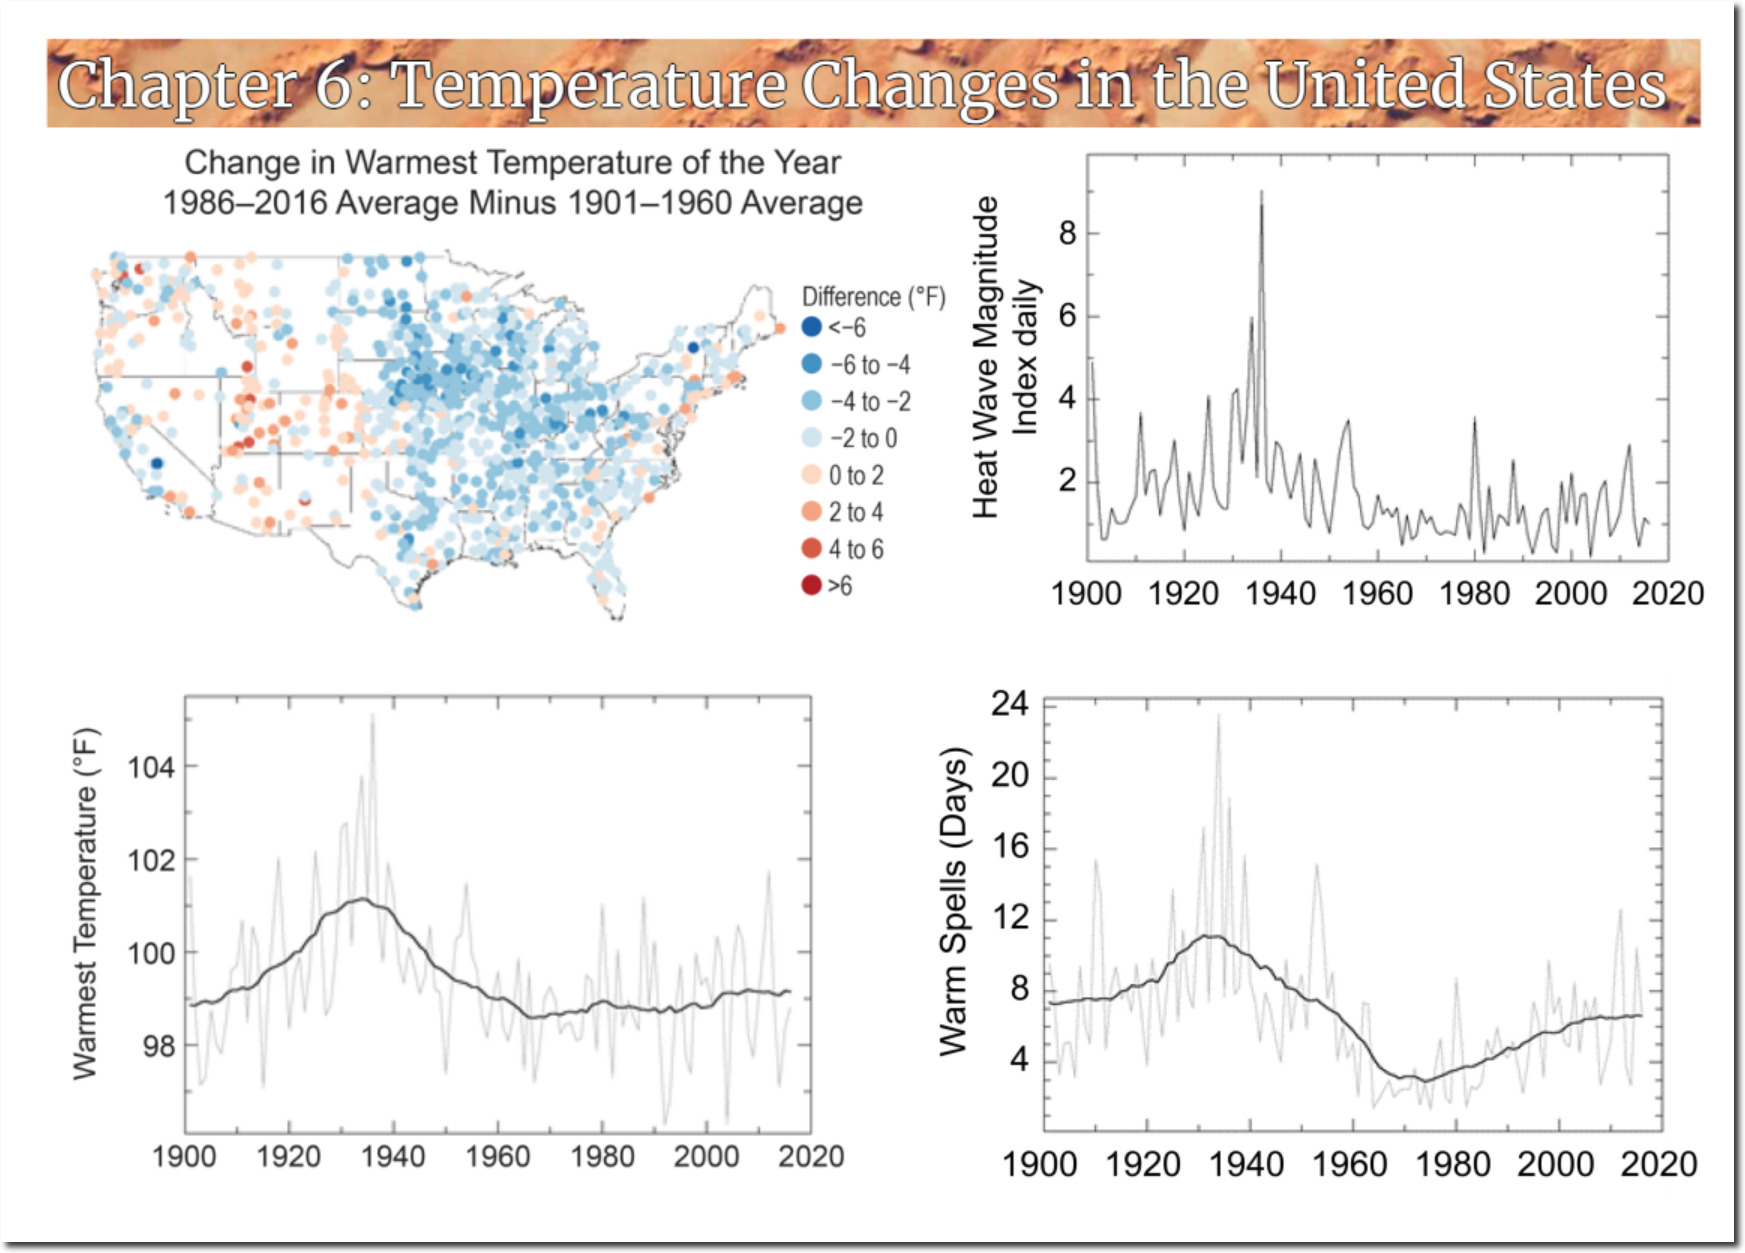
Temperature Changes in the United States – Climate Science Special Report
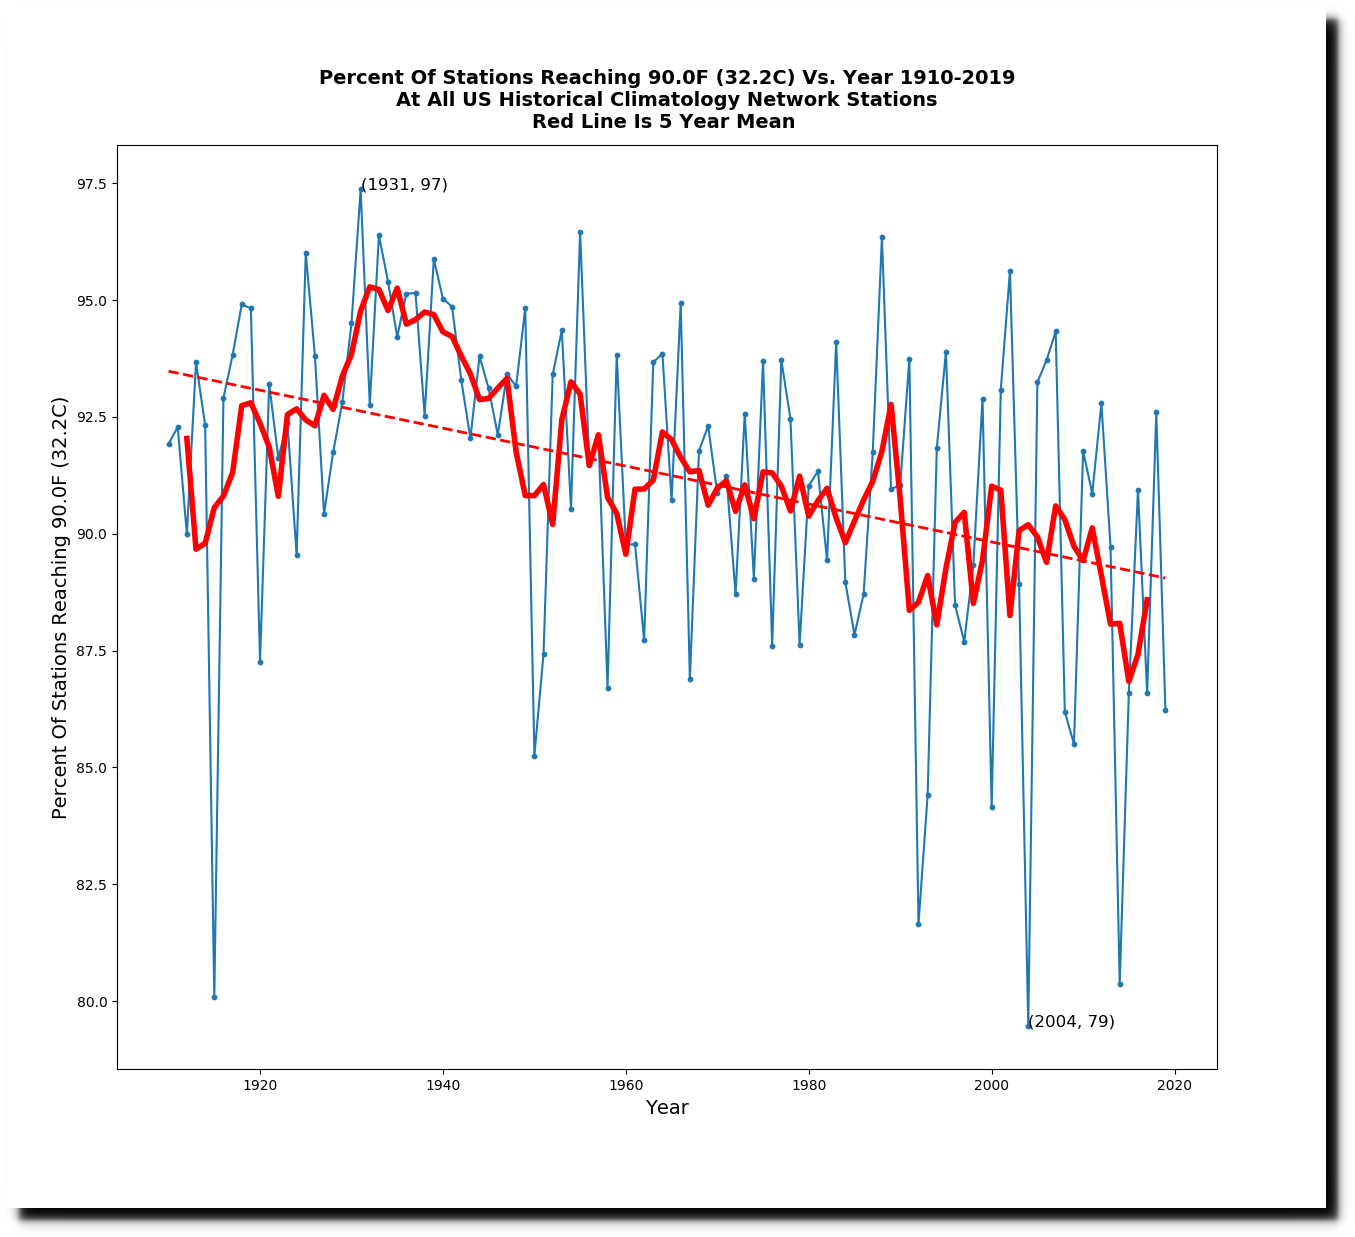
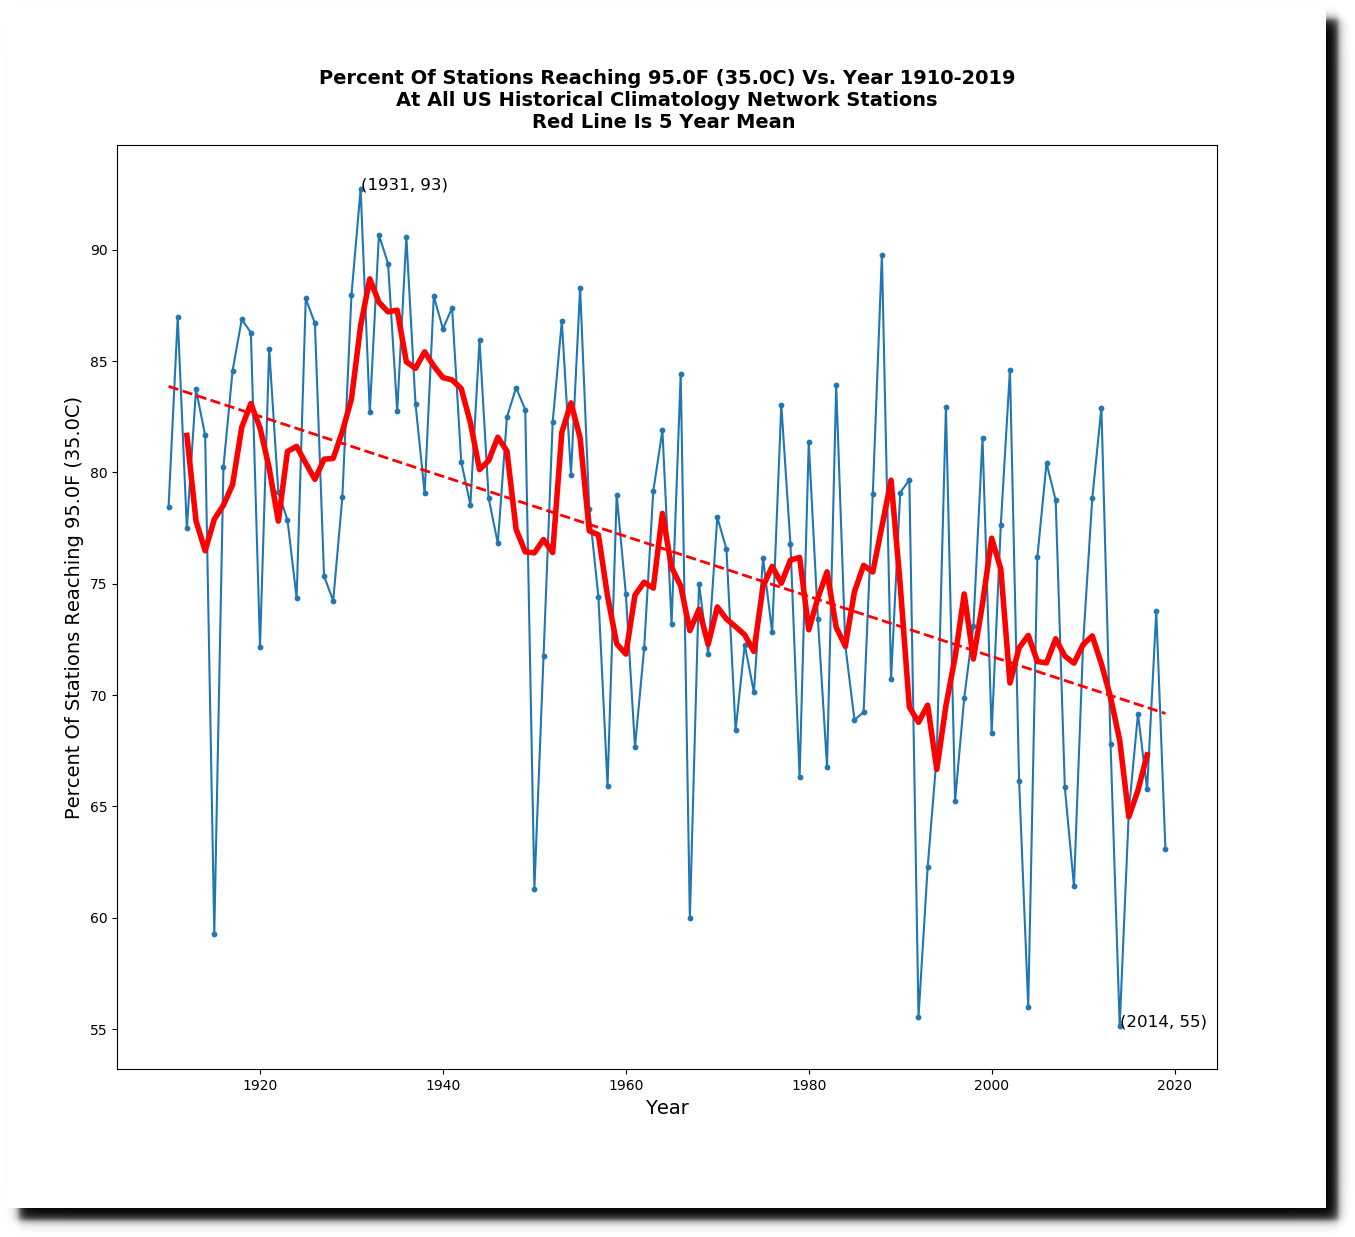
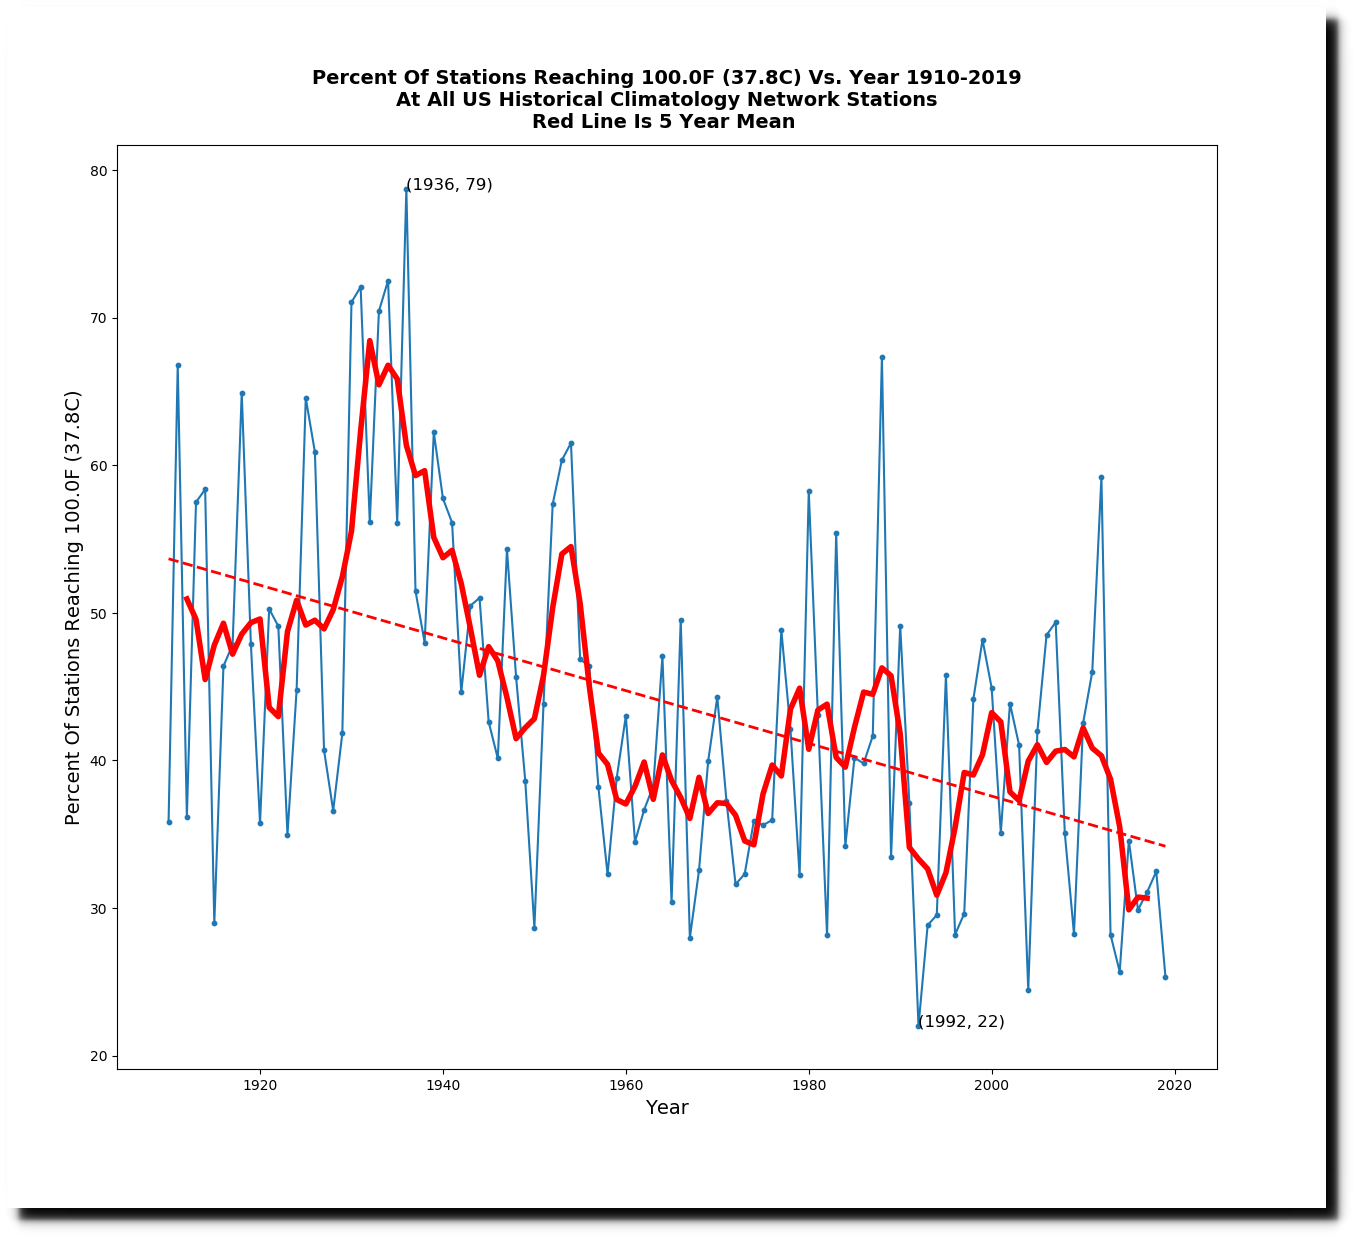
The press refuses to talk to me, and instead talks to fraudster John Cook, who tells them there is no data tampering and there are no Urban Heat Island effects. Cook says “independent” data sets from different agencies proves that the data is good.
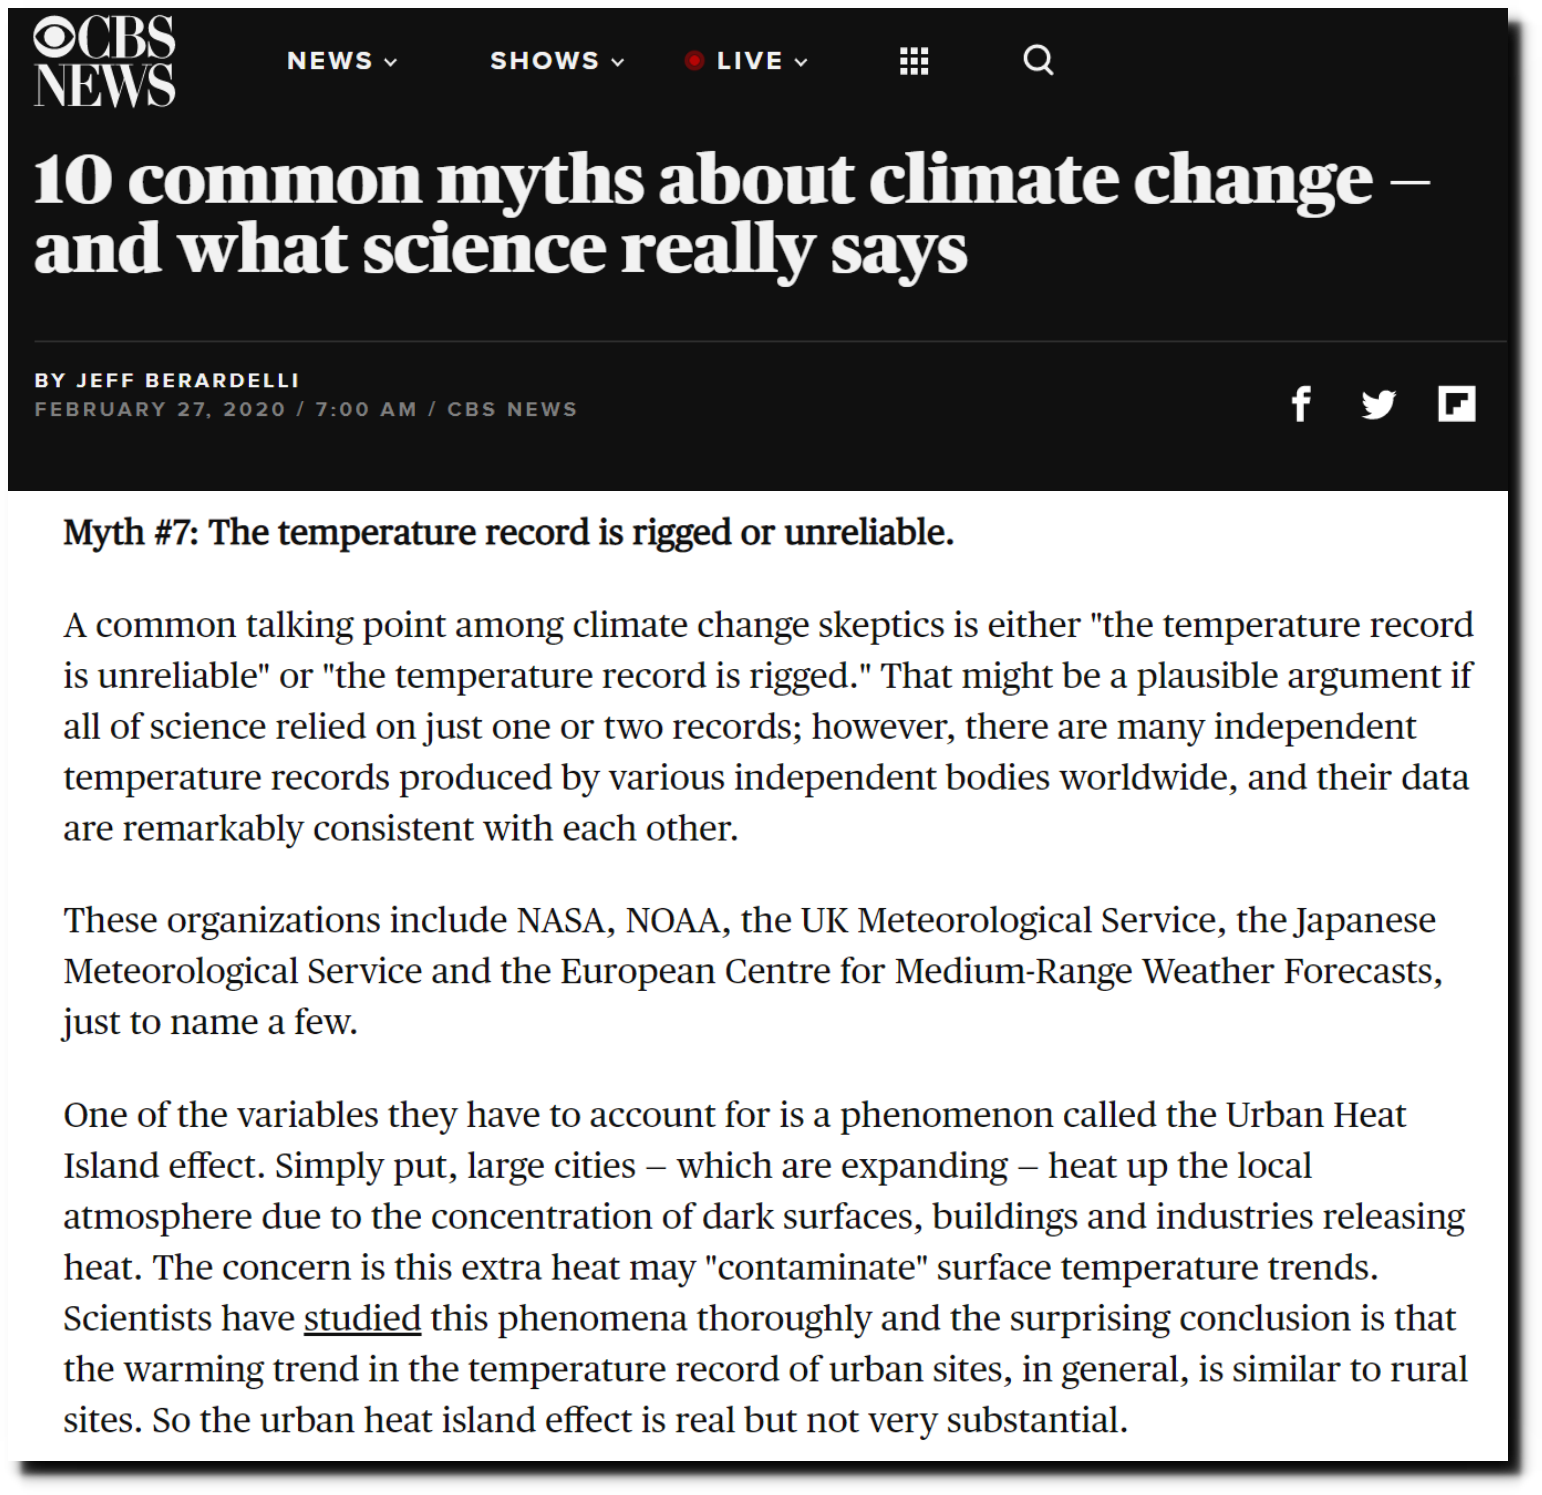
Climate change: 10 common myths – and what science really says – CBS News
In 1989. Tom Karl and Phil Jones said UHI was huge.
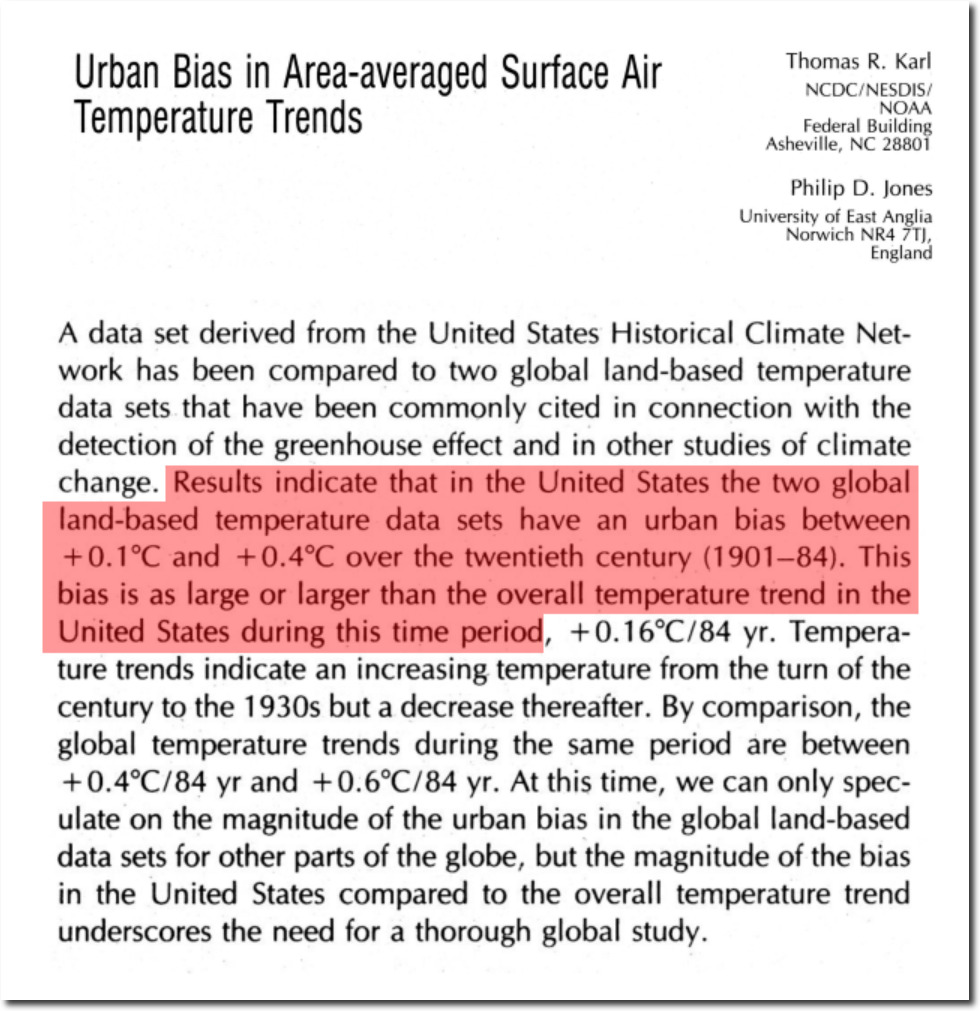
1520-0477(1989)070<0265:UBIAAS>2.0.CO;2
Different government agencies colluded to tamper with data.
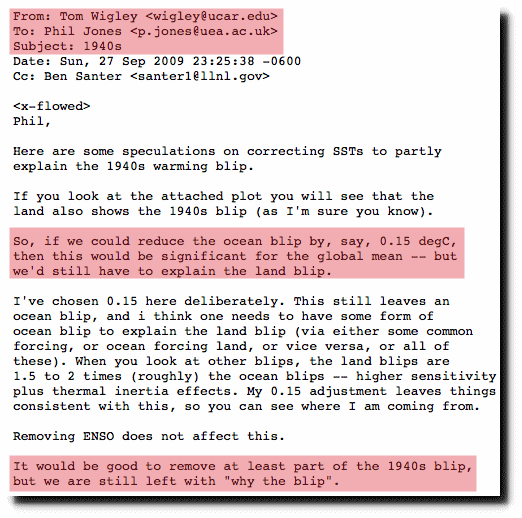
di2.nu/foia/1254108338.txt
And when Senator Roberts from Australia queried NASA about obvious fraud in the Icelandic temperature record, Gavin Schmidt responded by blaming it on NOAA and saying it wasn’t his data.
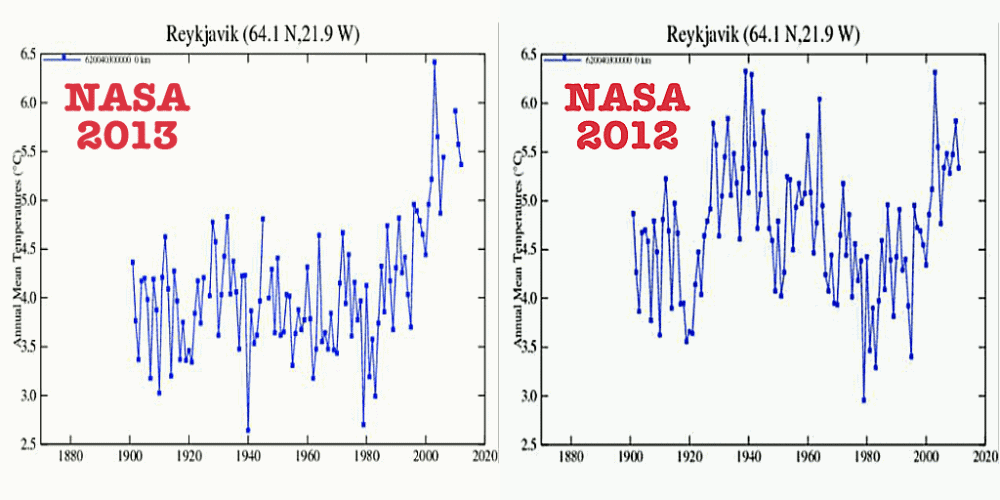
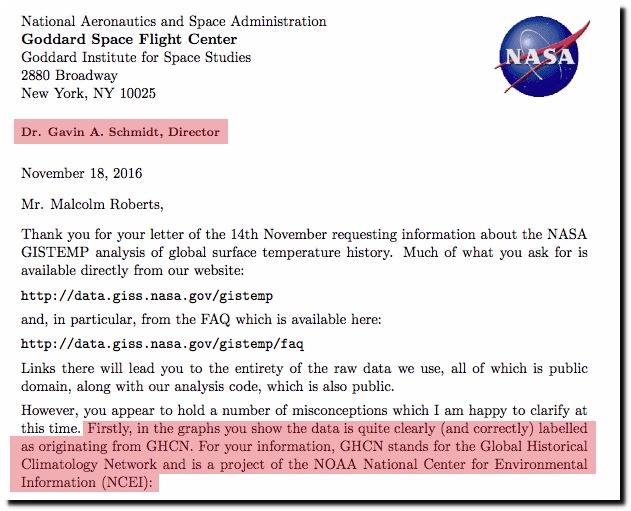
robertsnasags.pdf
A small handful of people are pulling off a massive fraud, and because the press refuses to talk to scientists with accurate information, the public suffers.
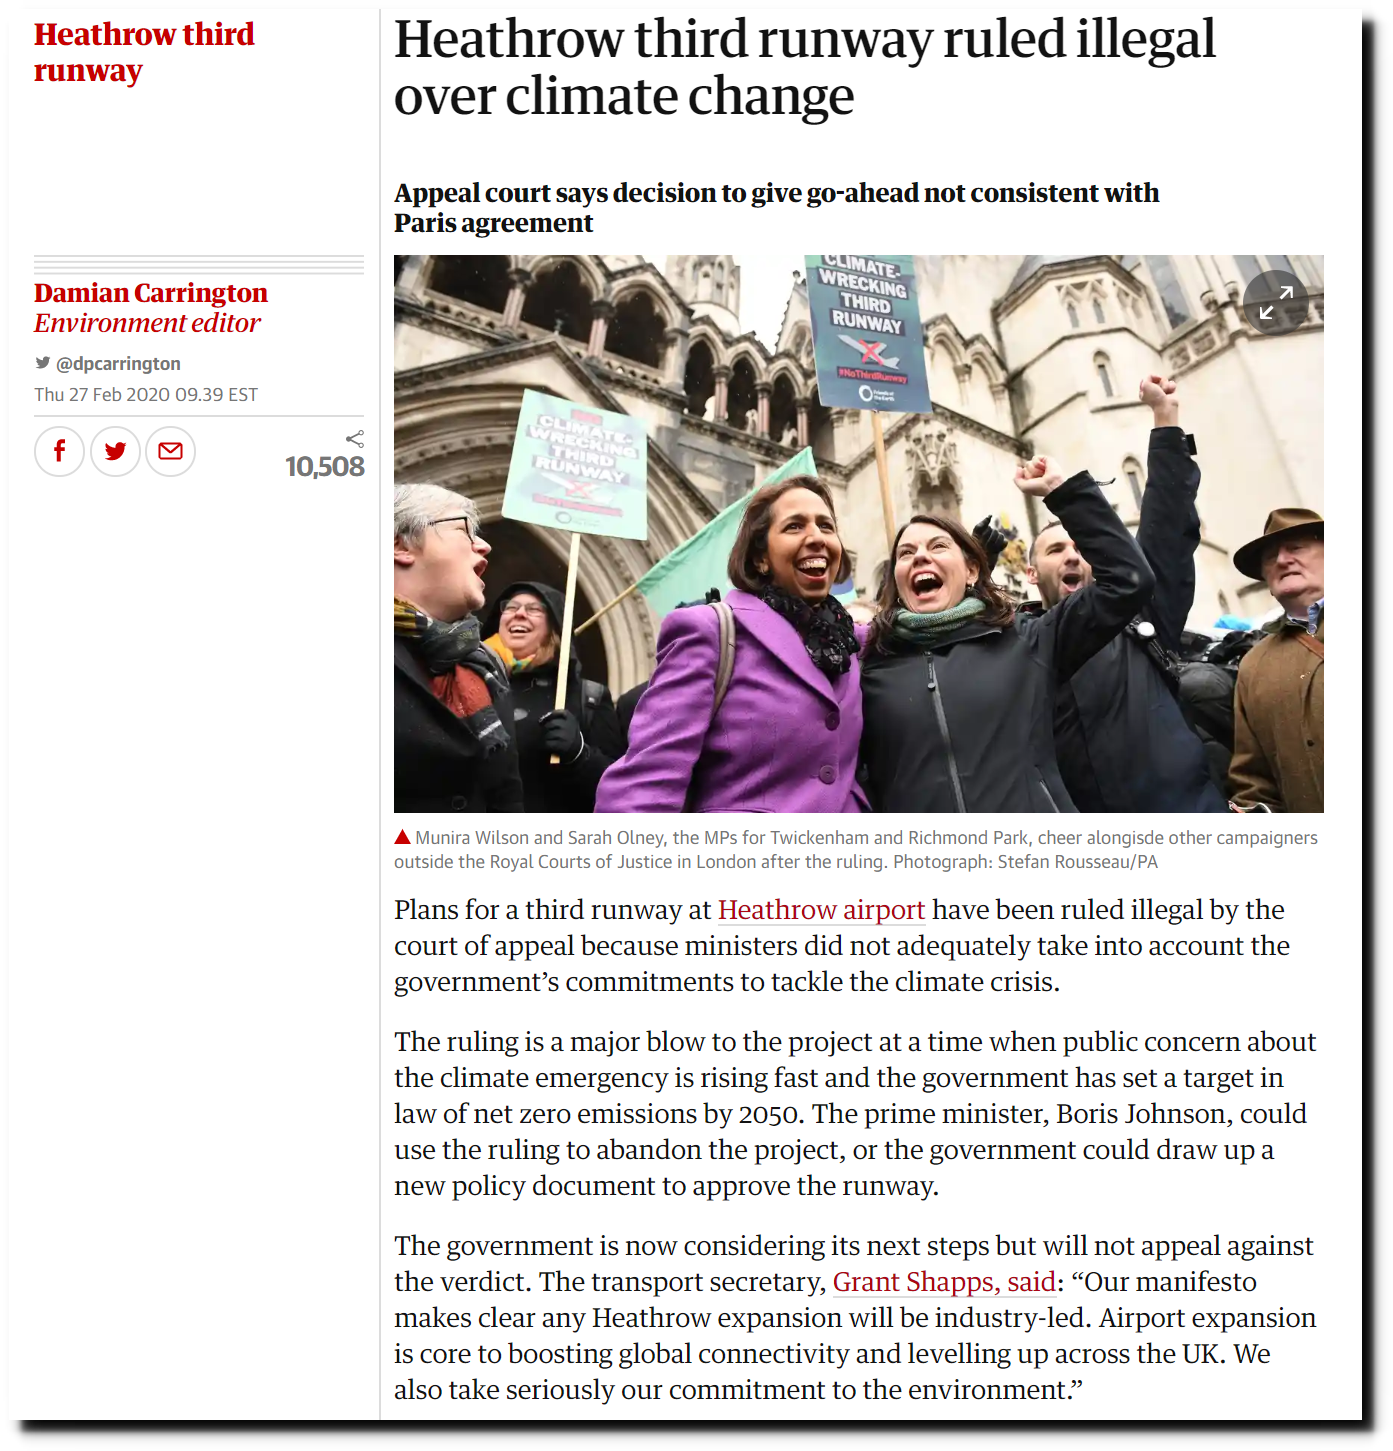
Heathrow third runway ruled illegal over climate change | Environment | The Guardian