Another Possible Cause Of Global Warming

I was working in a computer shop in Sedona, Arizona during the Spring of 1989.

A woman walked in and told me her computer was broken because she lived too close to an energy vortex, and it was affecting the crystal in her computer. So I told her she probably would have to move.

Posted in Uncategorized | Leave a comment

Because – Climate Science

Posted in Uncategorized | Leave a comment

World To End In 12 Years

Posted in Uncategorized | Leave a comment

Arctic Sea Ice Continues To Grow

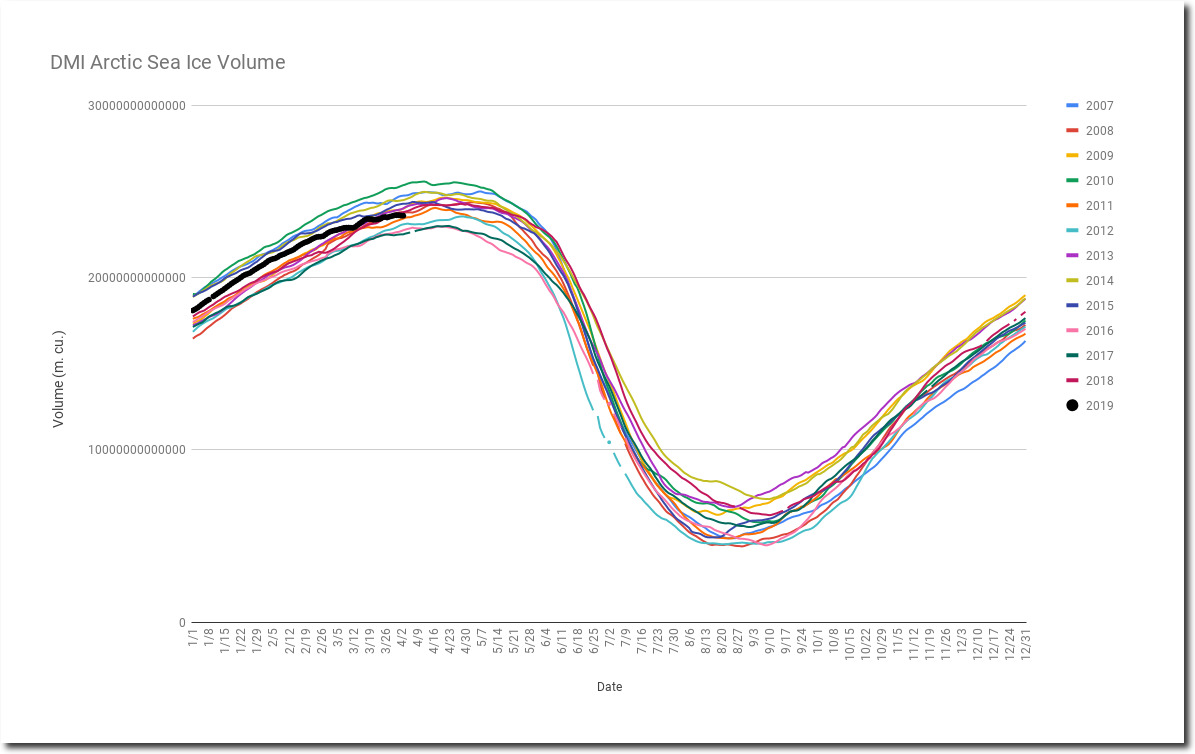
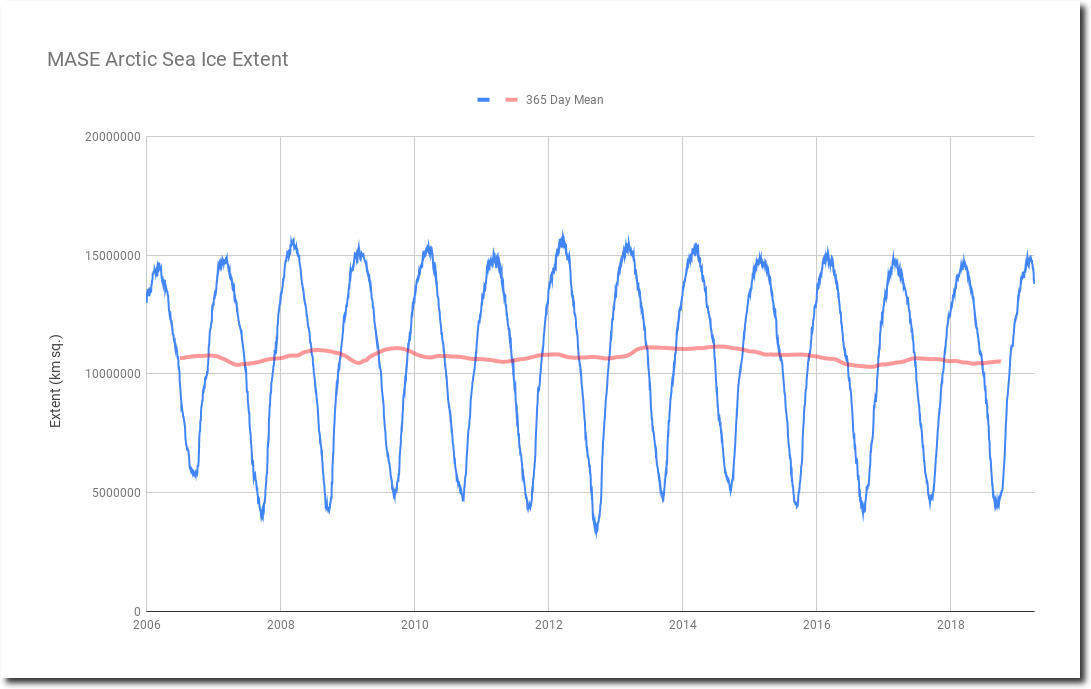
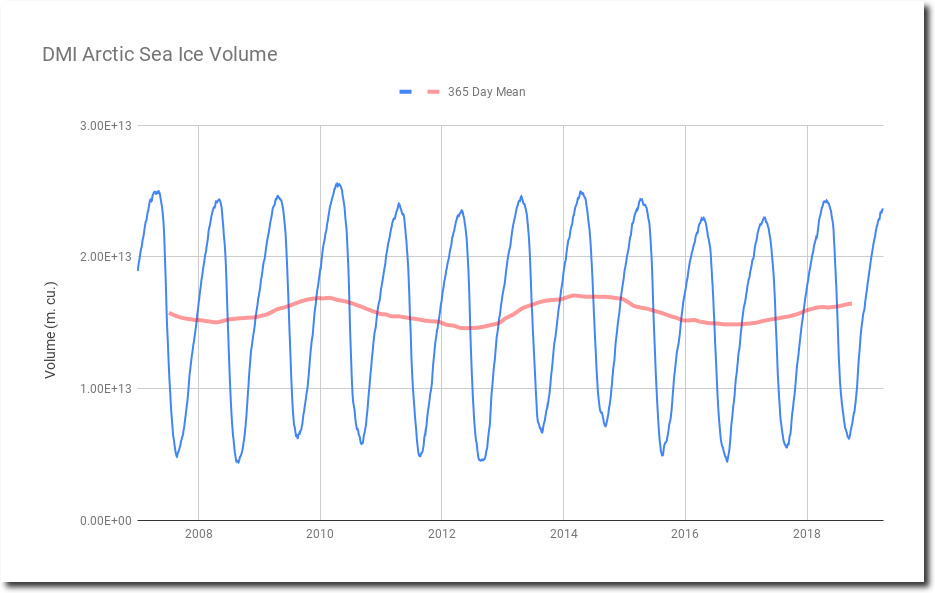
The volume of Arctic sea ice is very close to the median over the past 12 years, and continues to grow.

There has been no trend in Arctic sea ice extent or volume over the past twelve years.

Spreadsheet

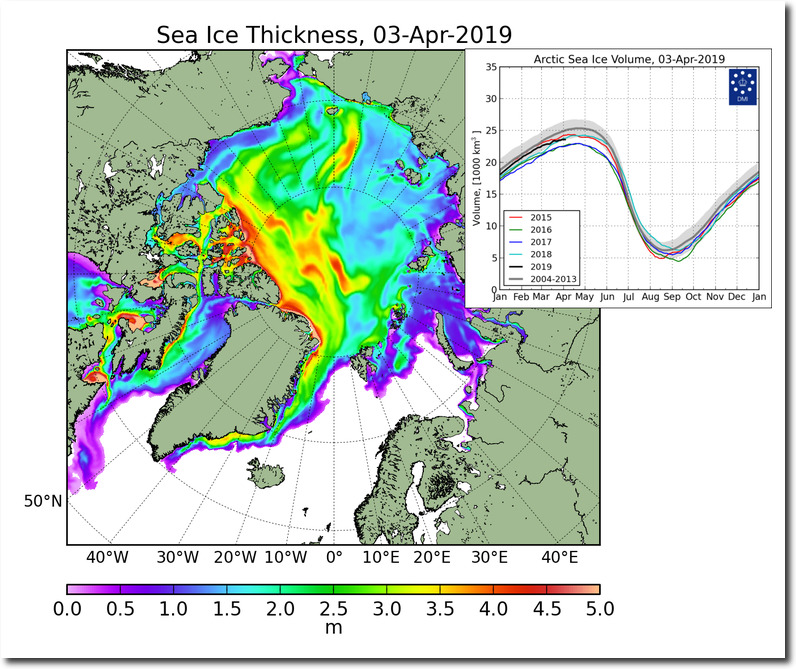
The Northwest Passage is blocked with the thickest ice in years.

DMI Modelled ice thickness

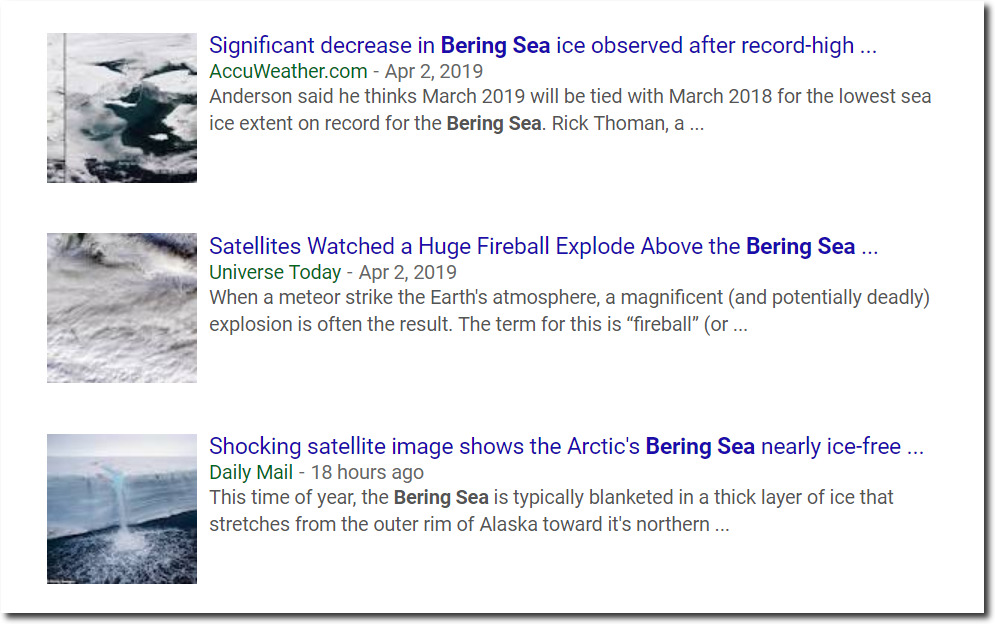
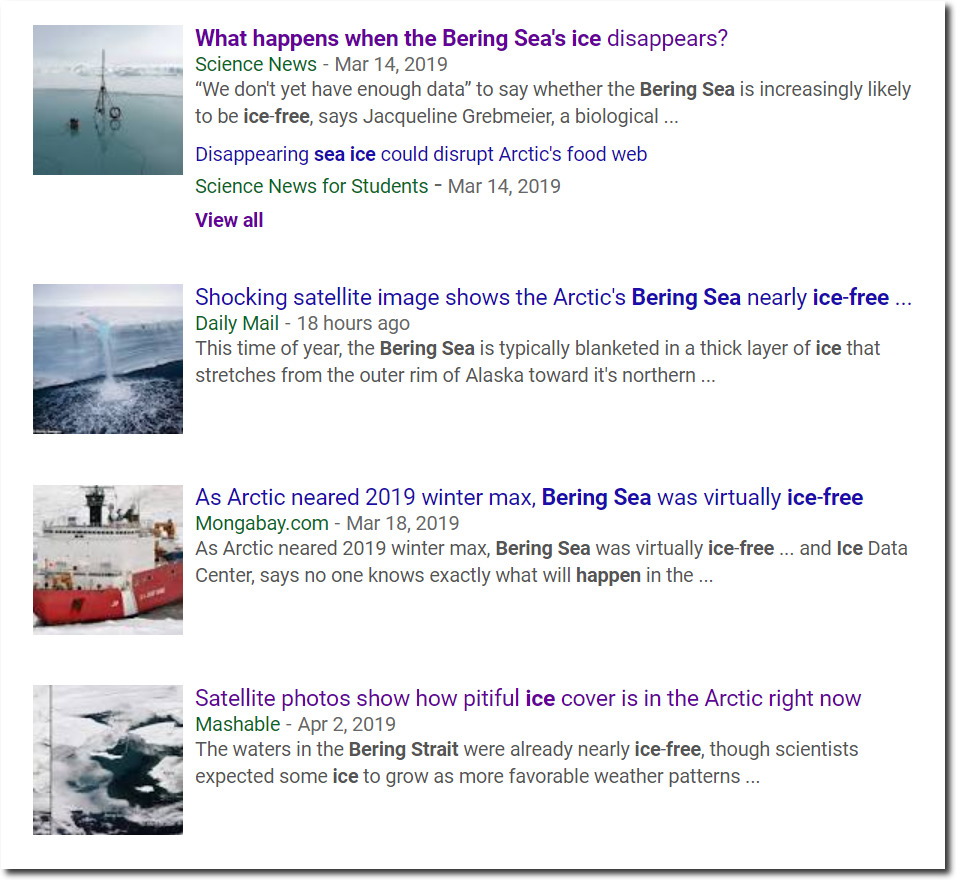
Last year, Arctic ambulance chasers were focused on the “ice hole in the Barents Sea.”  But there is lots of ice in the Barents Sea, so they have moved their clown show to the Bering Sea.

Science News asks “what happens when the Bering Sea becomes ice-free?”

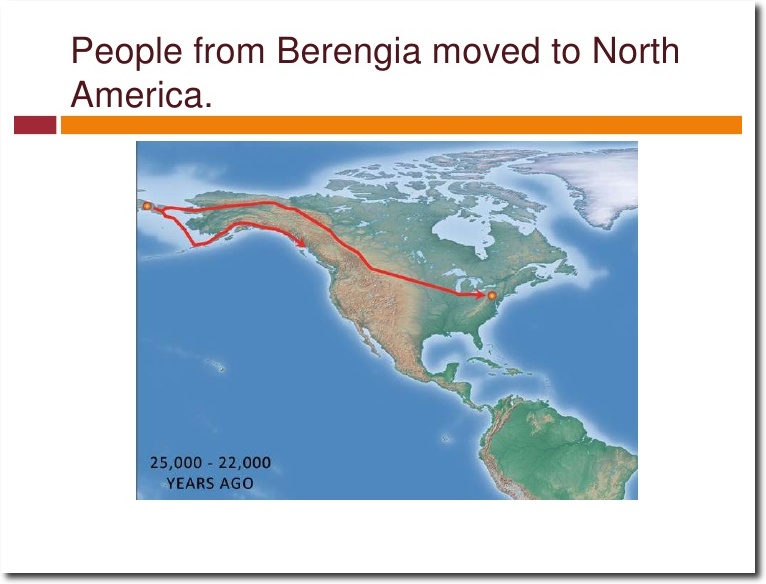
The Bering Sea loses its ice every spring. Perhaps they can use the last few hundred thousand years for reference? There was no ice (or water) in the Bering Sea when the first humans moved to America 25,000 years ago – during the last ice age.

How did the first americans get here

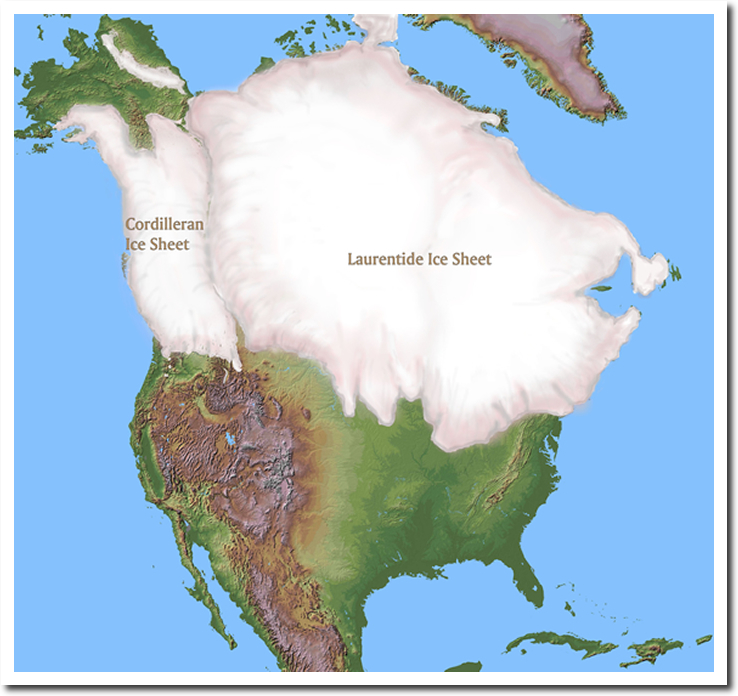
Alaska was largely ice-free during the last ice age, for the same reason Bering Sea ice is low this year.  During ice ages, the jet stream brings mild air to Alaska, and cold air to Canada and much of the US.

Ice Age Maps, Ice Age Maps, London

The last thing I would ever expect climate researchers to do, is engage in actual scientific research. It just doesn’t seem to happen.

Posted in Uncategorized | Leave a comment

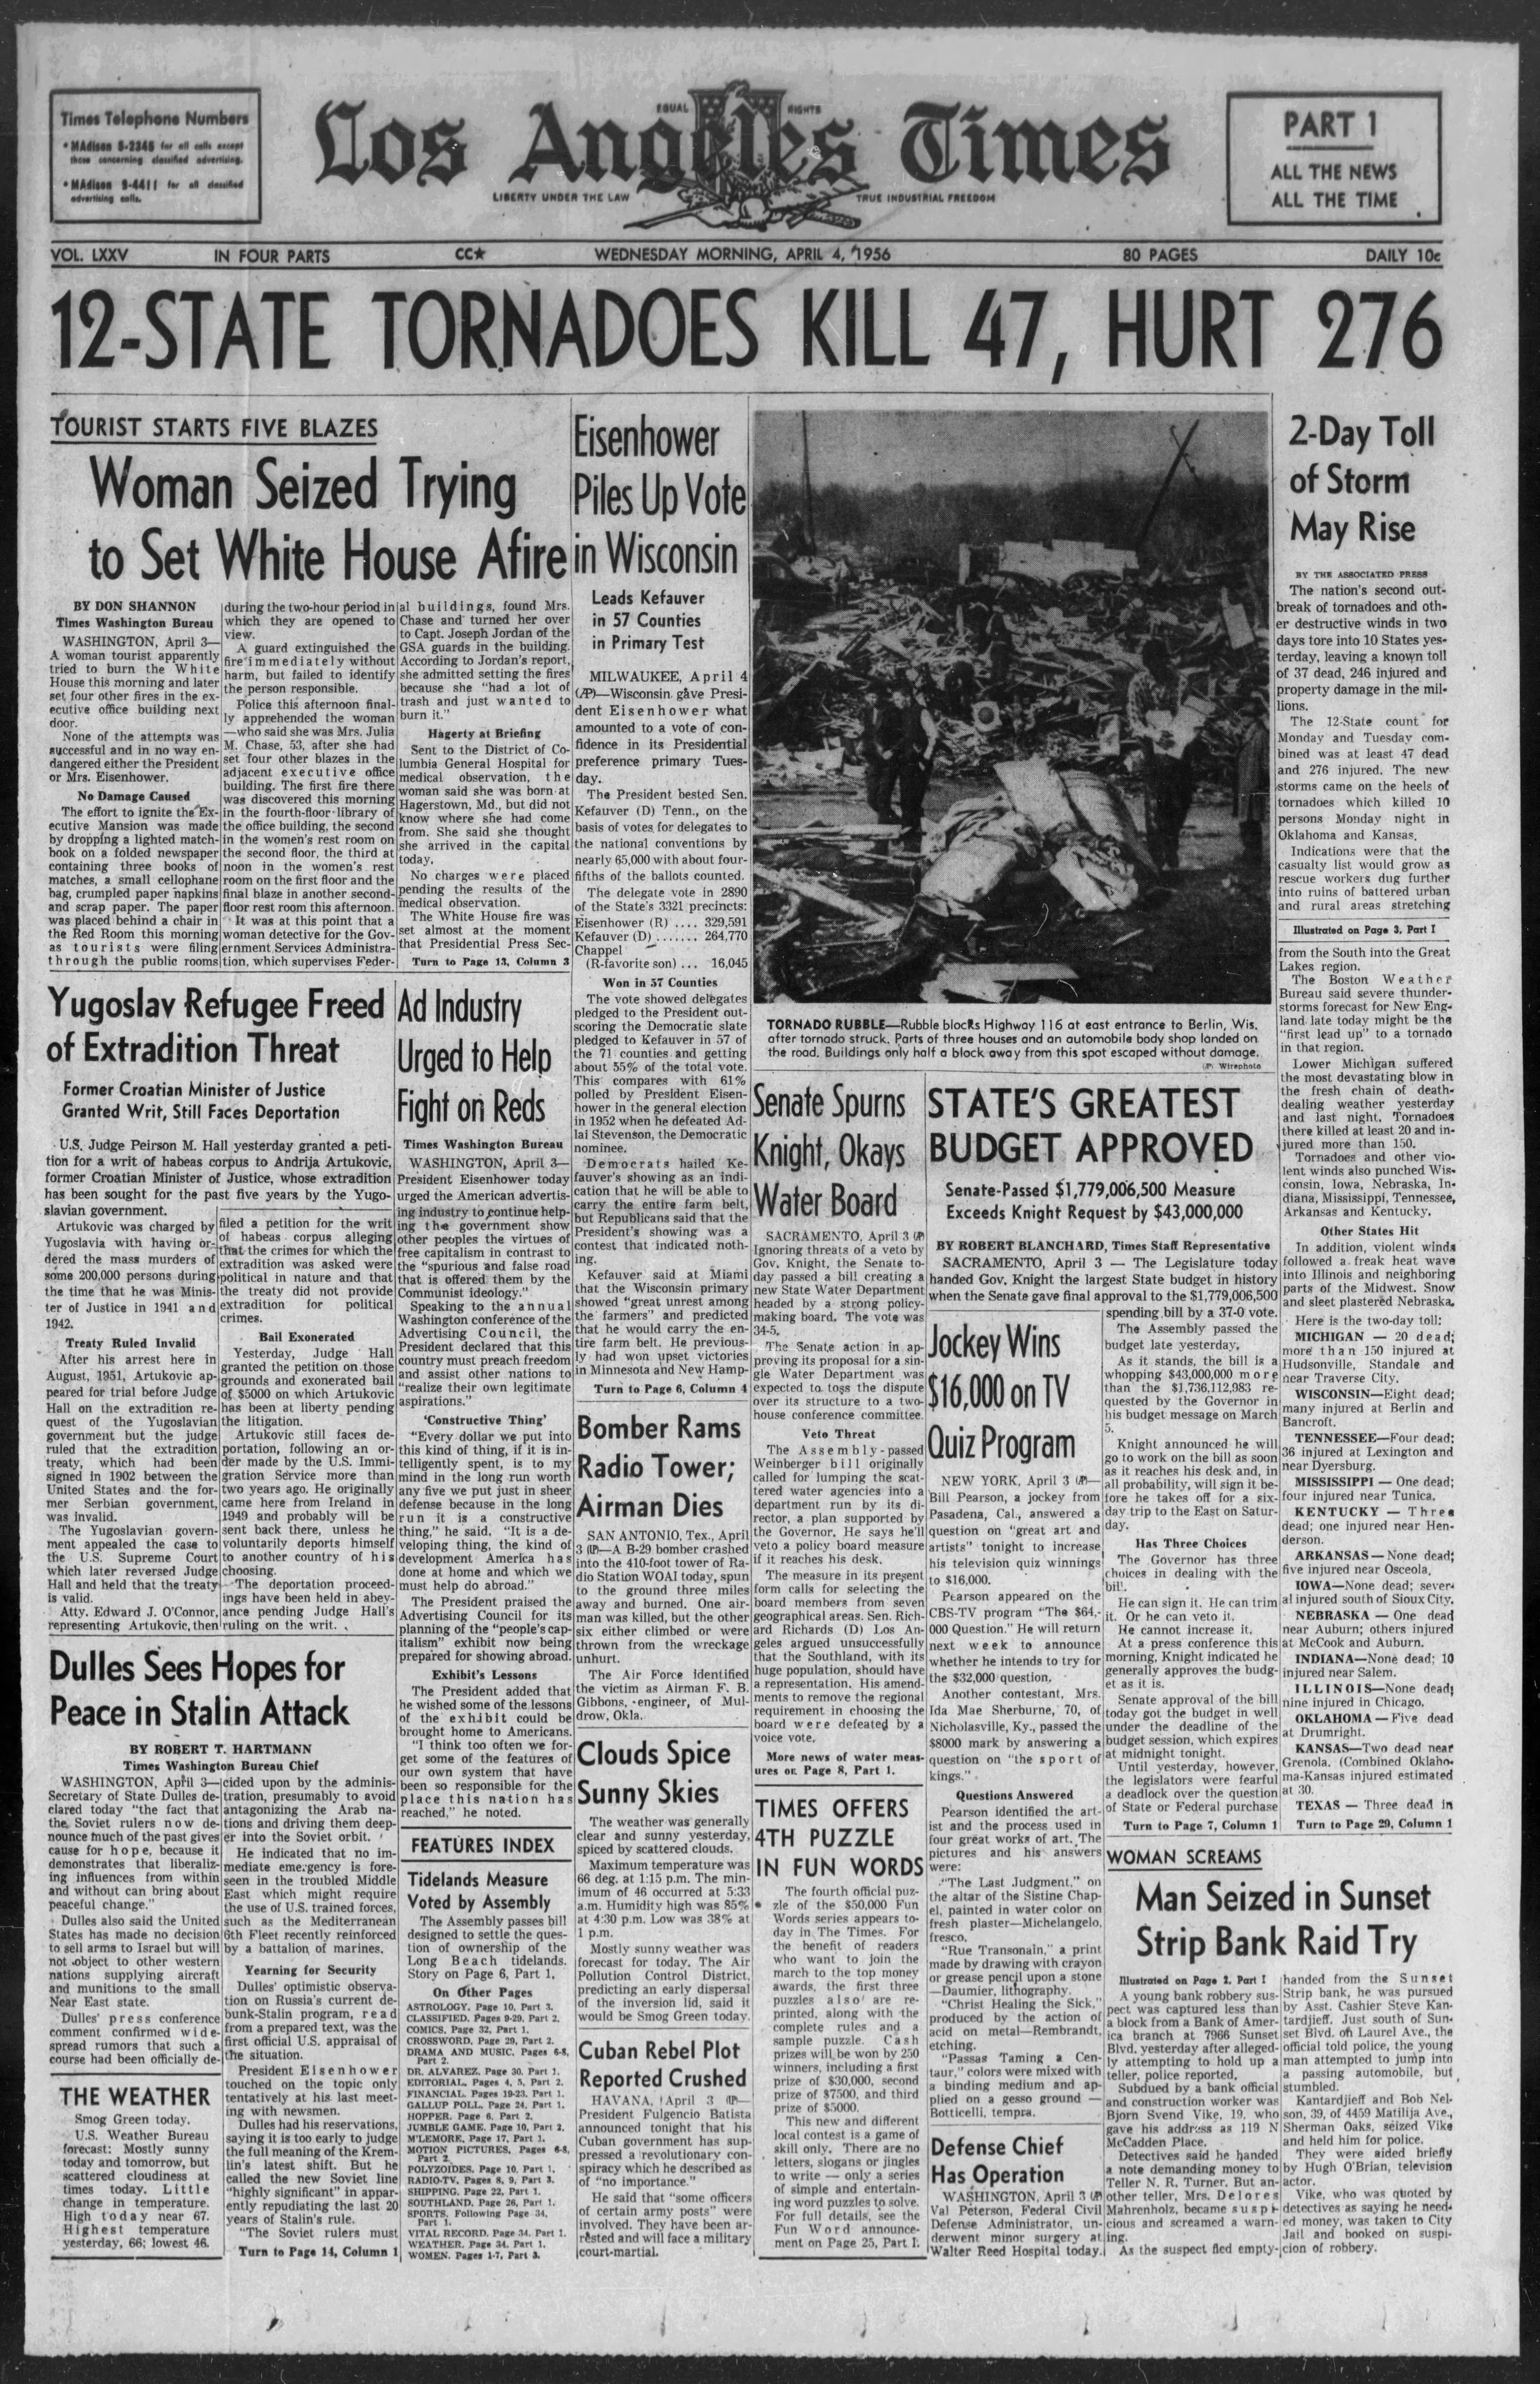
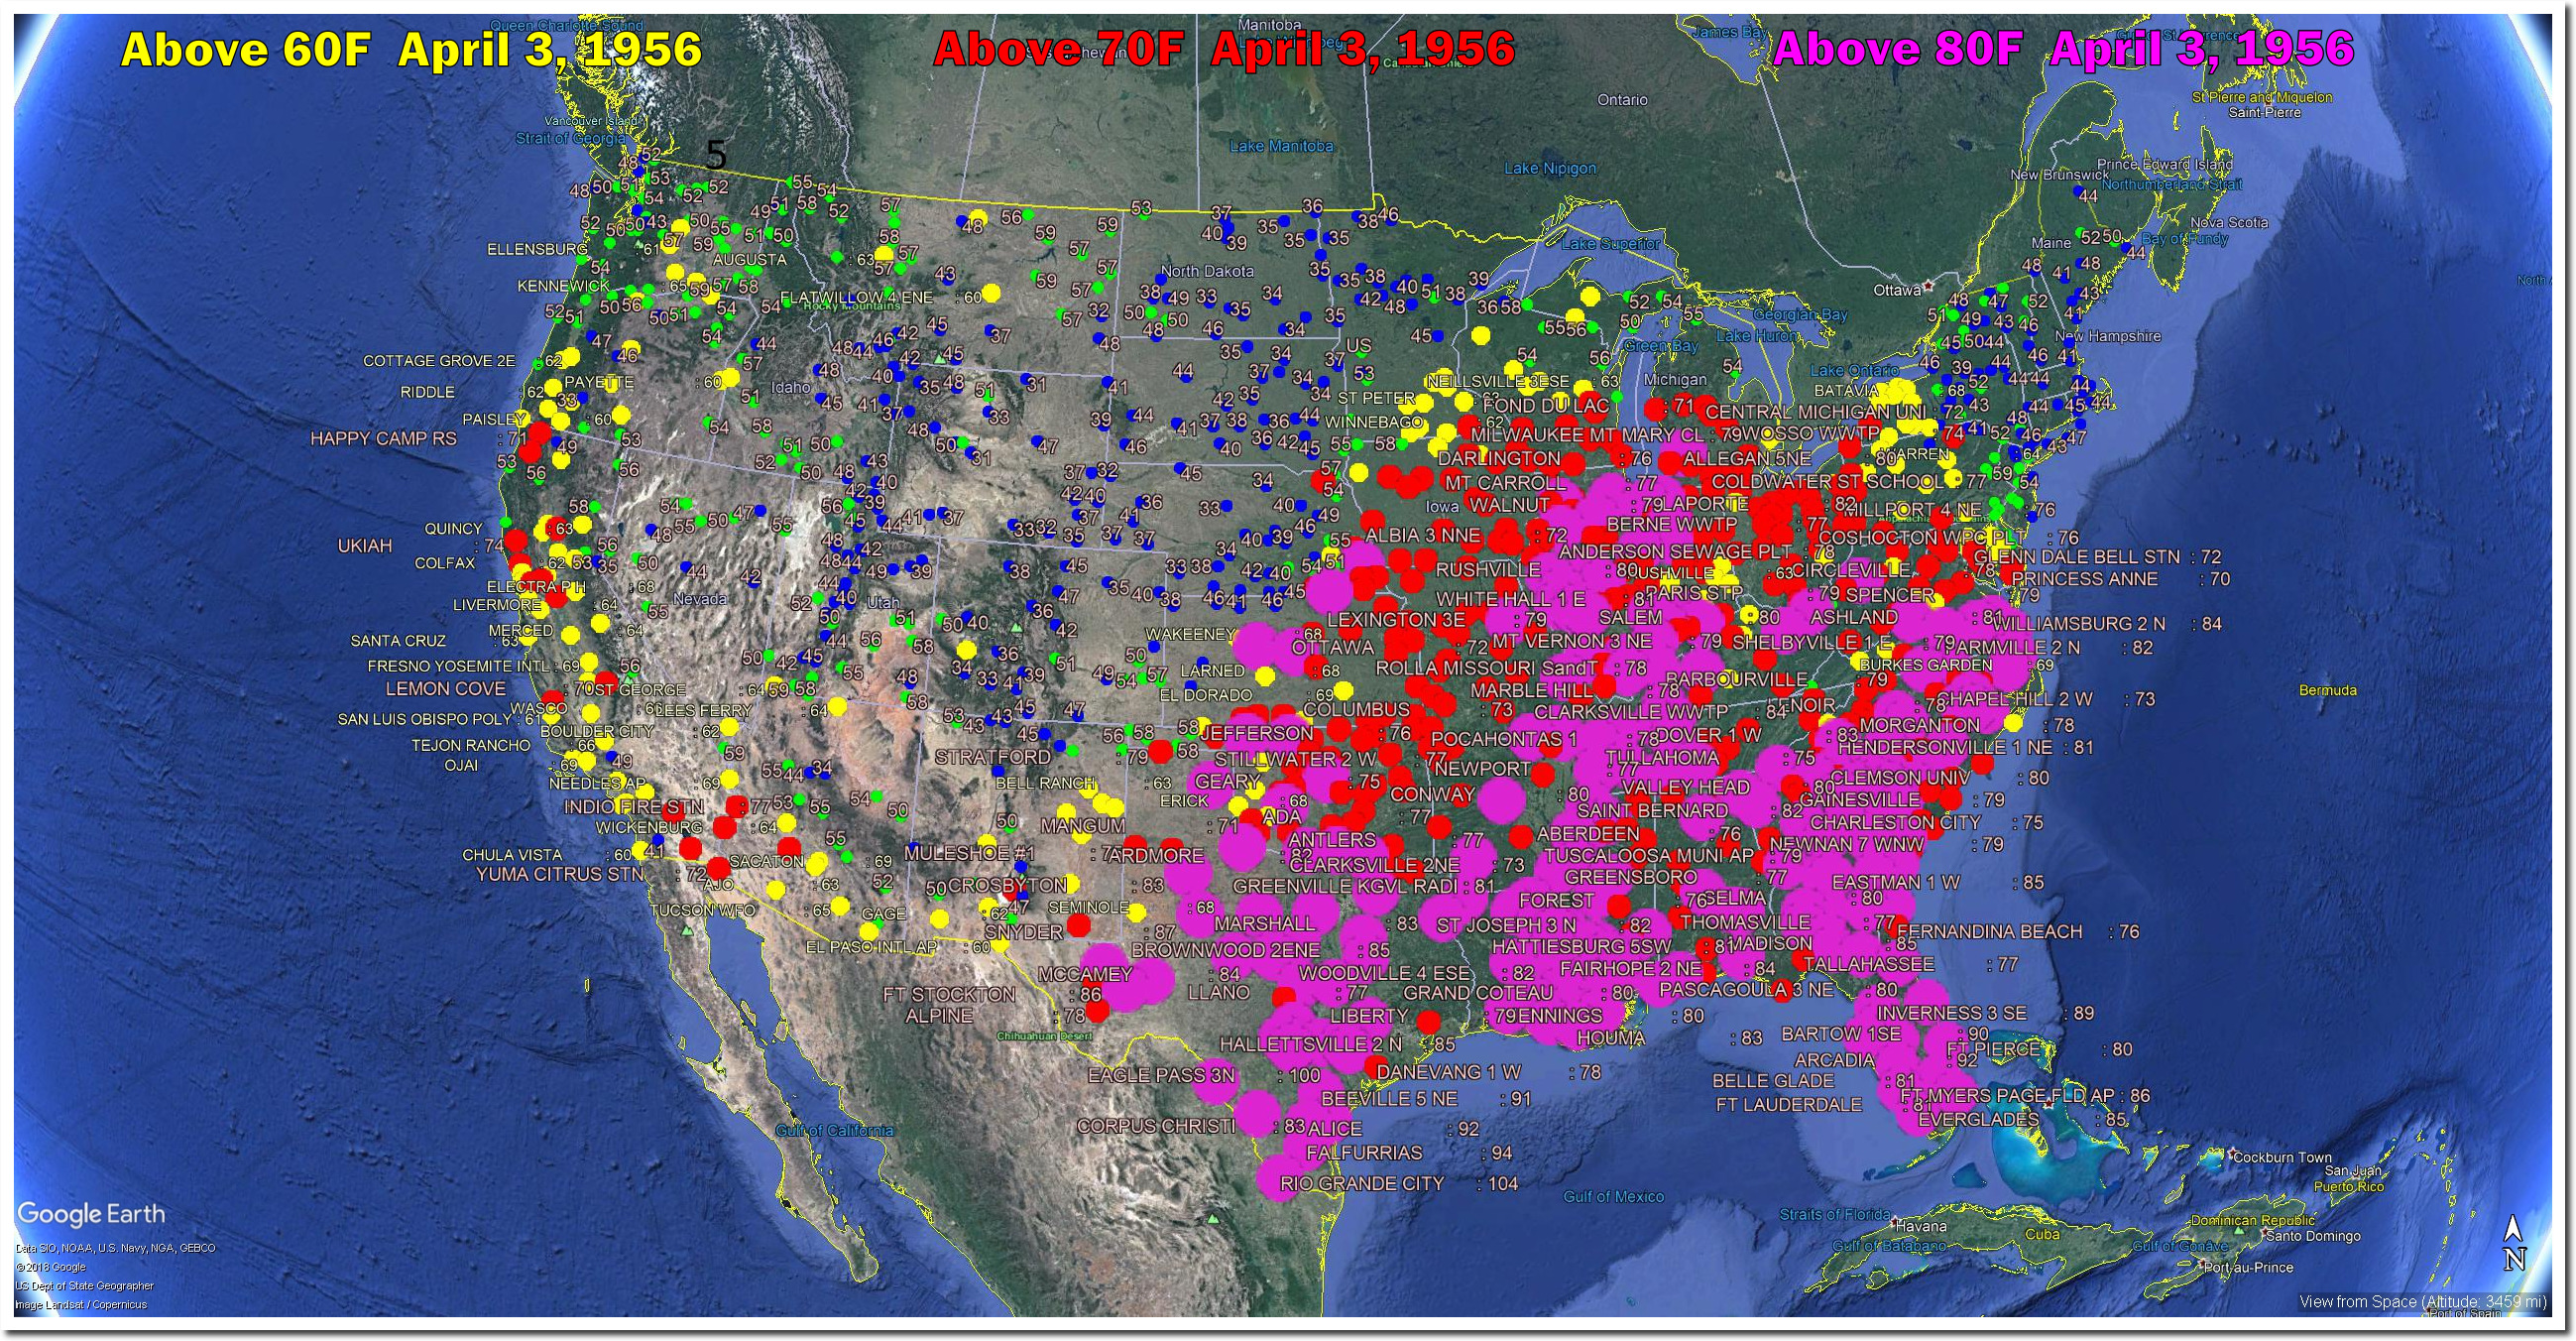
April 3, 1956 Twelve State Tornado Outbreak

The last EF-5 tornado to hit Michigan occurred 63 years ago today.

04 Apr 1956, Page 1 – Detroit Free Press at Newspapers.com

04 Apr 1956, 1 – The Los Angeles Times at Newspapers.com

Posted in Uncategorized | Leave a comment

Perfect Data Tampering

“With four parameters you can fit an elephant to a curve; with five you can make him wiggle his trunk”

– John von Neumann

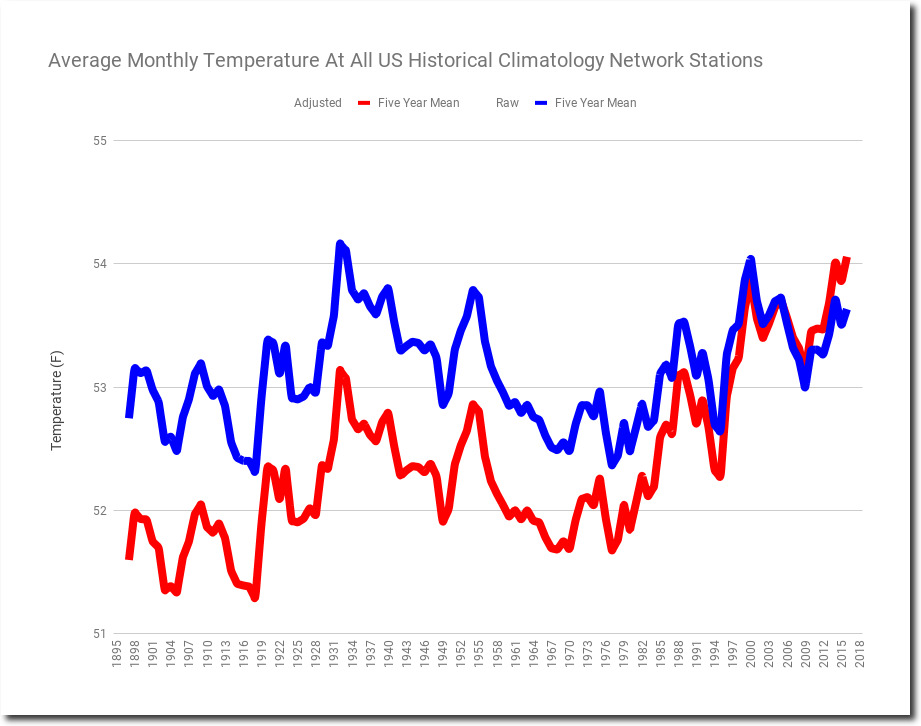
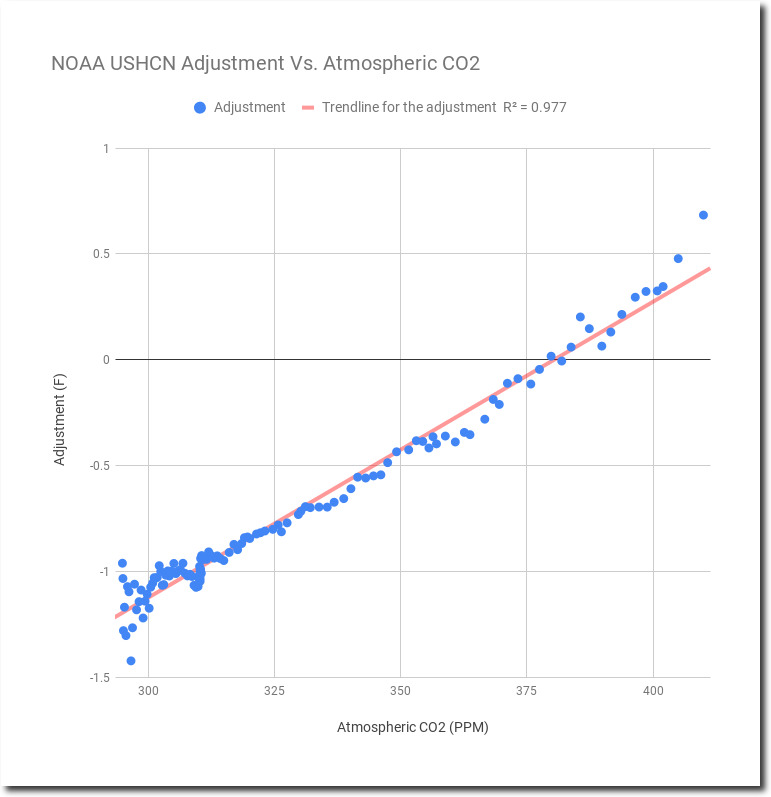
Measured US temperature data provides no evidence of warming over the past century, so NOAA alters the data to create the appearance of warming.

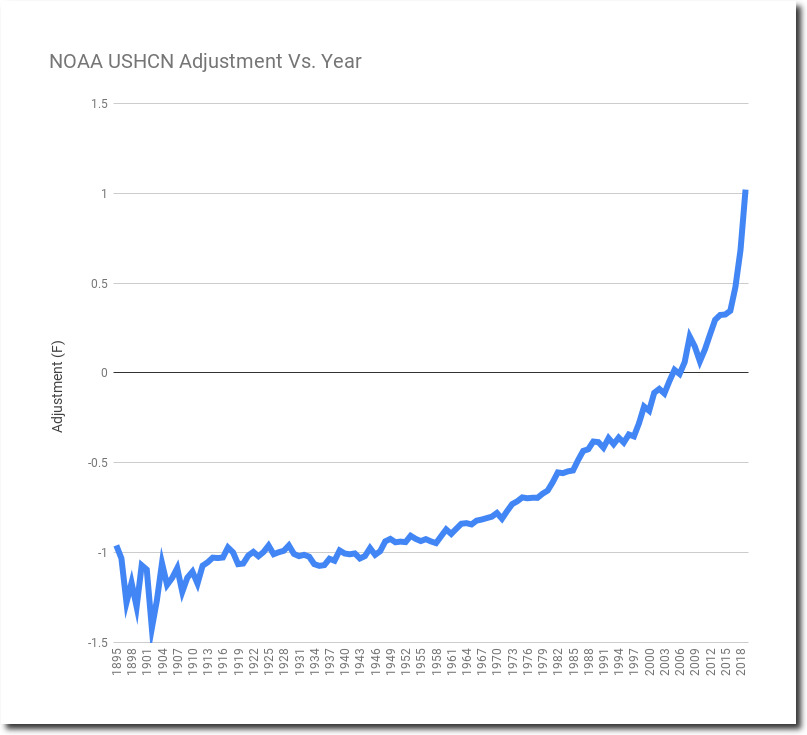
The data tampering makes a perfect hockey stick.

And the tampering precisely matches the increase in CO2.

Spreadsheet

Posted in Uncategorized | Leave a comment

Climate Barbie Worried About Canada Burning Up

The future ain’t what it used to be.

Yogi Berra

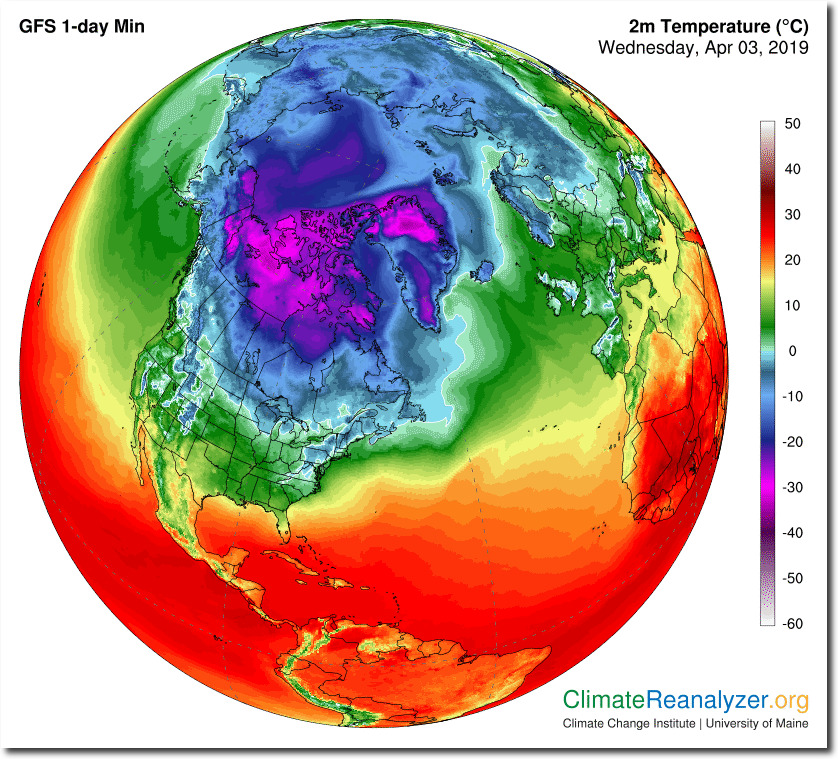
Canada is warming faster than the rest of the world from human-caused climate change. This poses significant risks to the health and well-being of Canadians and communities. 

Almost everyone in Canada lives along the southern border, in order to keep from freezing to death.  And they escape to Mexico at every possible opportunity to warm up.


Climate Reanalyzer

Mckenna and AOC would make a great comedy team.

Posted in Uncategorized | Leave a comment

Near Record Cold/Wet October-March In The US

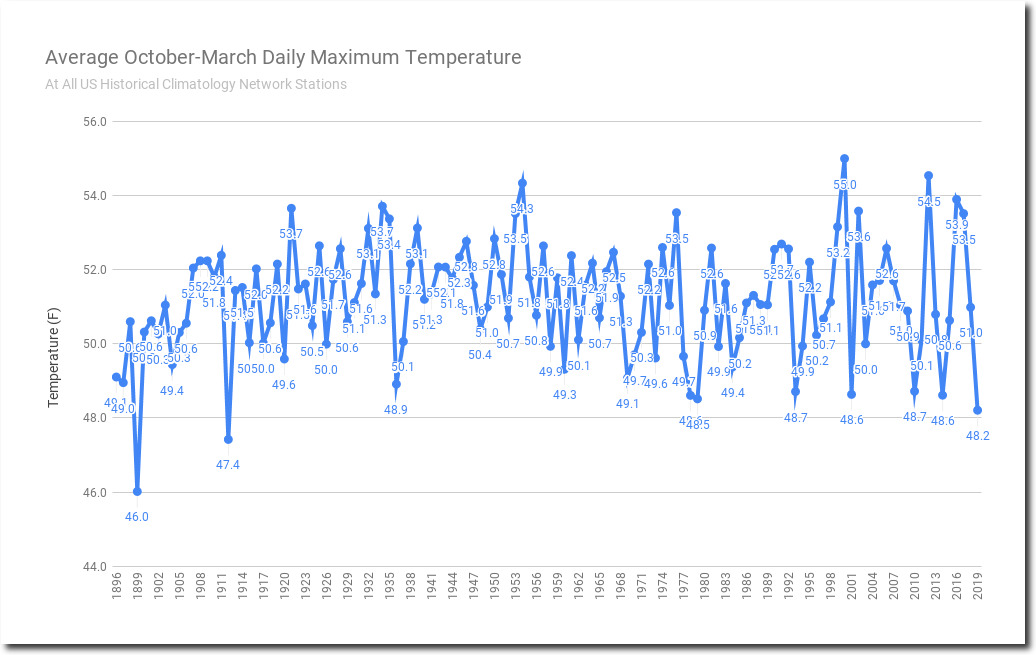
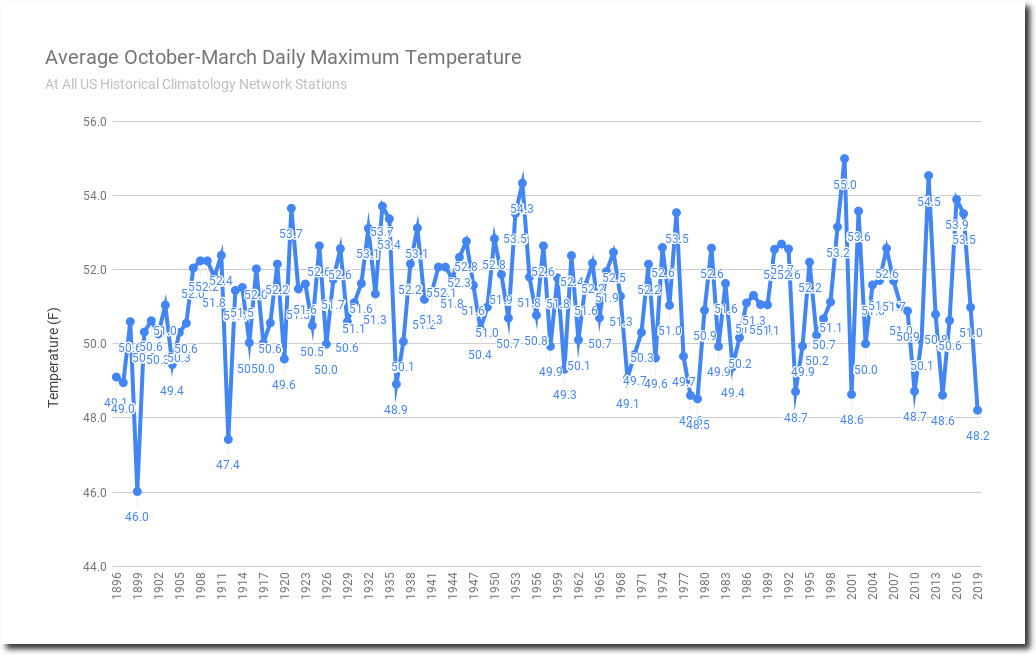
October-March US afternoon temperatures were third coldest on record.

Spreadsheet

About three-fourths of the US has been below normal temperature for the past six months.

https://hprcc.unl.edu/products/maps/acis/WaterTDeptUS.png

Almost the entire US has been above normal precipitation for the past six months.

https://hprcc.unl.edu/products/maps/acis/WaterPNormUS.png

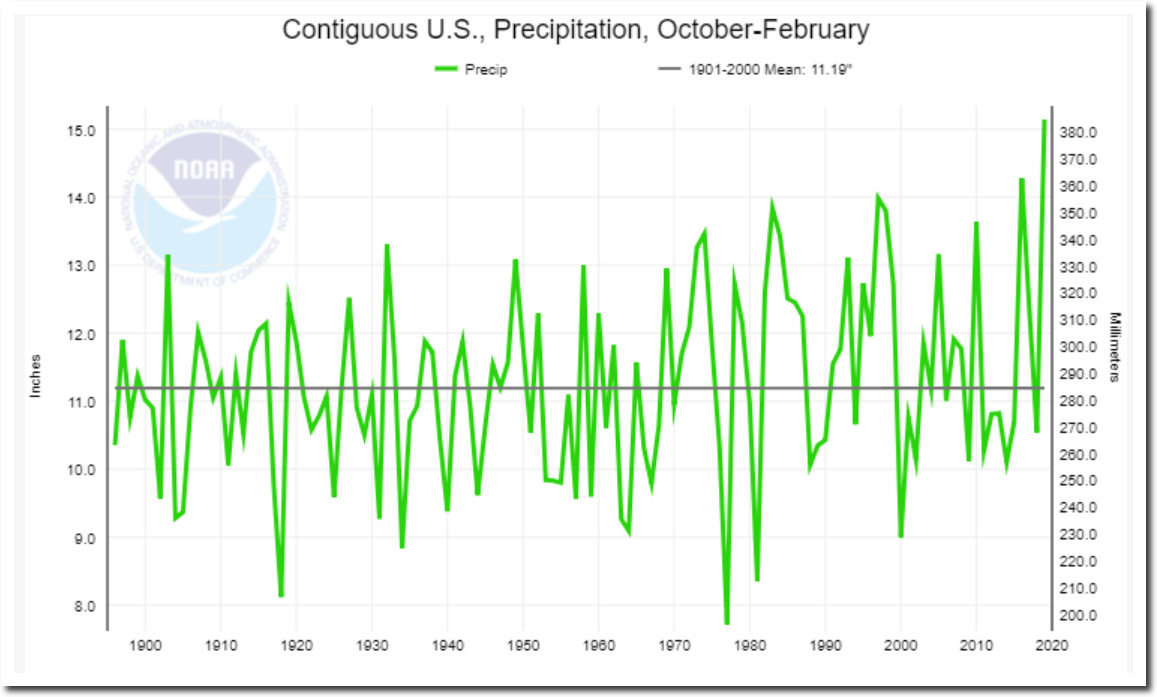
October-February was the wettest on record in the US.  (March data is not yet available from NOAA.)

Climate at a Glance | National Centers for Environmental Information (NCEI)

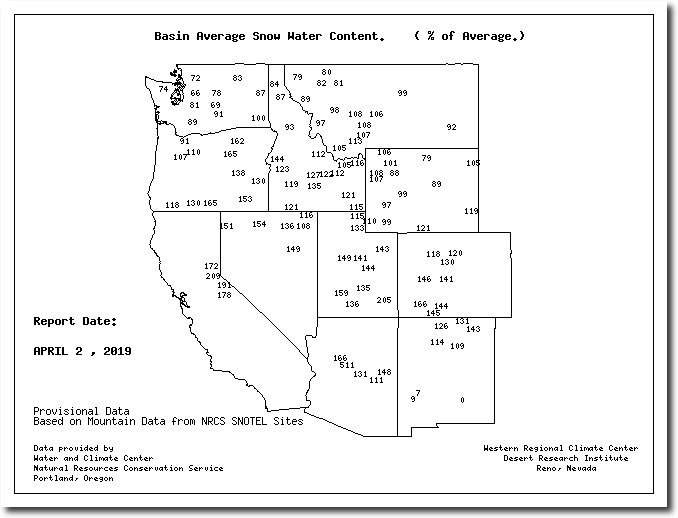
Western snowpack is far above normal.

Basin Snow Water Content Map (numeric) (SNOTEL)

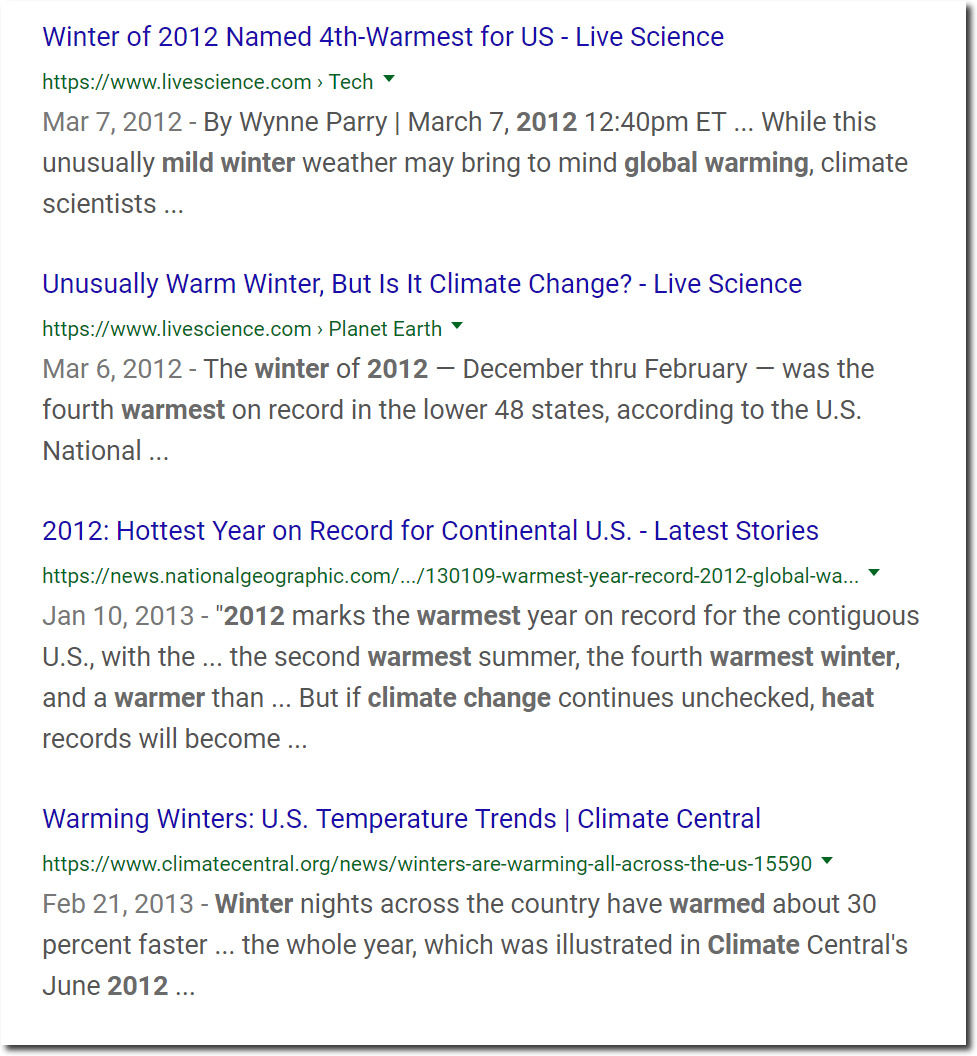
Experts say the record cold, wet and snow is caused by an overheated atmosphere.

In 2012, the same experts said the warmth and dry weather was caused by an overheated atmosphere.

If you don’t understand that hot air and drought causes record cold and wet weather, you are probably a paid oil industry shill, a Nazi and a racist. And you hate the planet.

Posted in Uncategorized | Leave a comment

Who Is Tony Heller?

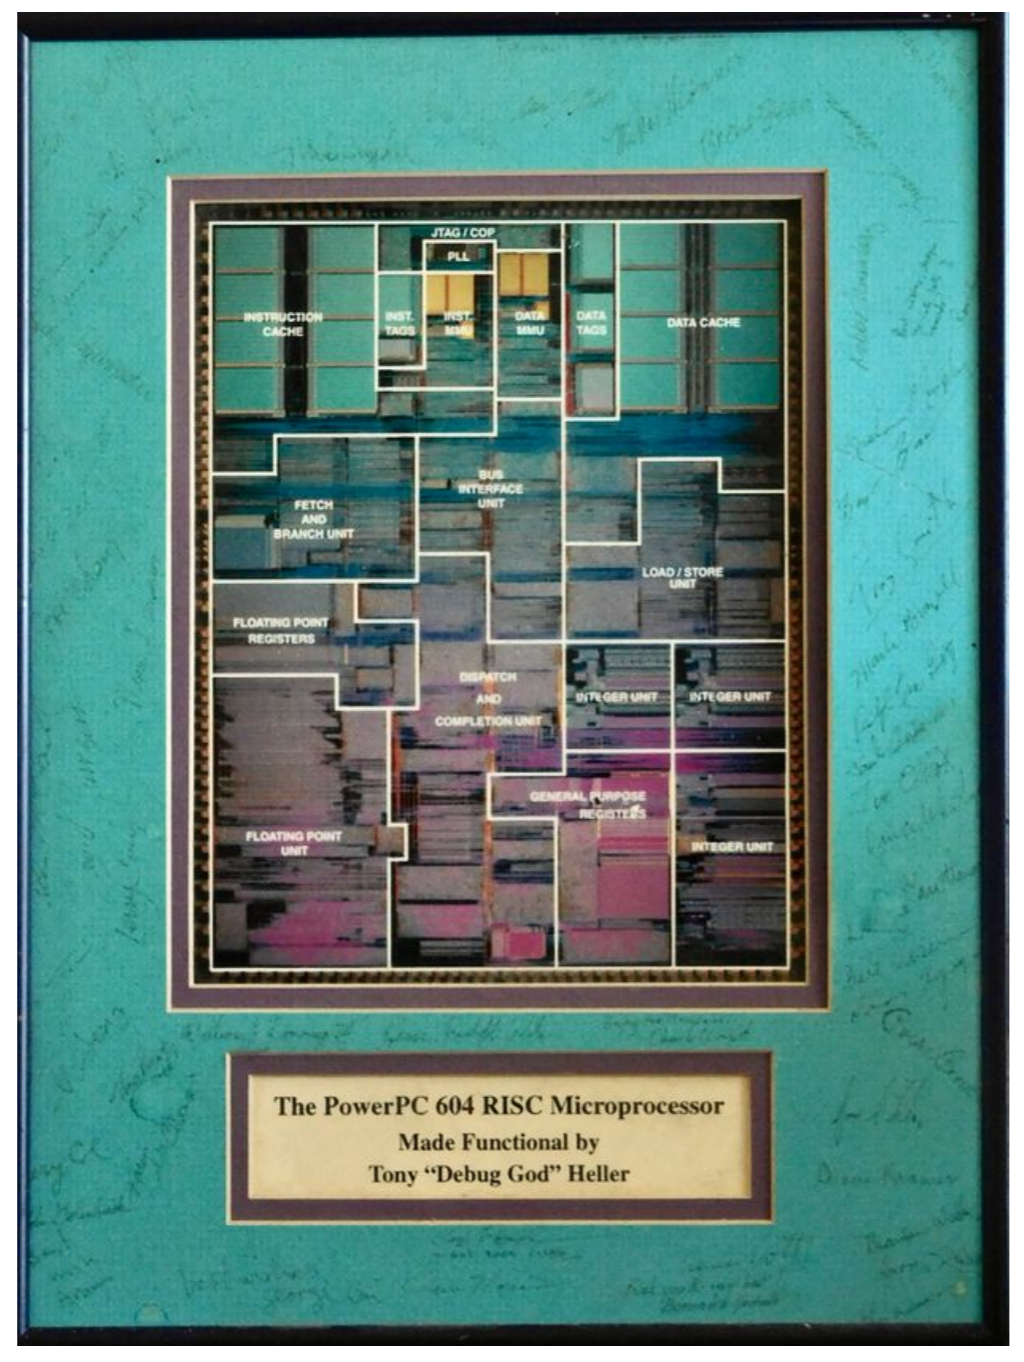
Plaque I was given by IBM/Apple/Motorola

People are constantly questioning my credentials.  Here are a few of them:

BS Geology, Arizona State University
Masters Electrical Engineering, Rice University
Boston University Geology
Northern Arizona University Computer Science
Colorado State University Computer Science
University of New Mexico Geochemistry

Lifelong environmentalist.
I testified at my first Congressional hearing in support of Wilderness in 1972.
I fought for the Clean Air and Water acts
Wilderness Ranger Cibola National Forest, New Mexico
Wilderness Ranger Santa Fe National Forest, New Mexico
Currently battling the City of Boulder, Colorado to stop development on the South Boulder Wetlands
Full time cyclist for all my local transportation, for the past 40 years

Teacher.
Science teacher, Athletic Director and Soccer Coach at Oak Creek Ranch School, Arizona
Math teacher at Phoenix Country Day School
Substitute teacher at Murphy School District, Phoenix Arizona
Computer instructor at Tomball College, Texas

Geologist.
Geothermal research at Los Alamos National Labs
Oil shale research at Los Alamos National Labs
Thermodynamic research of methane hydrates at Los Alamos National Labs
Volcano research at Los Alamos National Labs
Safety Analysis Report for the Permian Basin DOE nuclear waste disposal site
Volunteer curator Arizona Mineral Museum

Electrical Engineer
Compaq/SGI MIPS consortium design team
Power PC design team IBM/Apple/Motorola  (Used in  most game consoles over the last three decades, and PowerMacs)
Sandia Labs computer architect
Sandia Labs representative to Al Gore’s Bankers Trust key escrow consortium
Cyrix Media GX microprocessor design team manager
Raycer Graphics OpenGL graphics processor verification lead
Design manager Hitachi/ST SH5 microprocessor
Verification lead MemoryLogix microprocessor
Founder, design lead Visual Media video effects/editing software
OpenGL driver development ATI
Itanium/i7 design team Intel  (very likely being used by you right now)
Sped up Helicos DNA sequencing algorithm by 50X
Sped up NCAR weather microphysics kernel by 500X
Ported NCAR’s radiative transfer model to GPU
Ported NCAR’s WRF weather model to Windows
Drone visualization and control software for the US military
Medical device control systems (under NDA)
Virtual reality visualization design (under NDA)
Radio control and visualization software (under NDA)

There are many more projects I haven’t listed here. You will be hard pressed to find anyone with a broader and more successful career in science, education, environment and engineering.  I use the same skill set and techniques to analyze climate science claims, as I have used in science/engineering.

Your computer/game consoles work, partly due to my efforts. By contrast, climate science doesn’t work, because it is done largely by dishonest, incompetent hacks who don’t follow or even understand any legitimate methodology.

I don’t receive any funding from anyone, other than small donations to my blog – which work out to about $5/hour. I hate cars and would love to see 90% of them off the road. I have been hit by cars several times riding my bicycle, and they foul the air with pollution.


Posted in Uncategorized | 1 Comment

“NOAA Recorded”

I believe in mathematics.  Not junk climate science.

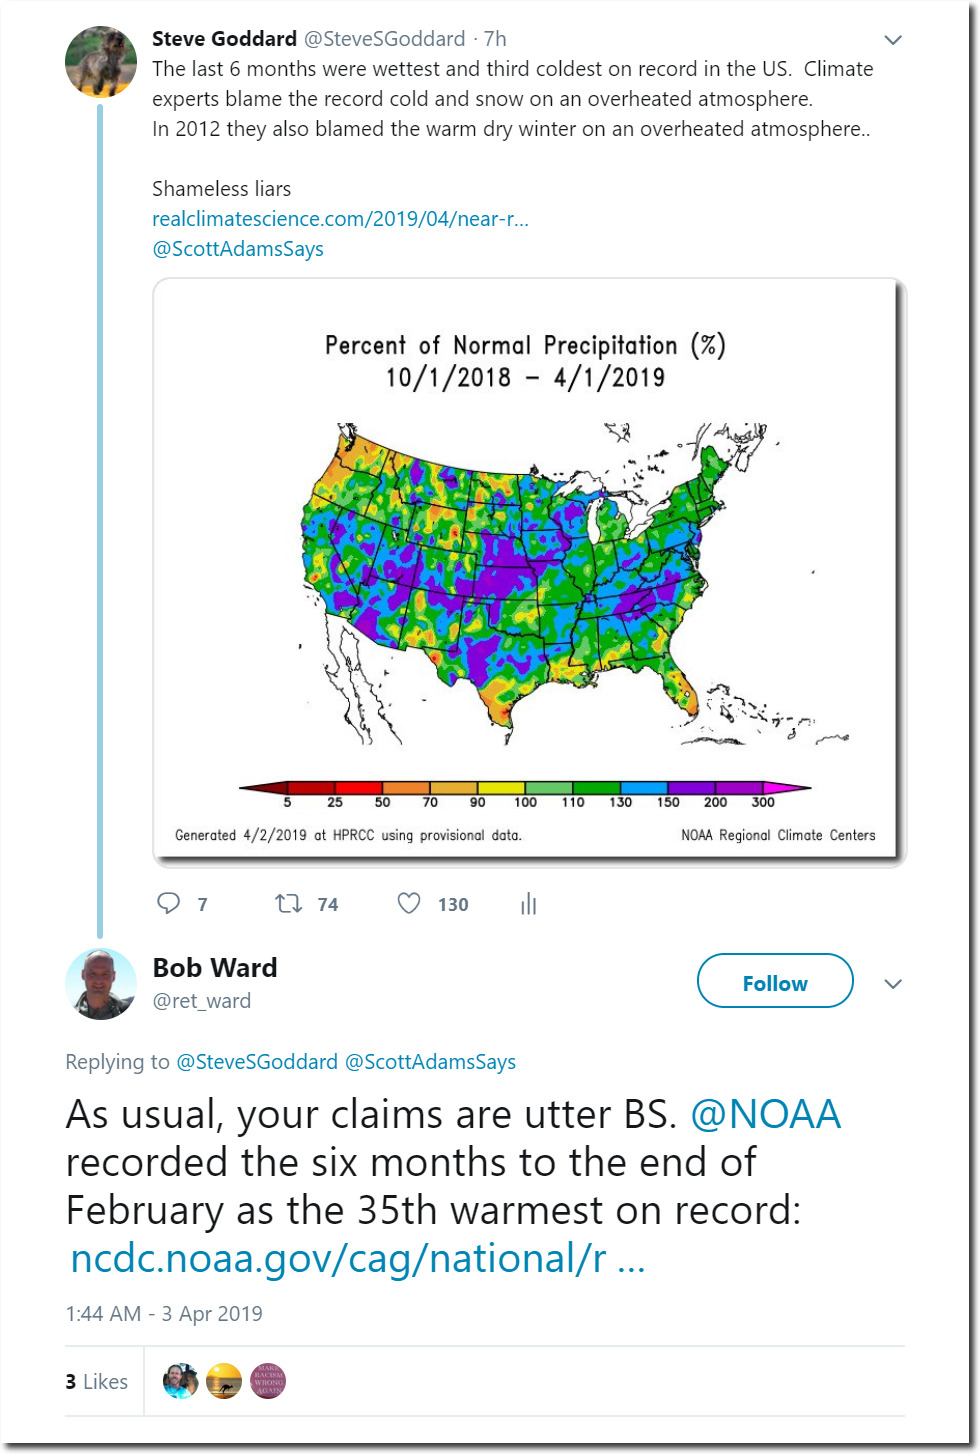
In my previous blog post, I reported that October-March afternoon temperatures were third coldest on record in the US. Bob Ward angrily responded with :

“utter BS. NOAA recorded the six months to the end of February as the 35th warmest on record.”

Bob Ward on Twitter: “As usual, your claims are utter BS

Bob made two major mistakes.  First he used the wrong six month period, Sep-Feb instead of Oct-Mar. But his big mistake is using the words “NOAA recorded.”  He should have said “NOAA reported.”  NOAA massively alters their recorded data before they report it.

Here are the NOAA recorded average daily maximum temperatures, third coldest :

Here are the NOAA recorded average monthly maximum  temperatures, third coldest :

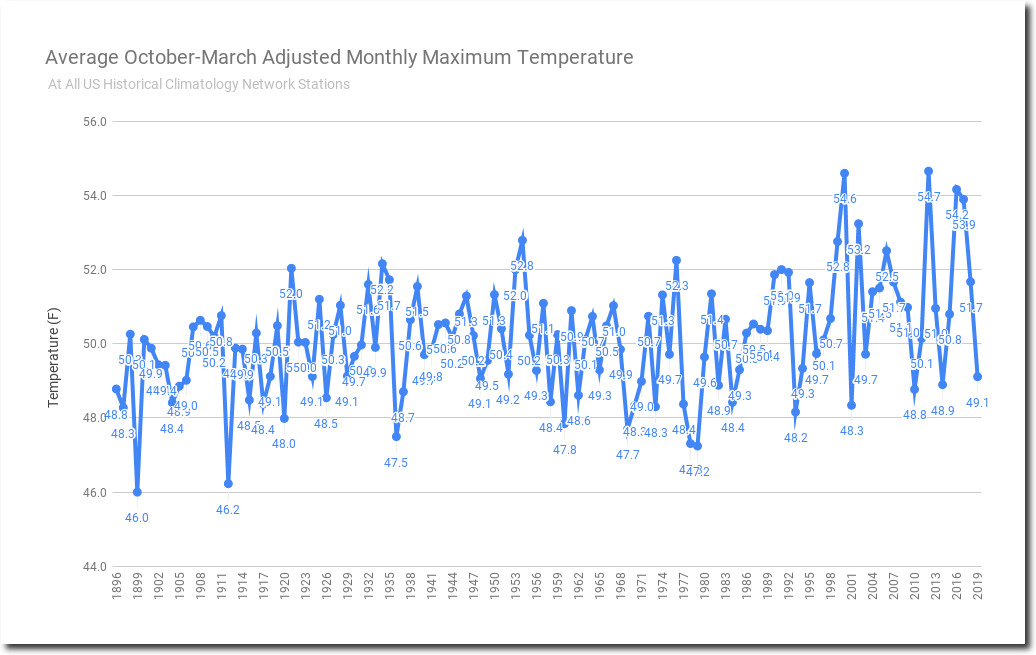
Here are the NOAA reported average monthly maximum temperatures, 31st coldest :

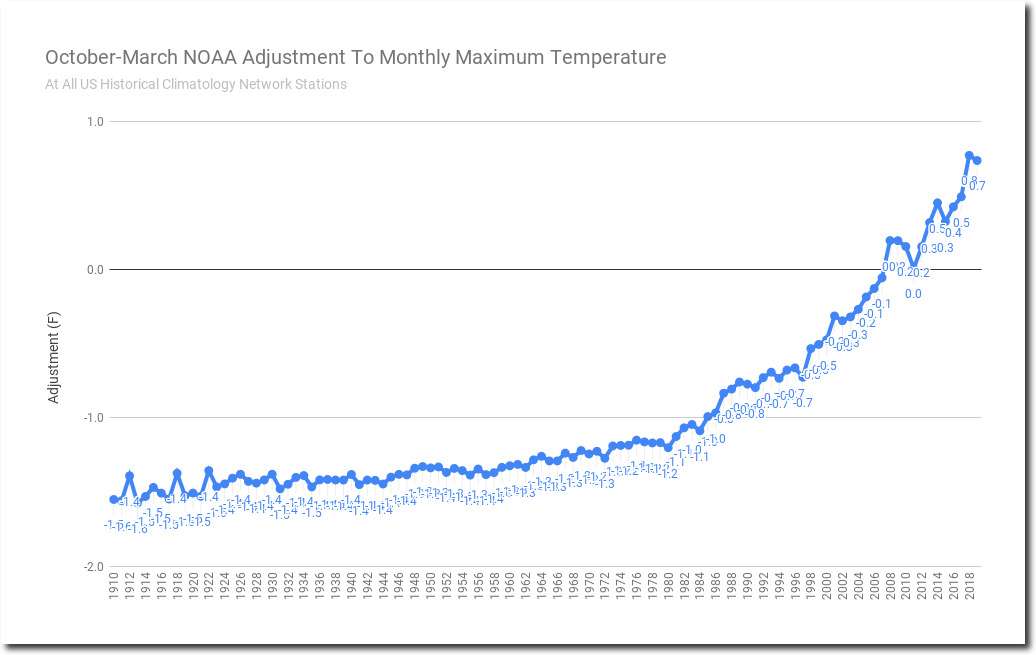
Here are the NOAA adjustments to average monthly maximum temperatures, 2nd largest :

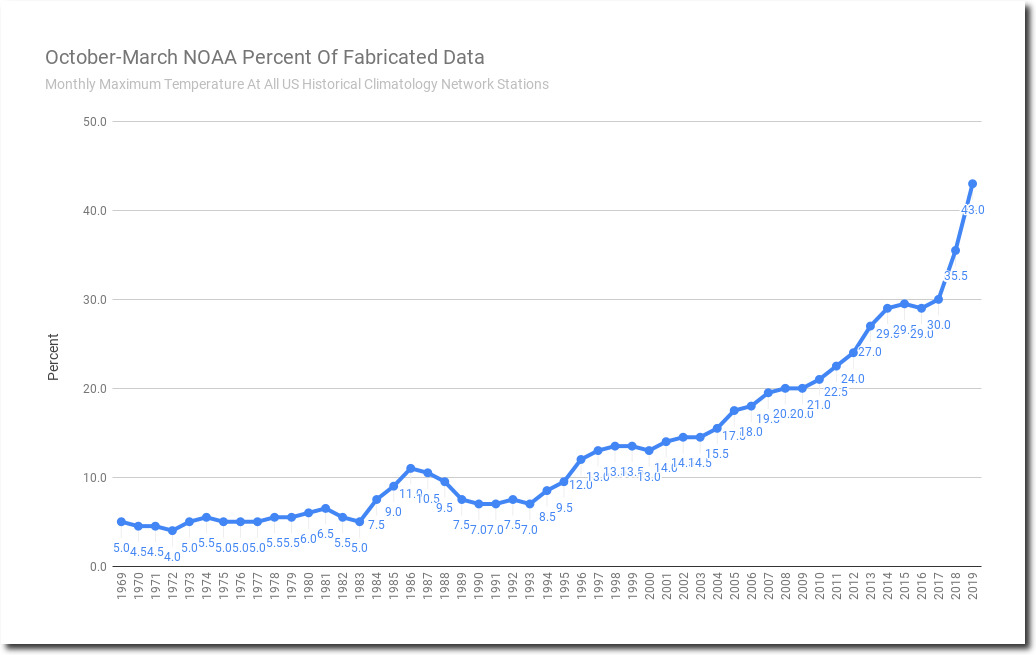
About 43% of the data NOAA used in the their adjusted calculation was fabricated by computer model, rather than record – the largest percentage of fake data on record. The fake data is marked with an “E” in the NOAA text files.

Spreadsheet

All of the data is taken directly from the NOAA ftp site. I challenge Bob to prove me wrong.

ftp://ftp.ncdc.noaa.gov/pub/data/ushcn/v2.5/ushcn.tmax.latest.raw.tar.gz

ftp://ftp.ncdc.noaa.gov/pub/data/ushcn/v2.5/ushcn.tmax.latest.FLs.52j.tar.gz

Posted in Uncategorized | Leave a comment