Disrupting the Borg is expensive and time consuming!
Google Search
-
Recent Posts
- Earth, Wind And Fire
- On The Road Again
- Vandalism At The Reflecting Pool
- Fifty Years Ago Today
- Truth Or Consequences
- US Climate Trend Maps
- Declining Spring Snow Cover In Northern New Mexico
- You Can’t Fool Mother Nature
- Cattle And The Climate
- One Atomic Bomb Per Hour
- New Video : Analyzing Oil And Gas
- Is Antarctica Melting?
- High Speed Analysis And Visualization
- El Nino To The Rescue?
- Fake News Update
- Growth Of Antarctic Sea Ice
- 65 Years Of Progress!
- El Nino To The Rescue?
- Worst March Drought On Record
- ChartGL Process Control Demo
- The Biggest Money Laundering Scam
- Drought In The Headwaters Of Lake Powell
- Unrealistic Expectations Of Water Availability
- Did Bill Gates Do This?
- Worst March Drought On Record In The US
Recent Comments
- GW on Earth, Wind And Fire
- Bob G on On The Road Again
- Luigi on On The Road Again
- arn on On The Road Again
- Bob G on On The Road Again
- Gordon Vigurs on On The Road Again
- Bob G on On The Road Again
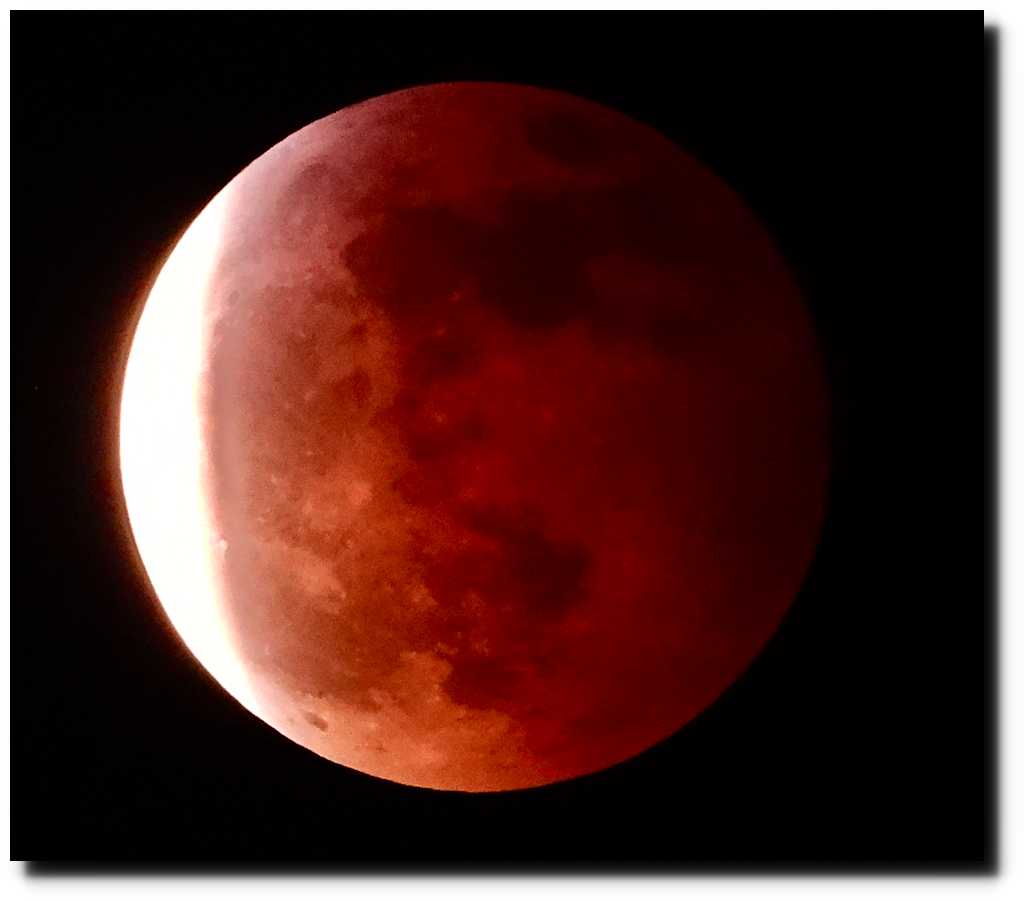
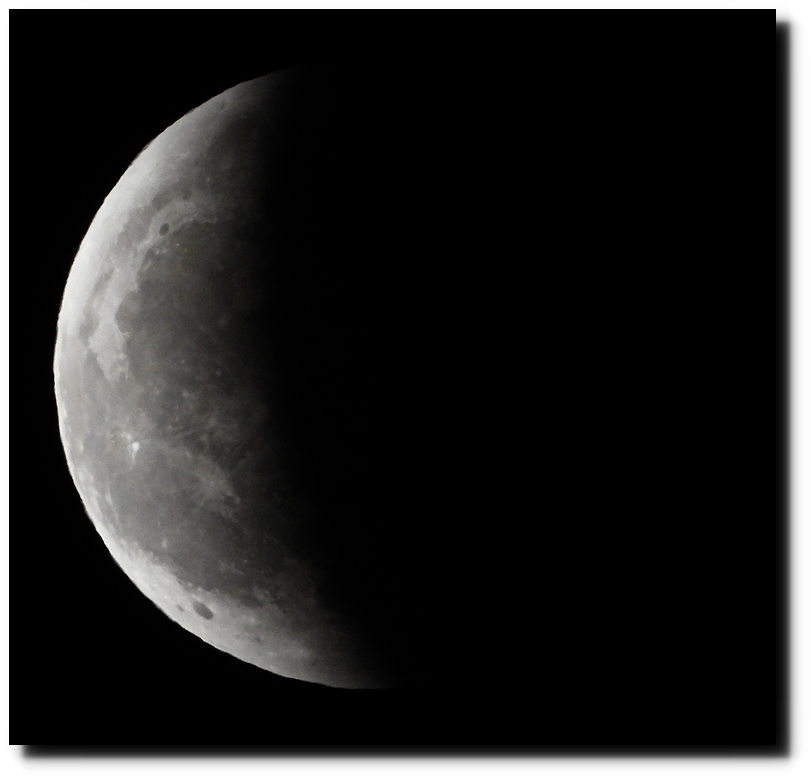
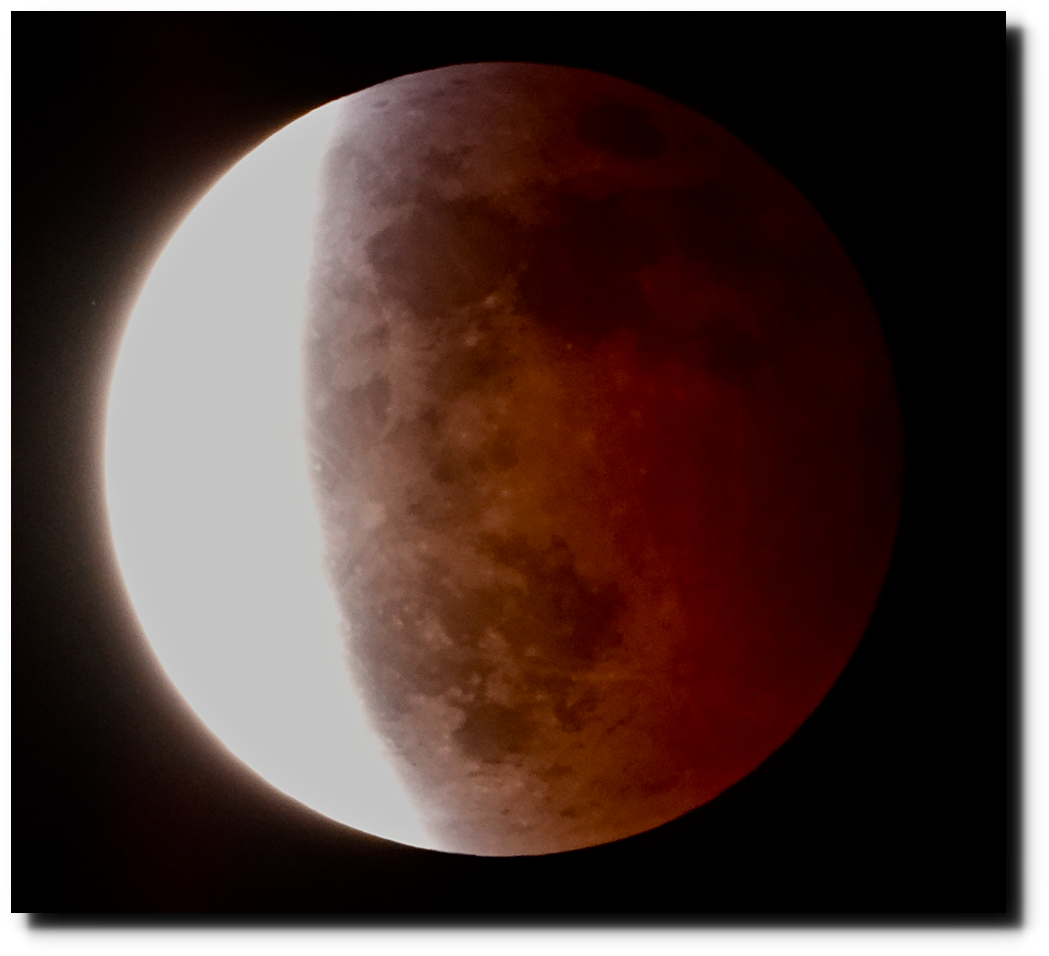
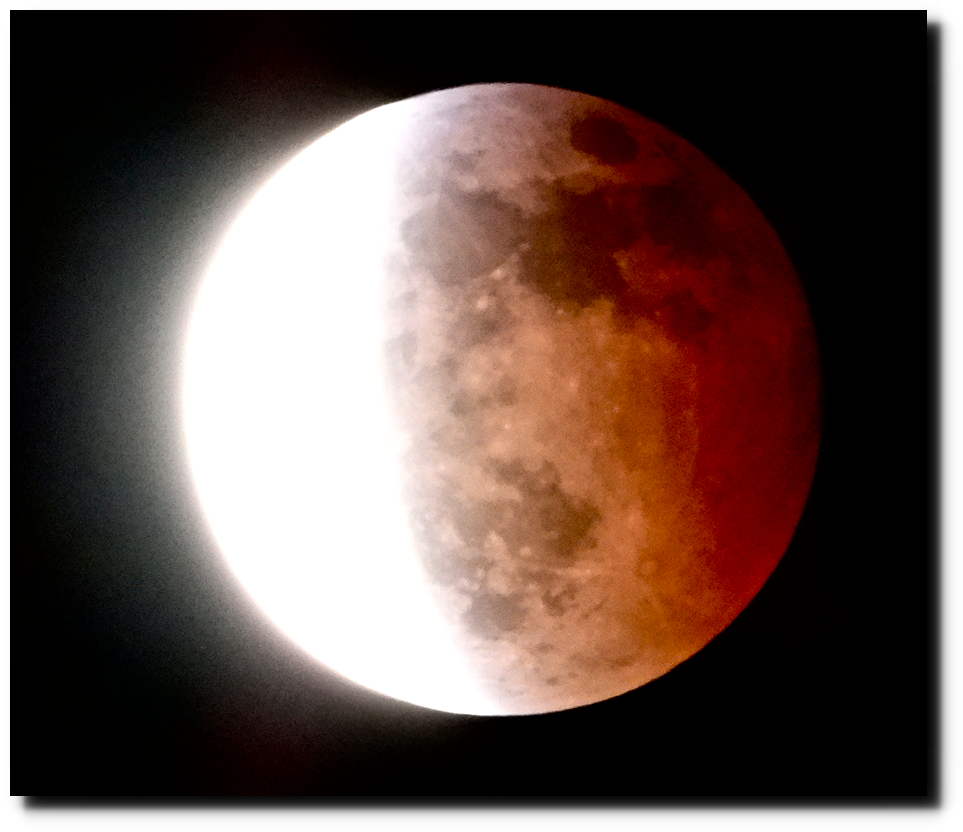
Eclipse Pictures
Posted in Uncategorized
Leave a comment
CO2 Forgetting To Trap Heat In The Arctic
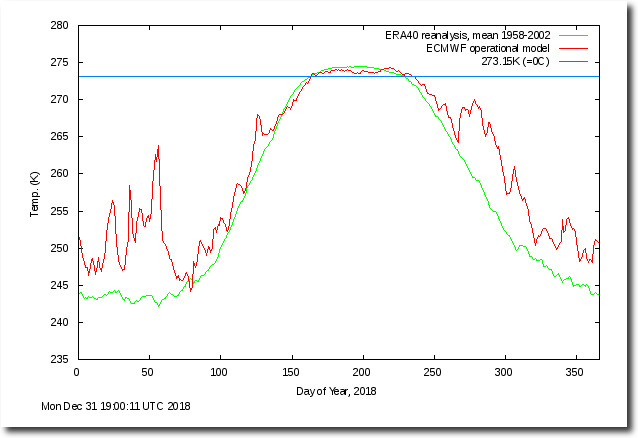
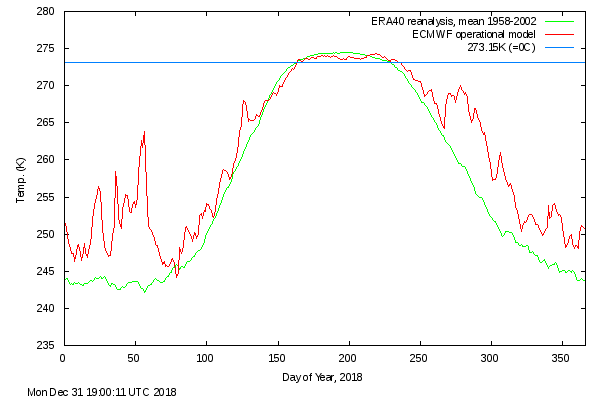
Last year, temperatures were not as cold as they usually are near the North Pole. This was blamed on CO2 trapping heat.
http://ocean.dmi.dk/arctic/plots/meanTarchive/meanT_2018.png
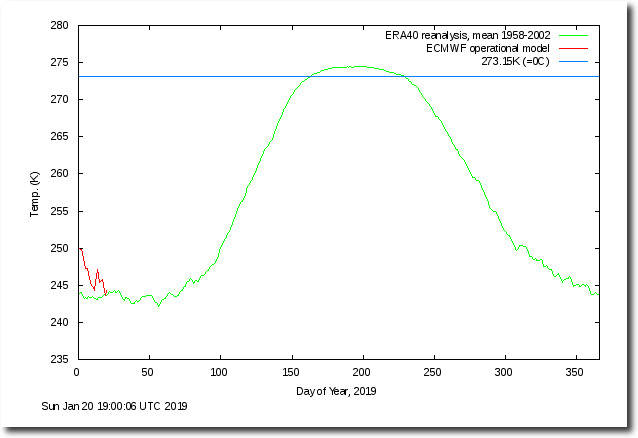
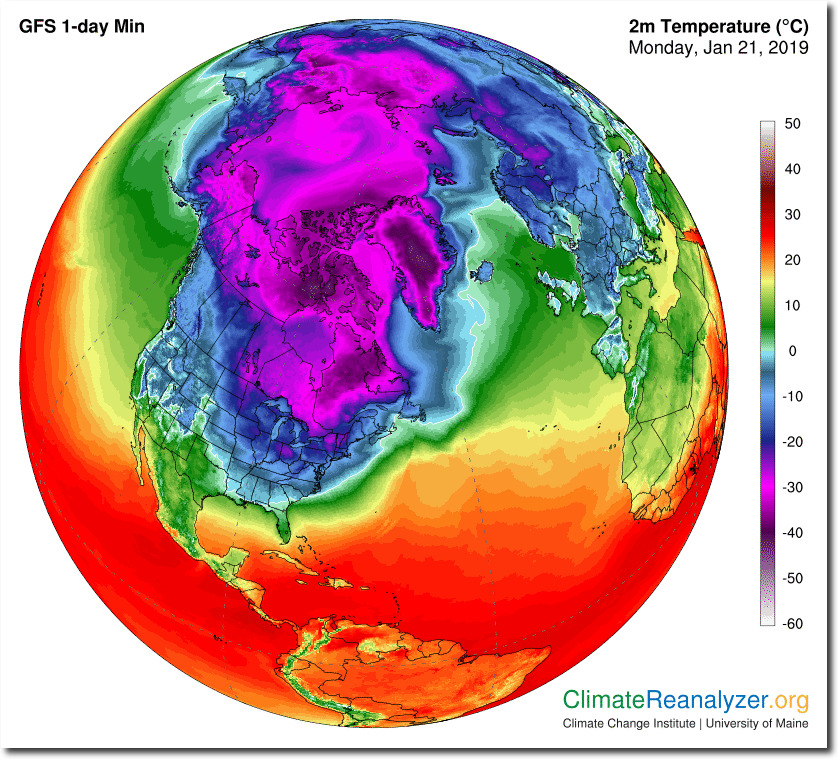
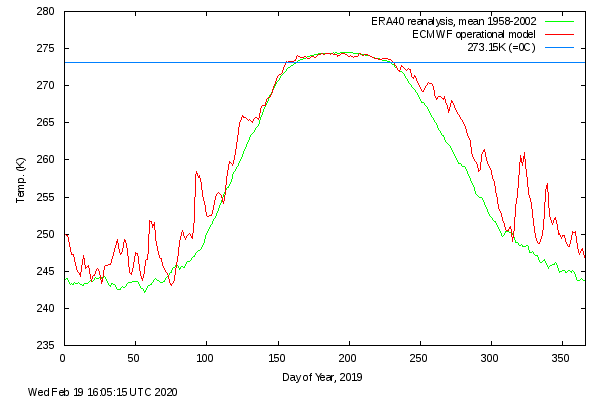
This year, temperatures are very cold near the North Pole. Apparently CO2 is getting lazy with its heat trapping capabilities.
http://ocean.dmi.dk/arctic/plots/meanTarchive/meanT_2019.png
CO2 appears to be a very fickle gas.
Posted in Uncategorized
Leave a comment
Plummeting January 21 Temperatures In The US
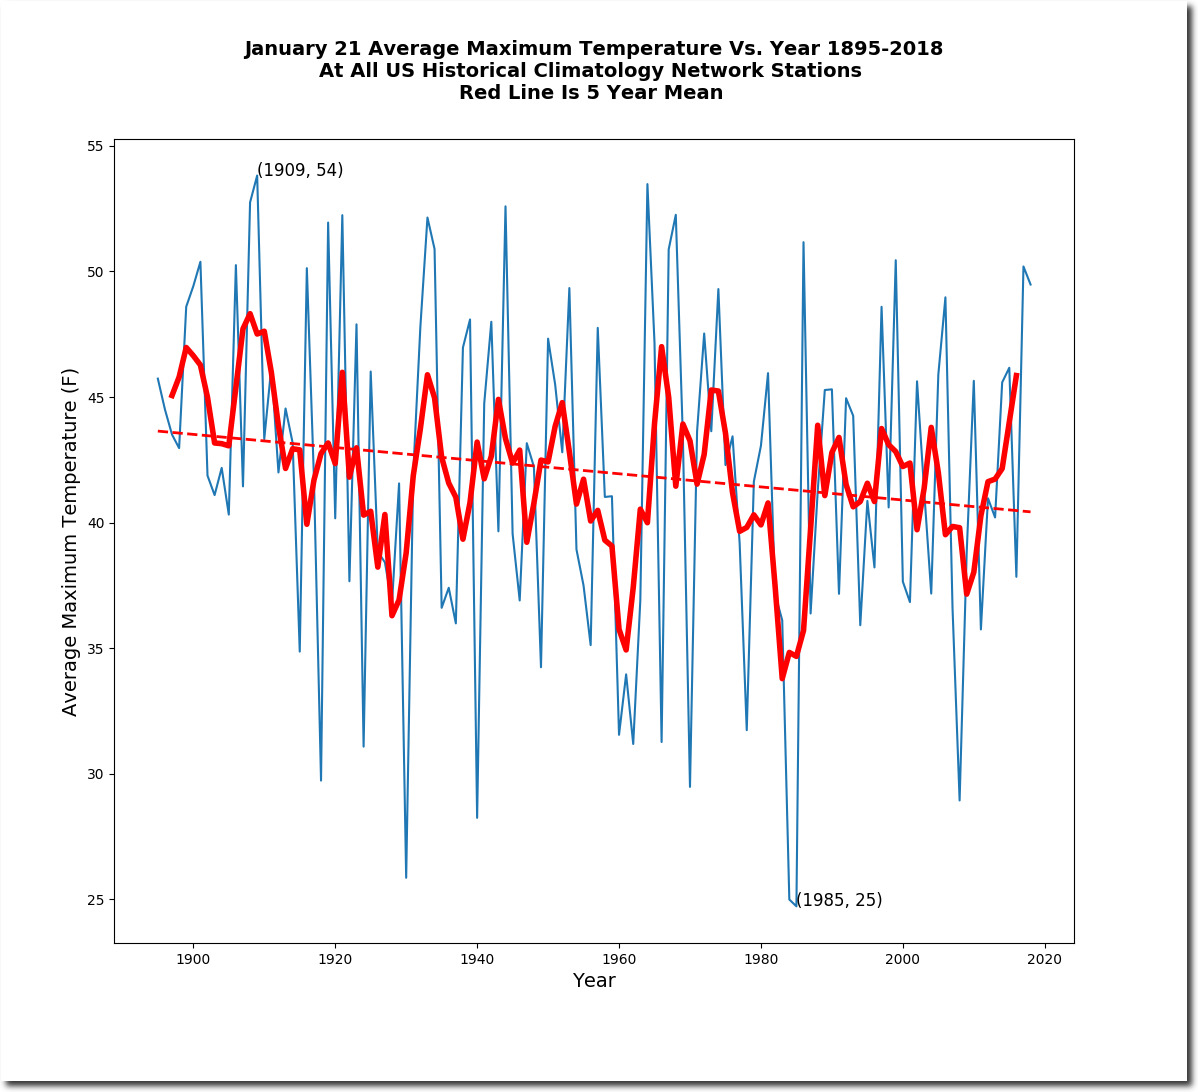
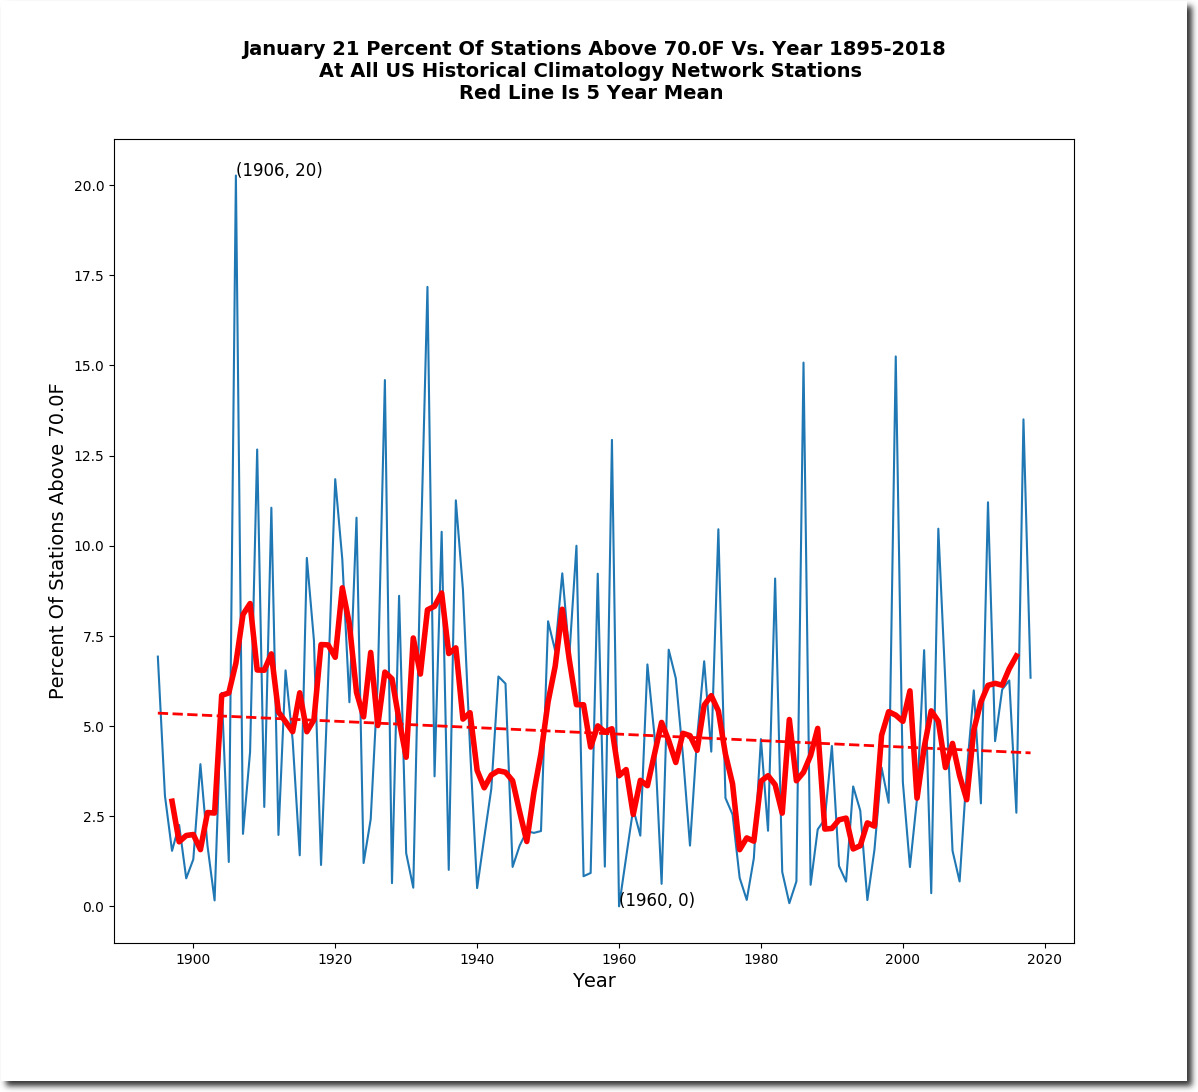
January 21 afternoon temperatures have dropped several degrees in the US since the 19th century, as has the likelihood of warm weather on this date.
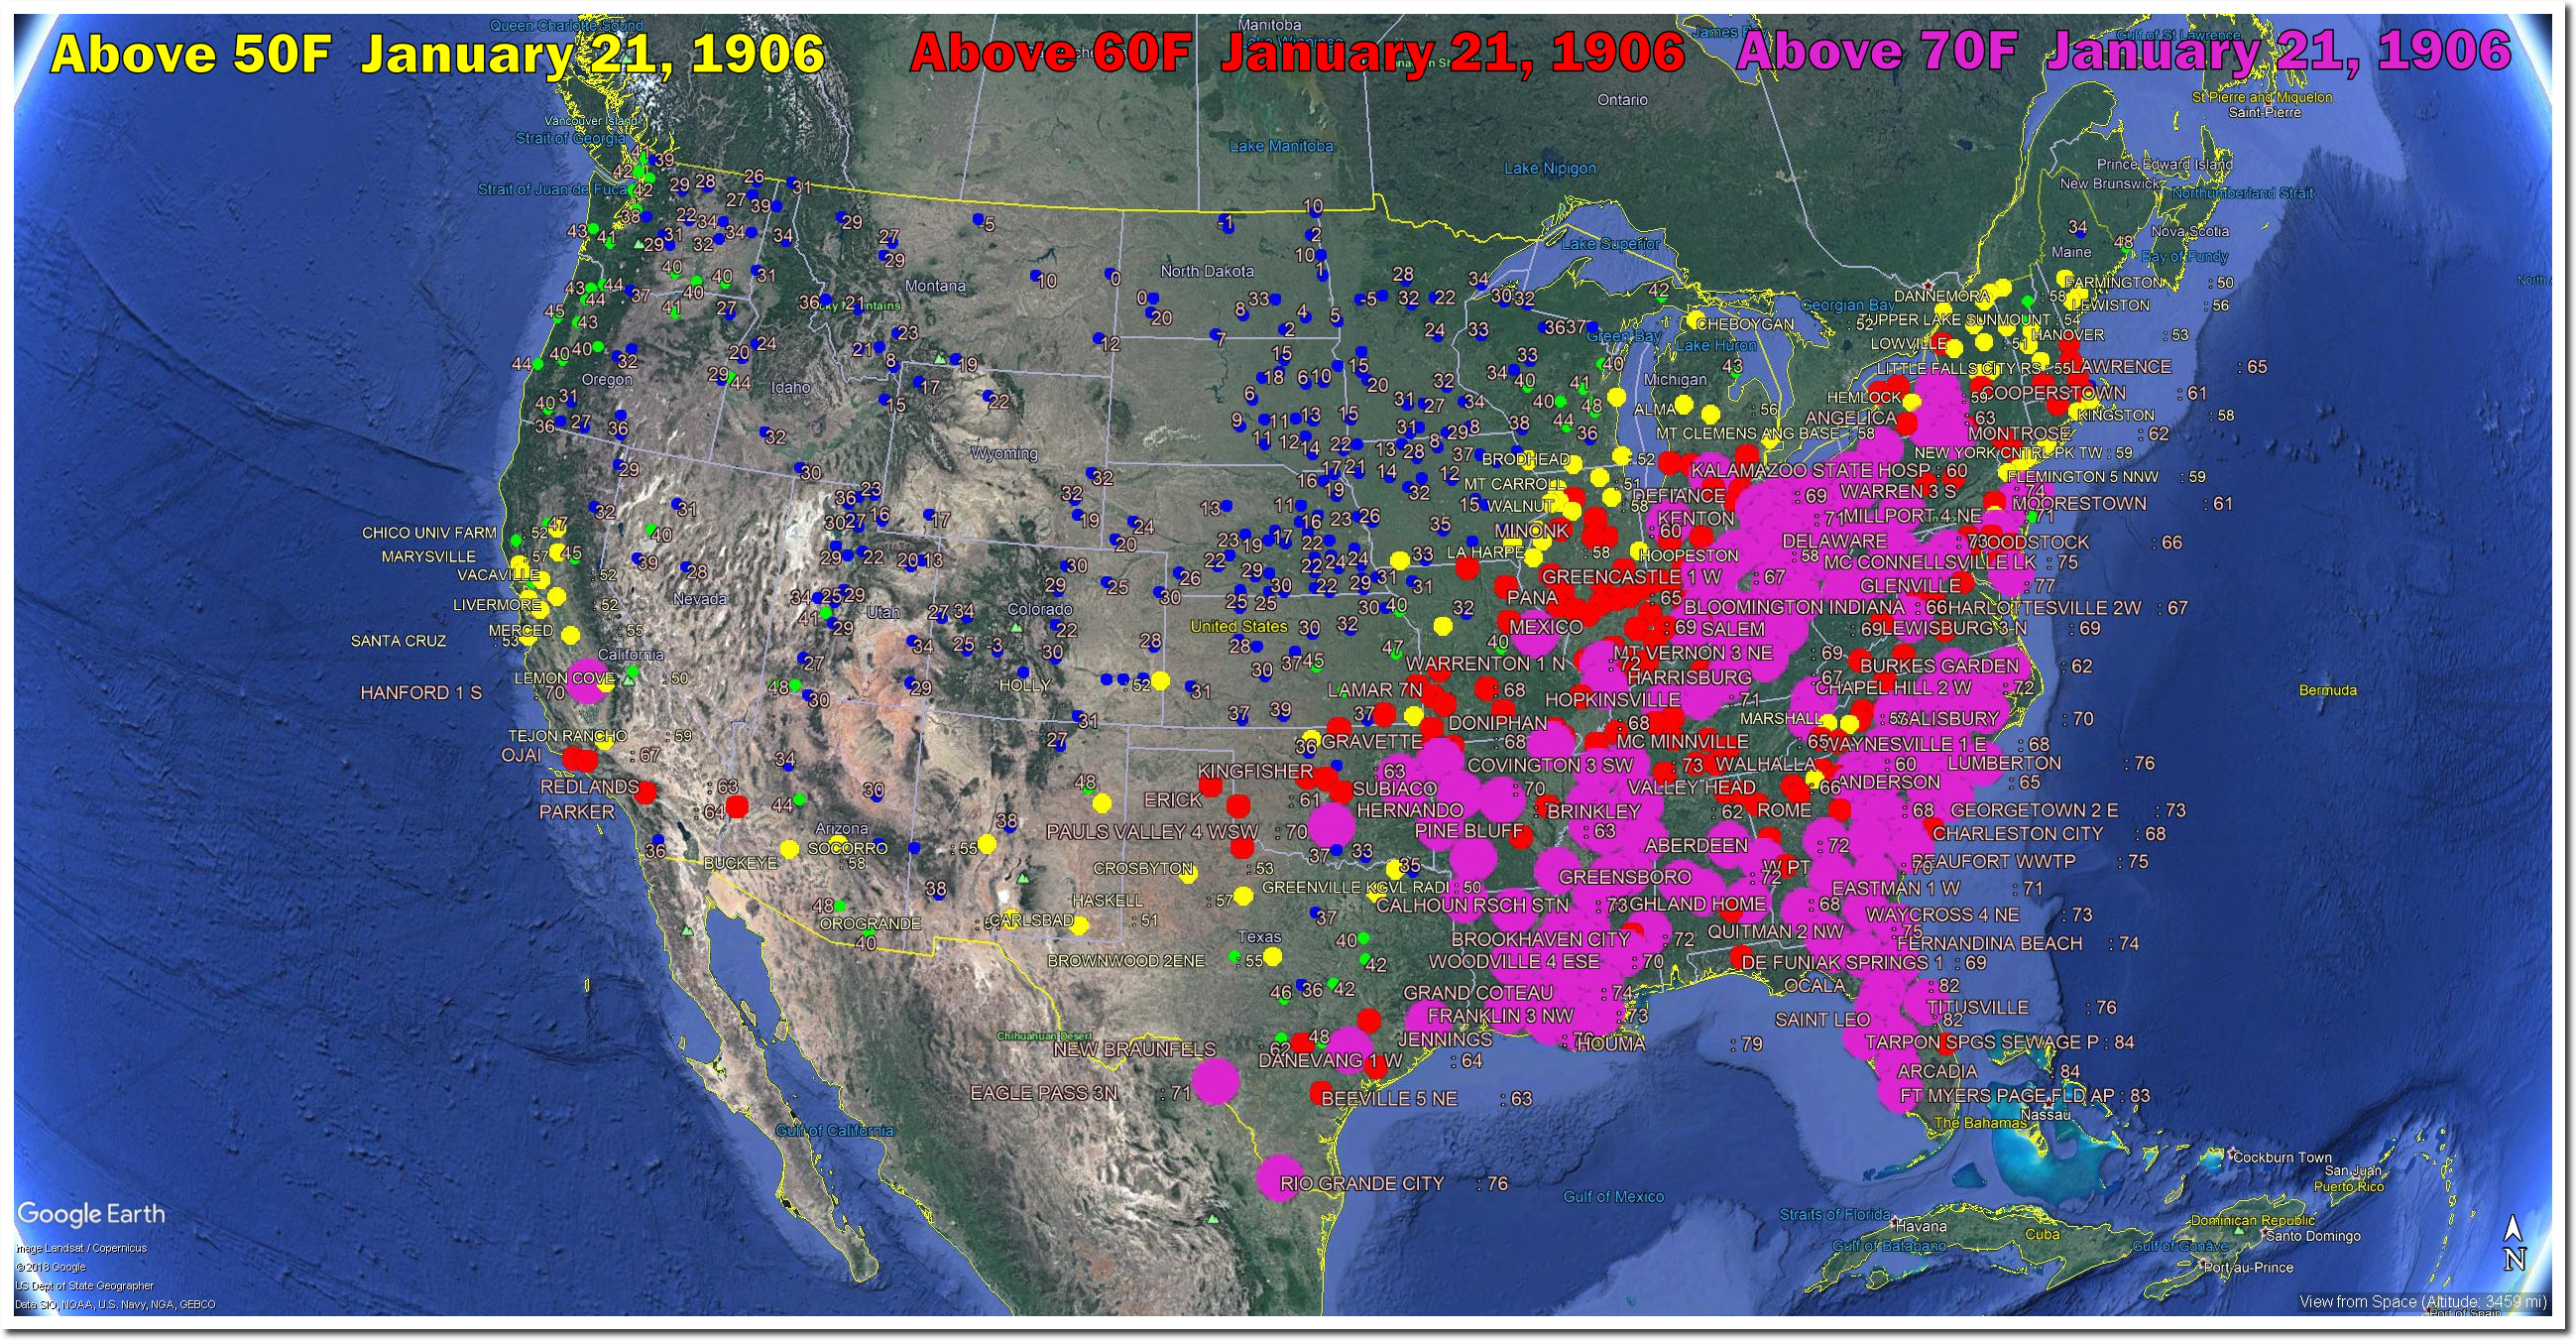
On January 21, 1906, almost half of USHCN stations were over 60 degrees, and one out five were over 70 degrees.
There were 70 degree temperatures in many locations in New York, and 60 degree temperatures in New Hampshire.
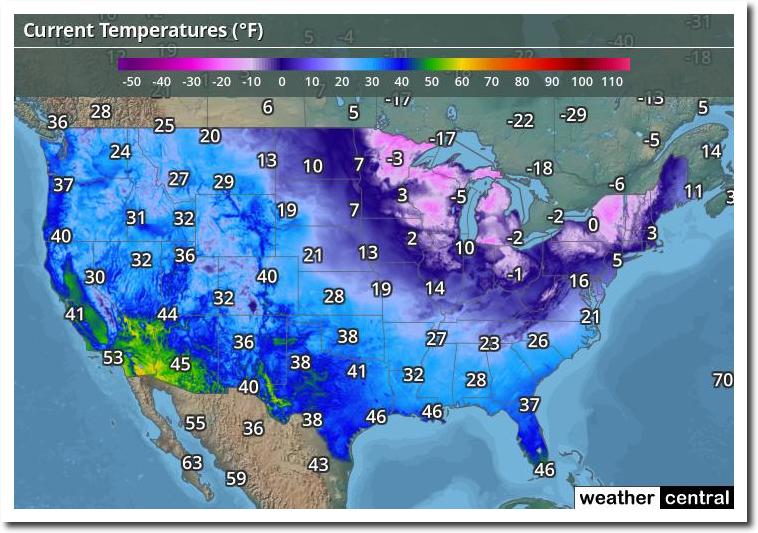
Temperatures on this date in 1906 were 50-60 degrees warmer than this year.
US Weather – Current Temperatures Map | WeatherCentral.com
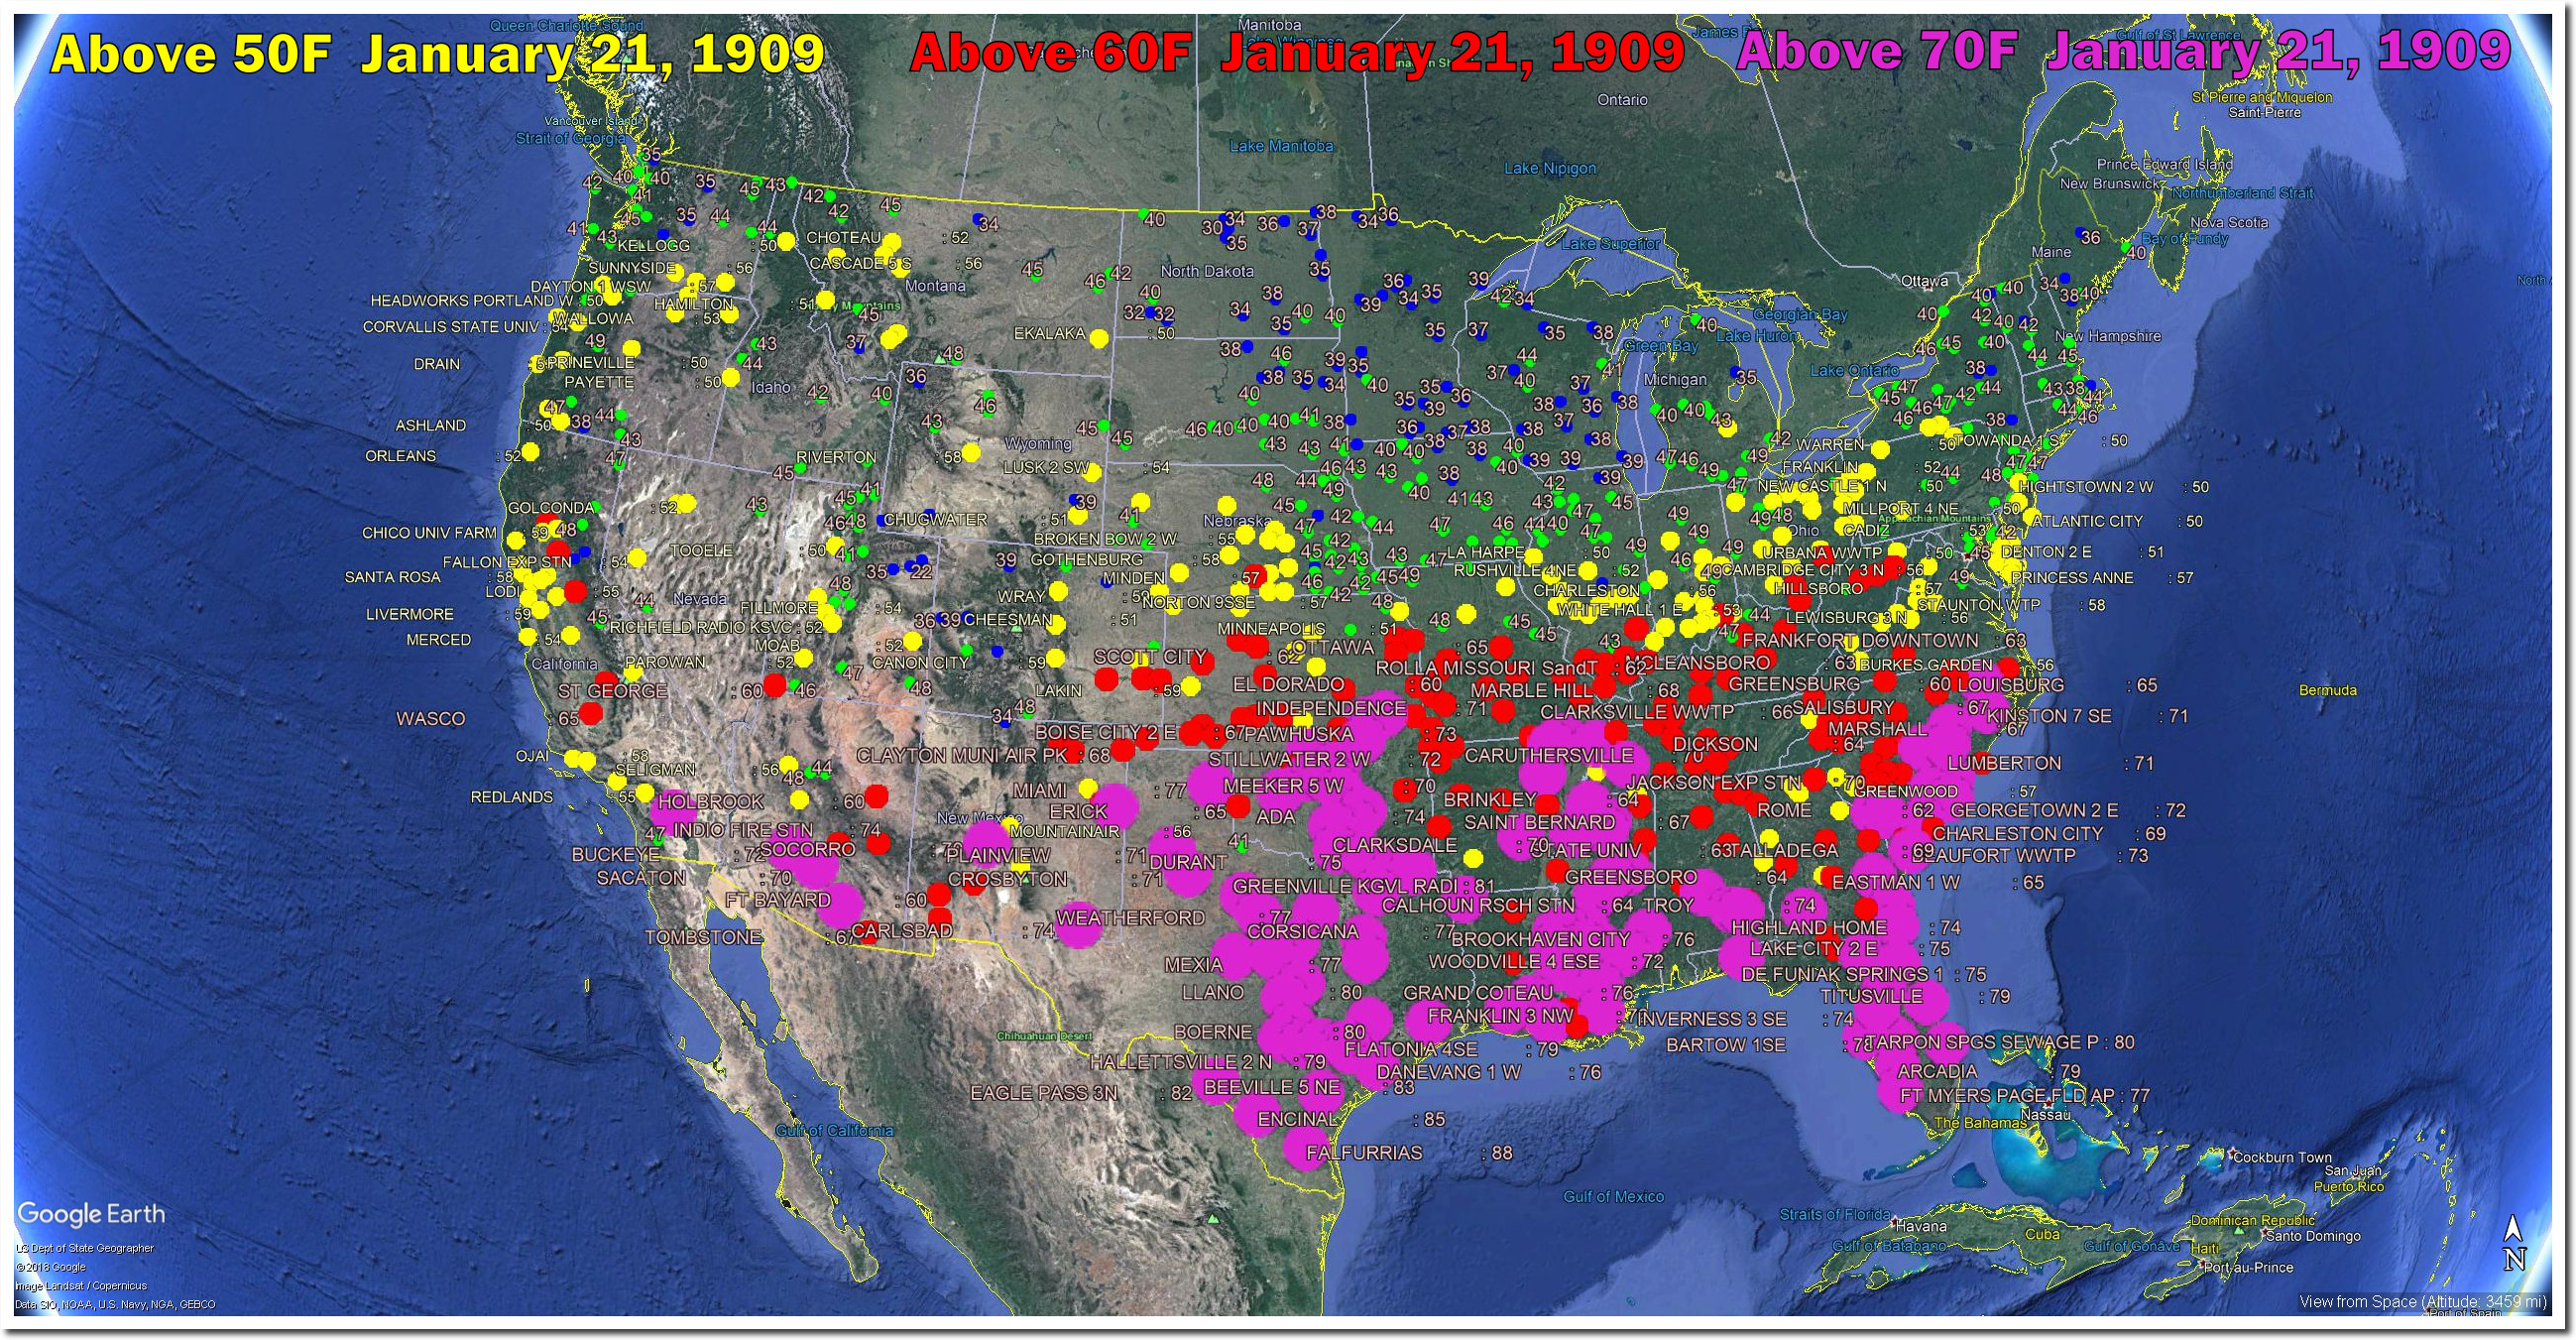
Temperatures were also very warm on this date in 1909, with the average maximum being 54 degrees.
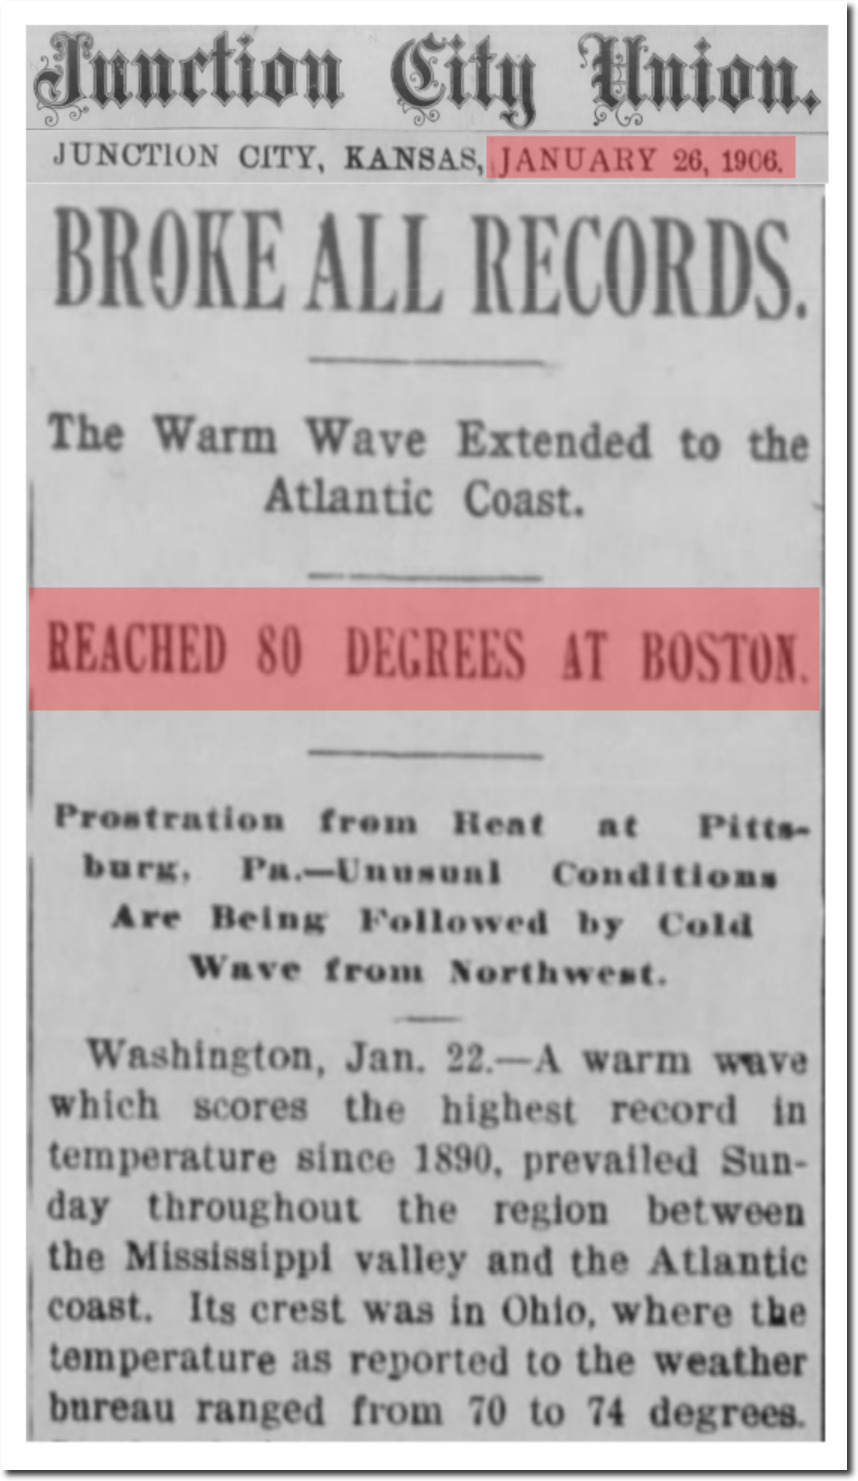
Carbon dioxide seems to be having difficulty trapping heat as its concentration increases. It was 80 degrees in Boston on January 22, 1906, about 70 degrees warmer than today.
26 Jan 1906, Page 5 – The Junction City Weekly Union at Newspapers.com
Posted in Uncategorized
Leave a comment
Updated Bourke Heatwave Comparison
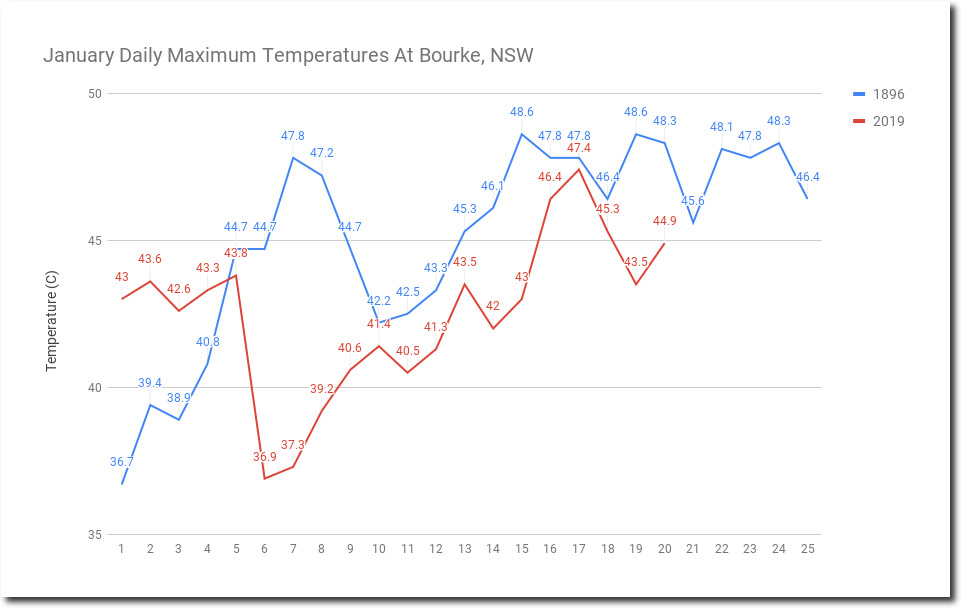
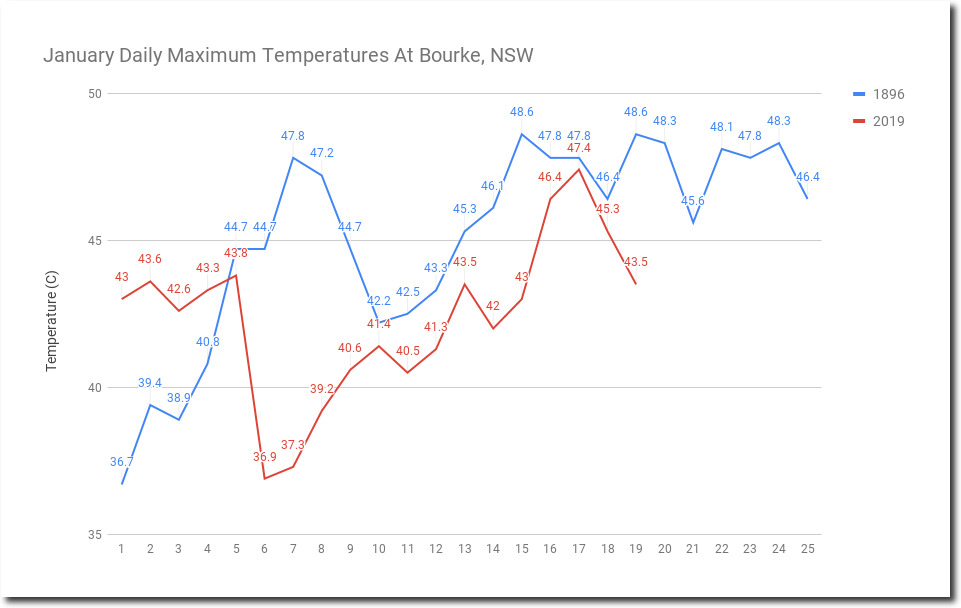
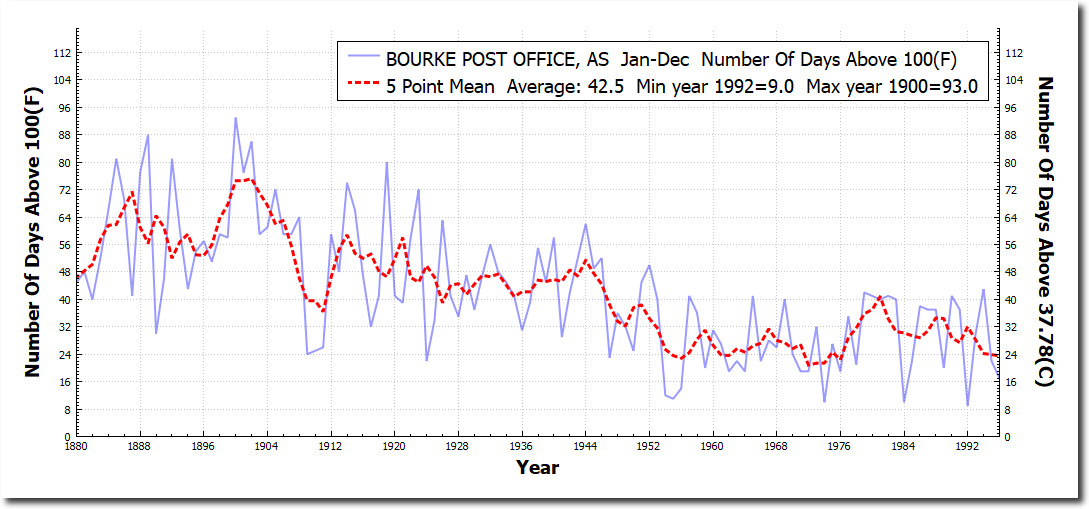
January 1896 was much hotter at Bourke, NSW than this year’s “record” heat. No surprise that BOM hides pre-1910 data.
Posted in Uncategorized
Leave a comment
Hall Of Famer
Posted in Uncategorized
Leave a comment
Comparison Of The January 1896 Heatwave At Bourke, NSW With This Year
January 1-19, 1896 averaged 2C hotter than this year at Bourke, NSW.
The number of 100F (38C) days at Bourke plummeted from 1880 until the station shut down in 1996.
Posted in Uncategorized
Leave a comment
New York Times Blames The Polar Vortex On Global Warming And Melting Arctic Ice
In 2006, the New York Times announced the “endless summer.”
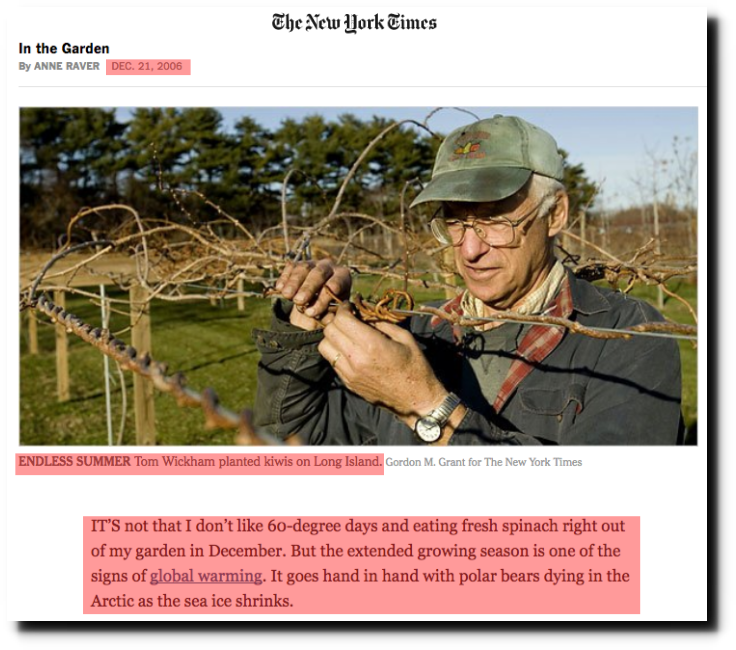
With Warmer Weather, Different Decisions to Make – The New York Times
That didn’t work out very well for them, so now they are blaming the cold and snow on global warming and shrinking Arctic ice.
Some researchers, including Dr. Francis and Dr. Cohen, say they suspect that the more frequent polar vortex breakdowns can be tied to climate change.
the Arctic is warming at a rate twice as fast as the world average. That warming has led to historically low levels of sea ice in the region. The melting sea ice, particularly in an area near the Barents and Kara Seas off Siberia, may be linked to the changes in the polar vortex.
Brace for the Polar Vortex: It May Be Visiting More Often – The New York Times
Forty years ago, they blamed the polar vortex on global cooling, and increasing Arctic ice.
International Team of Specialists Finds No End in Sight to 30?Year Cooling Trend in Northern Hemisphere
By WALTER SULLIVAN JAN. 5, 1978
A gradual increase in area of the northern circumpolar vortex, the massive flow of frigid air around the Arctic, has been recorded by Drs. Angell and Korshover. In 1976 its southern’ extent was the greatest in 10 years and last winter it was 1 percent larger than in any previous winter observed.
Snow and ice cover in the Northern Hemisphere have varied greatly but there has been a net increase according to a satellite photograph analysis by Dr George J. Kukla of Columbia University’s Lamont?Doherty Geological Observatory. This has been most marked in the spring when so highly reflective a cover returns much solar energy into space at a time of intense solar radiation.
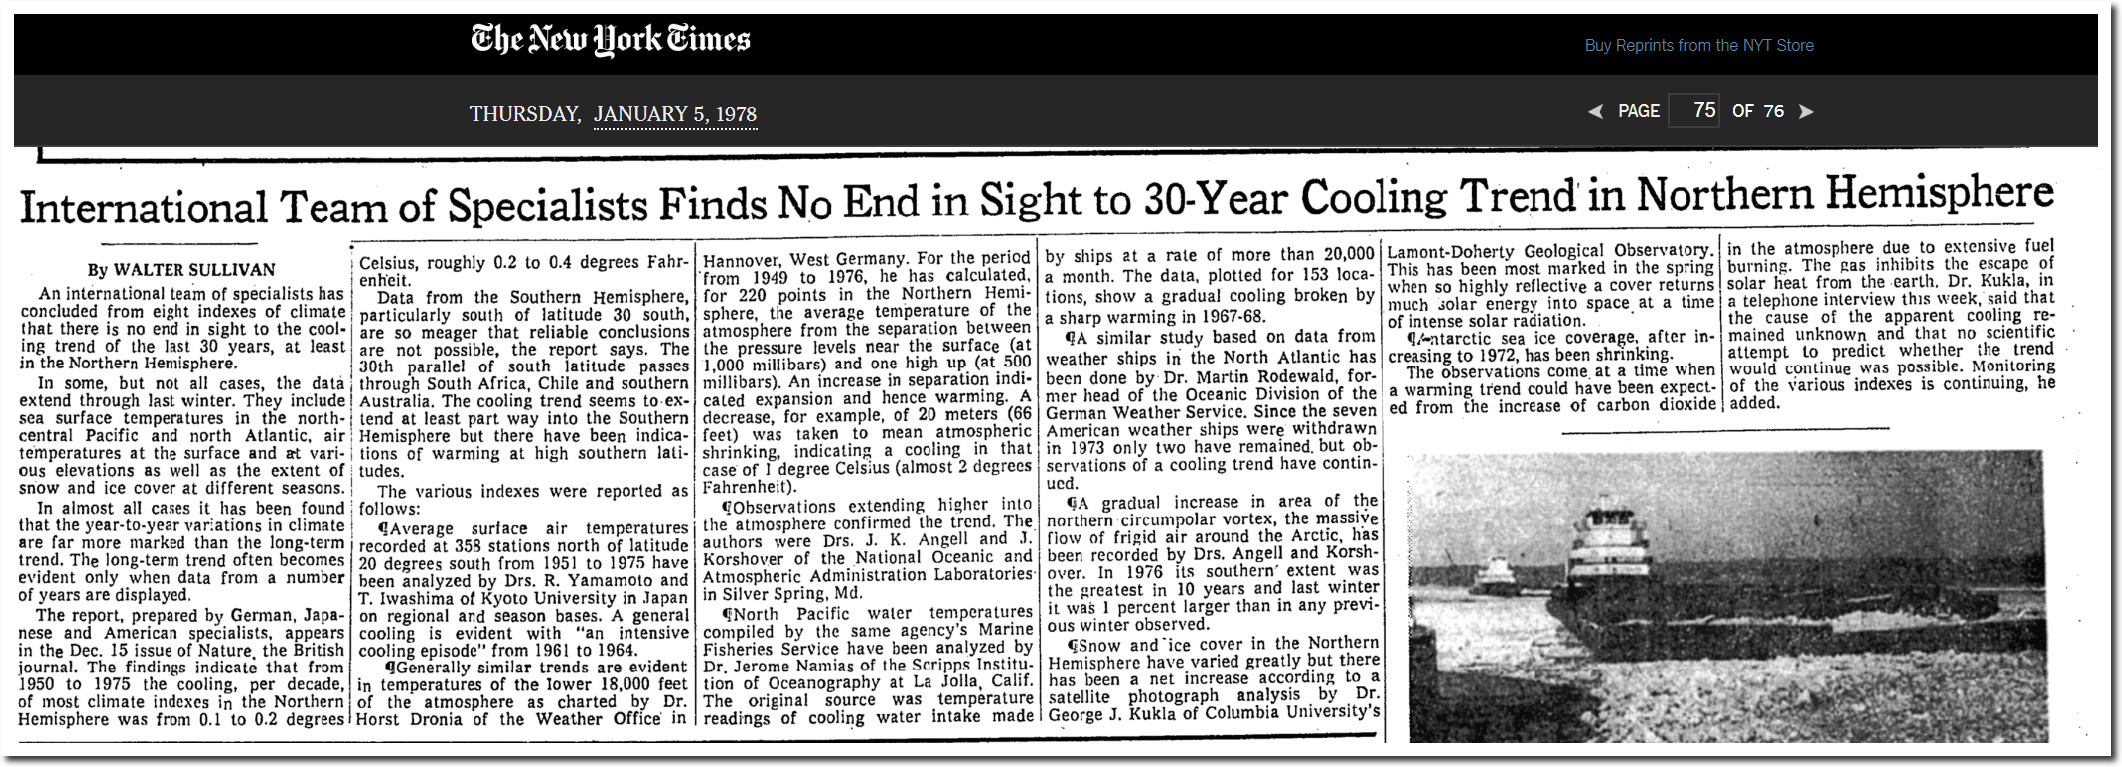
The Polar Vortex used to be evidence that a new ice age is setting in. Now it is evidence that the Earth is burning up.
Another Ice Age?
Time Magazine Monday, Jun 24, 1974
Scientists have found other indications of global cooling. For one thing there has been a noticeable expansion of the great belt of dry, high-altitude polar winds —the so-called circumpolar vortex
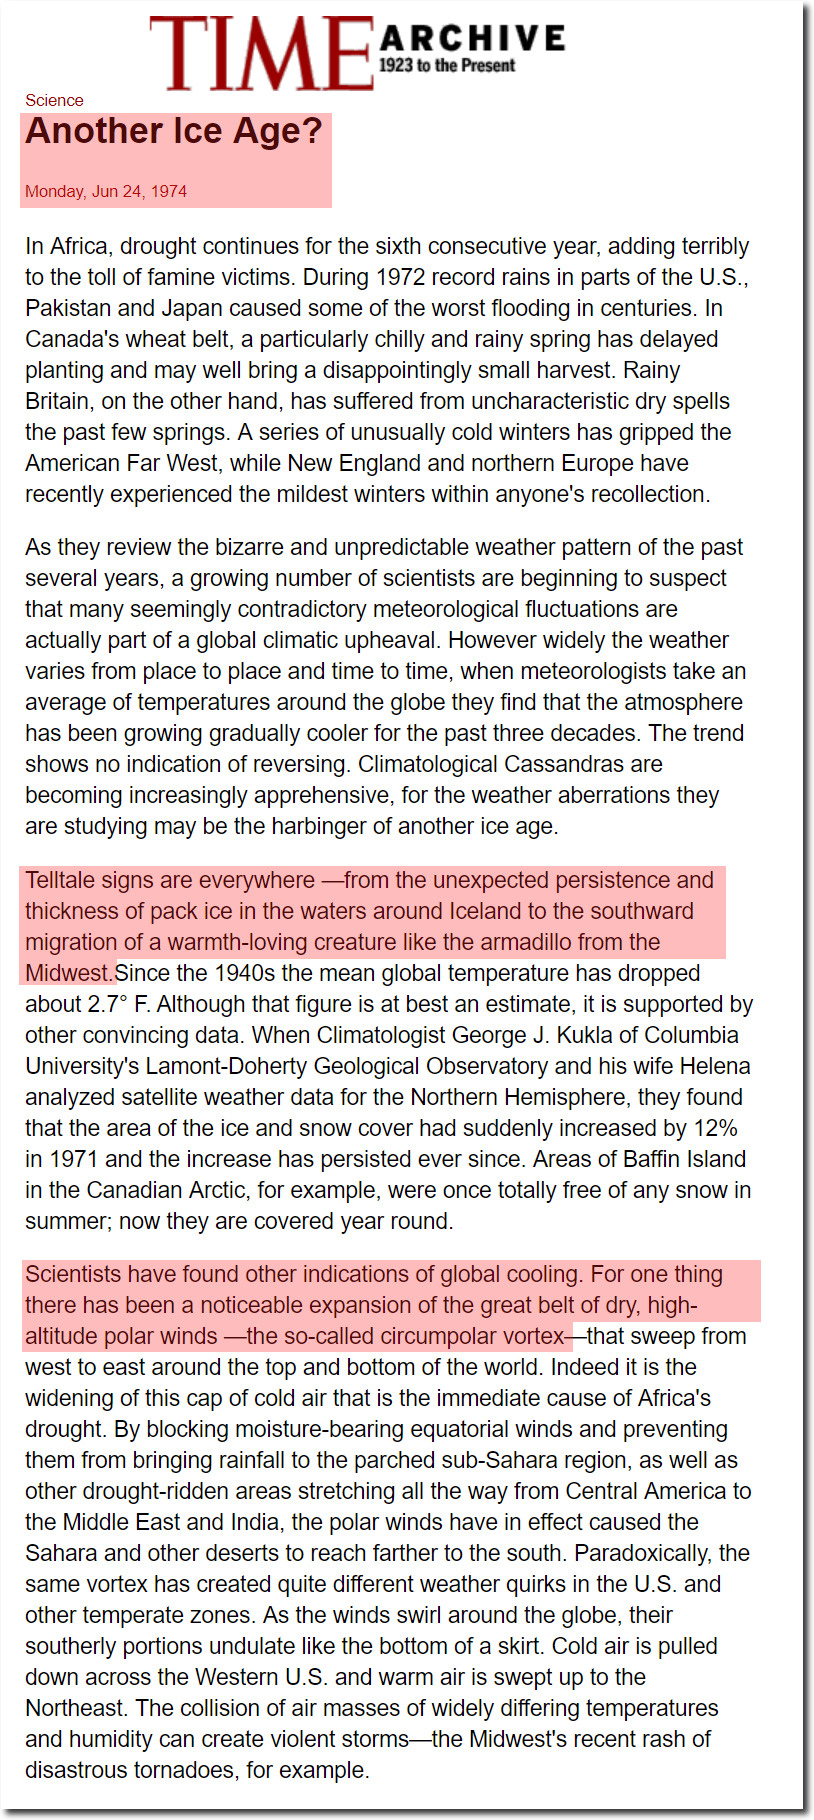
TIME Magazine Archive Article — Another Ice Age? — Jun. 24, 1974

Posted in Uncategorized
Leave a comment