Pronghorn off I-25 in Cheyenne
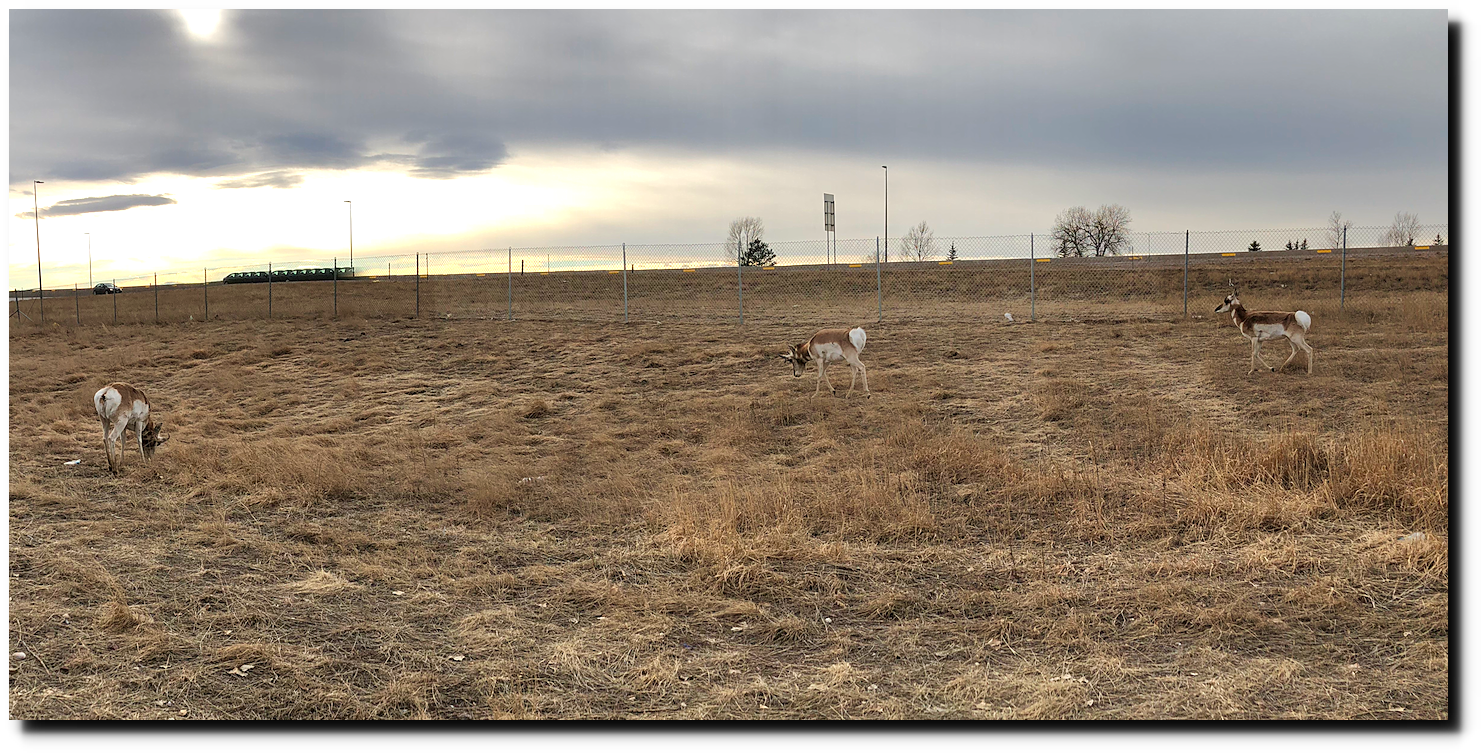
Pronghorn off I-25 in Cheyenne
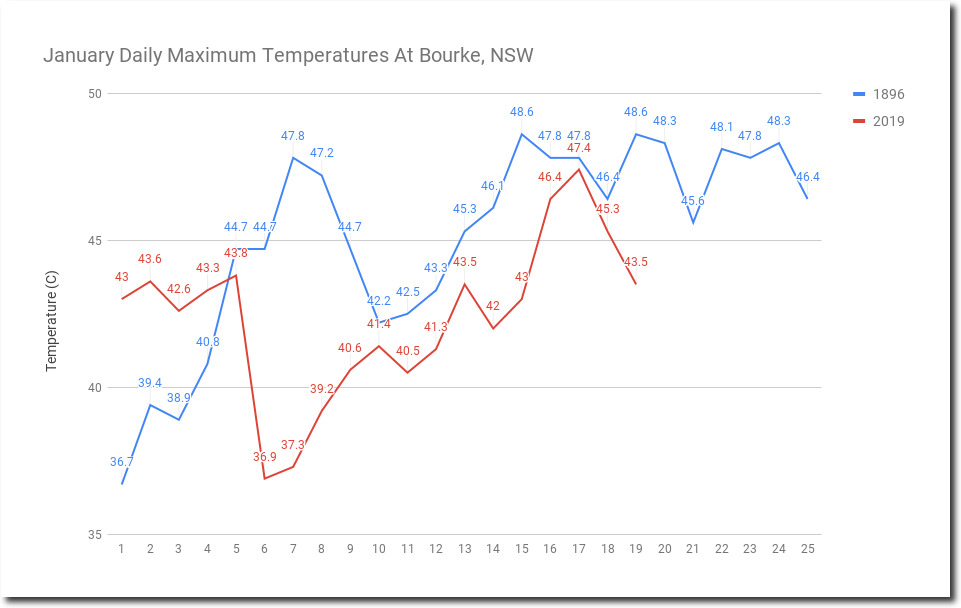
January 1-19, 1896 averaged 2C hotter than this year at Bourke, NSW.
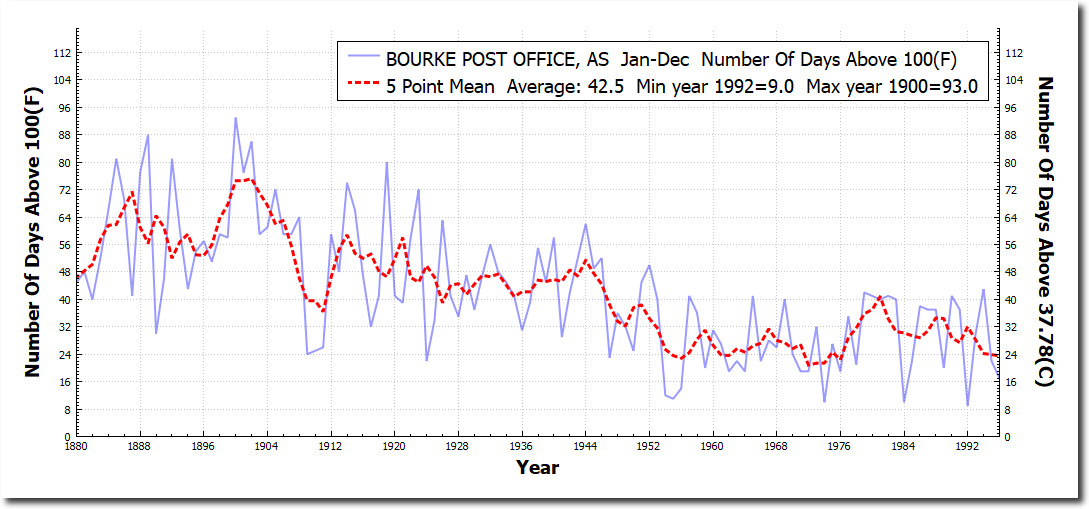
The number of 100F (38C) days at Bourke plummeted from 1880 until the station shut down in 1996.
In 2006, the New York Times announced the “endless summer.”
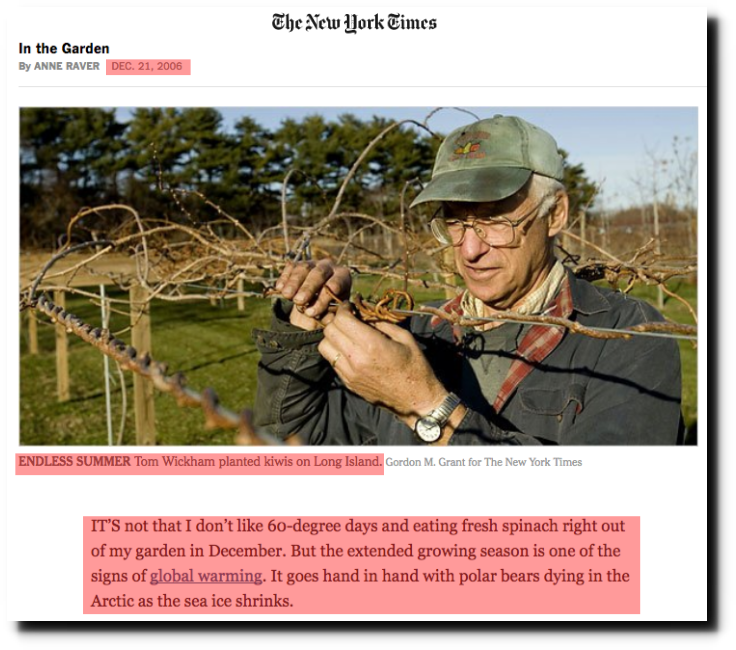
With Warmer Weather, Different Decisions to Make – The New York Times
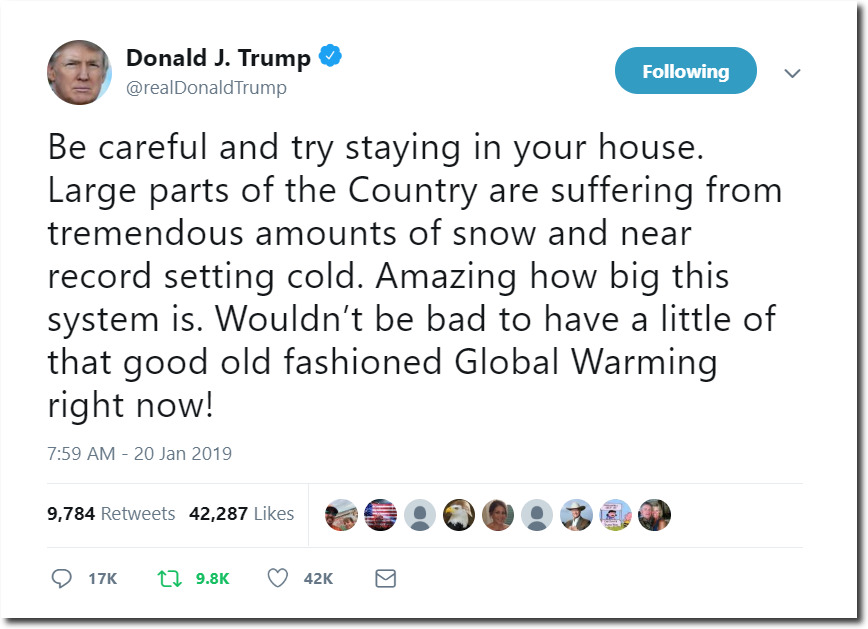
That didn’t work out very well for them, so now they are blaming the cold and snow on global warming and shrinking Arctic ice.
Some researchers, including Dr. Francis and Dr. Cohen, say they suspect that the more frequent polar vortex breakdowns can be tied to climate change.
the Arctic is warming at a rate twice as fast as the world average. That warming has led to historically low levels of sea ice in the region. The melting sea ice, particularly in an area near the Barents and Kara Seas off Siberia, may be linked to the changes in the polar vortex.

Brace for the Polar Vortex: It May Be Visiting More Often – The New York Times
Forty years ago, they blamed the polar vortex on global cooling, and increasing Arctic ice.
International Team of Specialists Finds No End in Sight to 30?Year Cooling Trend in Northern Hemisphere
By WALTER SULLIVAN JAN. 5, 1978
A gradual increase in area of the northern circumpolar vortex, the massive flow of frigid air around the Arctic, has been recorded by Drs. Angell and Korshover. In 1976 its southern’ extent was the greatest in 10 years and last winter it was 1 percent larger than in any previous winter observed.
Snow and ice cover in the Northern Hemisphere have varied greatly but there has been a net increase according to a satellite photograph analysis by Dr George J. Kukla of Columbia University’s Lamont?Doherty Geological Observatory. This has been most marked in the spring when so highly reflective a cover returns much solar energy into space at a time of intense solar radiation.
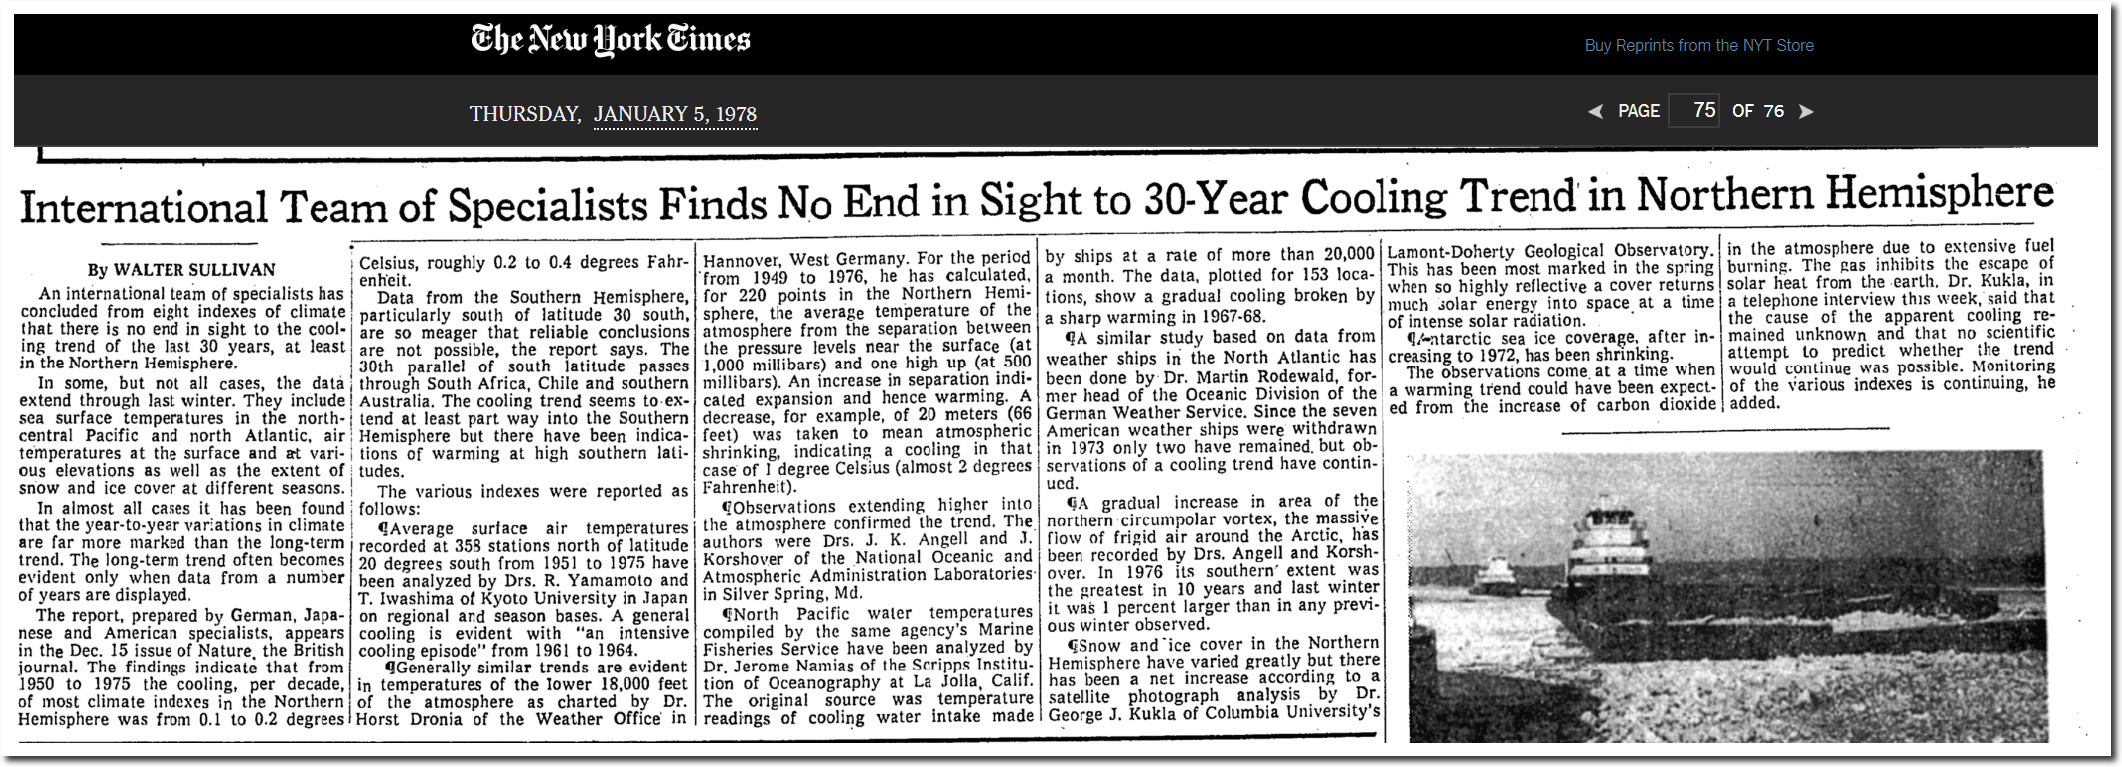
The Polar Vortex used to be evidence that a new ice age is setting in. Now it is evidence that the Earth is burning up.
Another Ice Age?
Time Magazine Monday, Jun 24, 1974
Scientists have found other indications of global cooling. For one thing there has been a noticeable expansion of the great belt of dry, high-altitude polar winds —the so-called circumpolar vortex
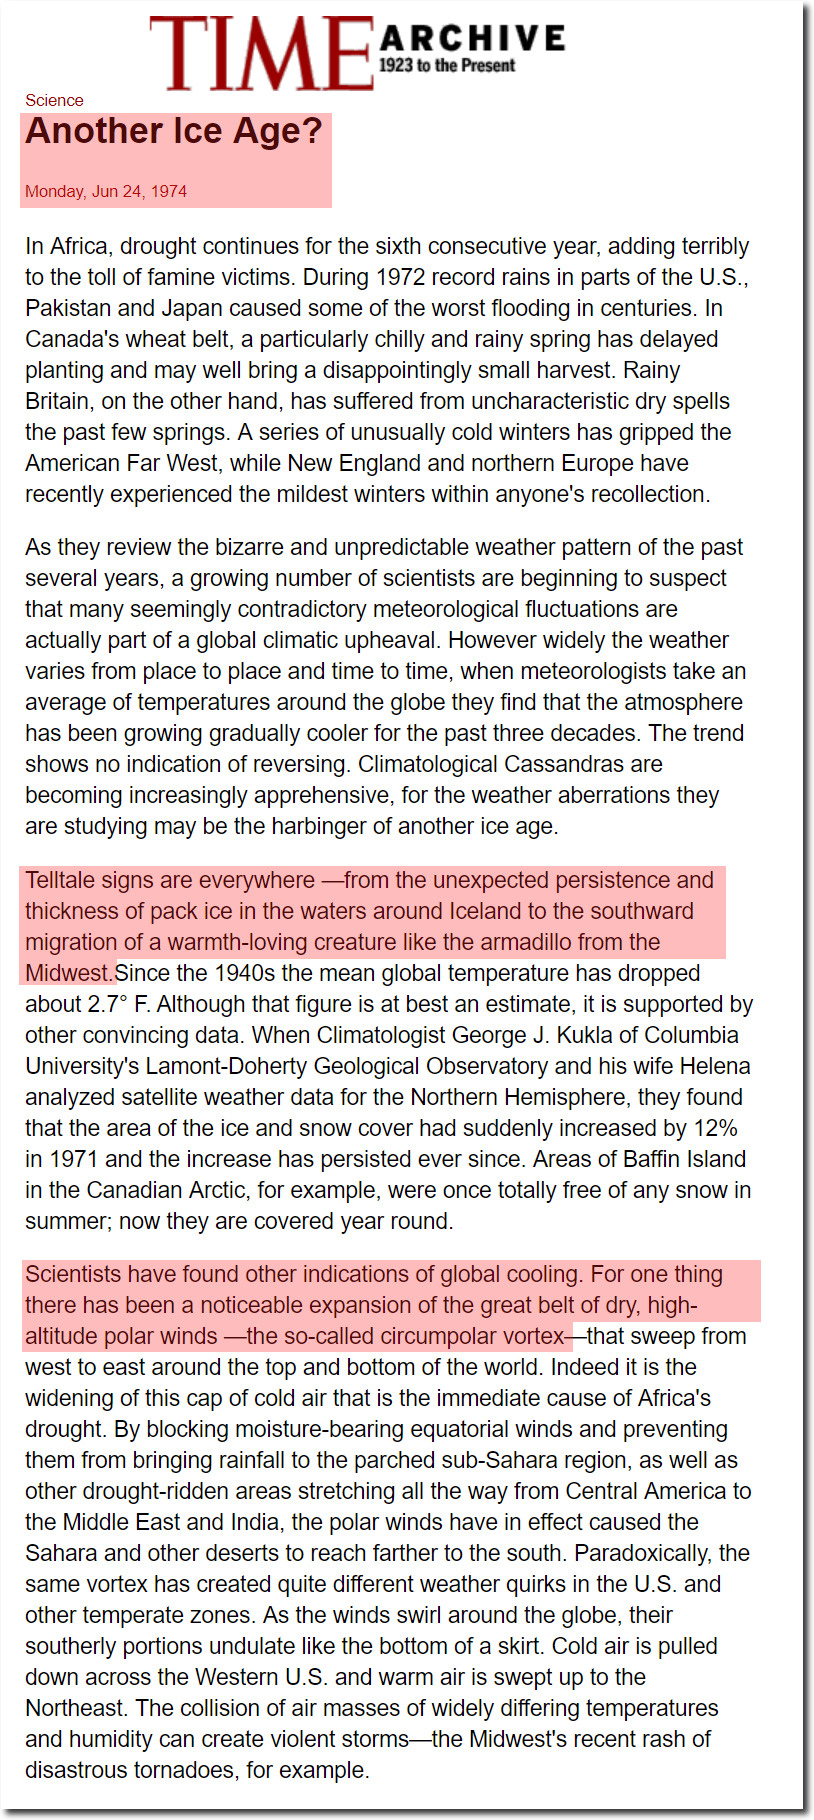
TIME Magazine Archive Article — Another Ice Age? — Jun. 24, 1974
Twelve years ago, the New York Times announced the “Endless Summer” and said “It goes hand in hand with polar bears dying in the Arctic as the sea ice shrinks.”
With Warmer Weather, Different Decisions to Make – The New York Times
The New York Times endless summer looks more like a long-term deep freeze.
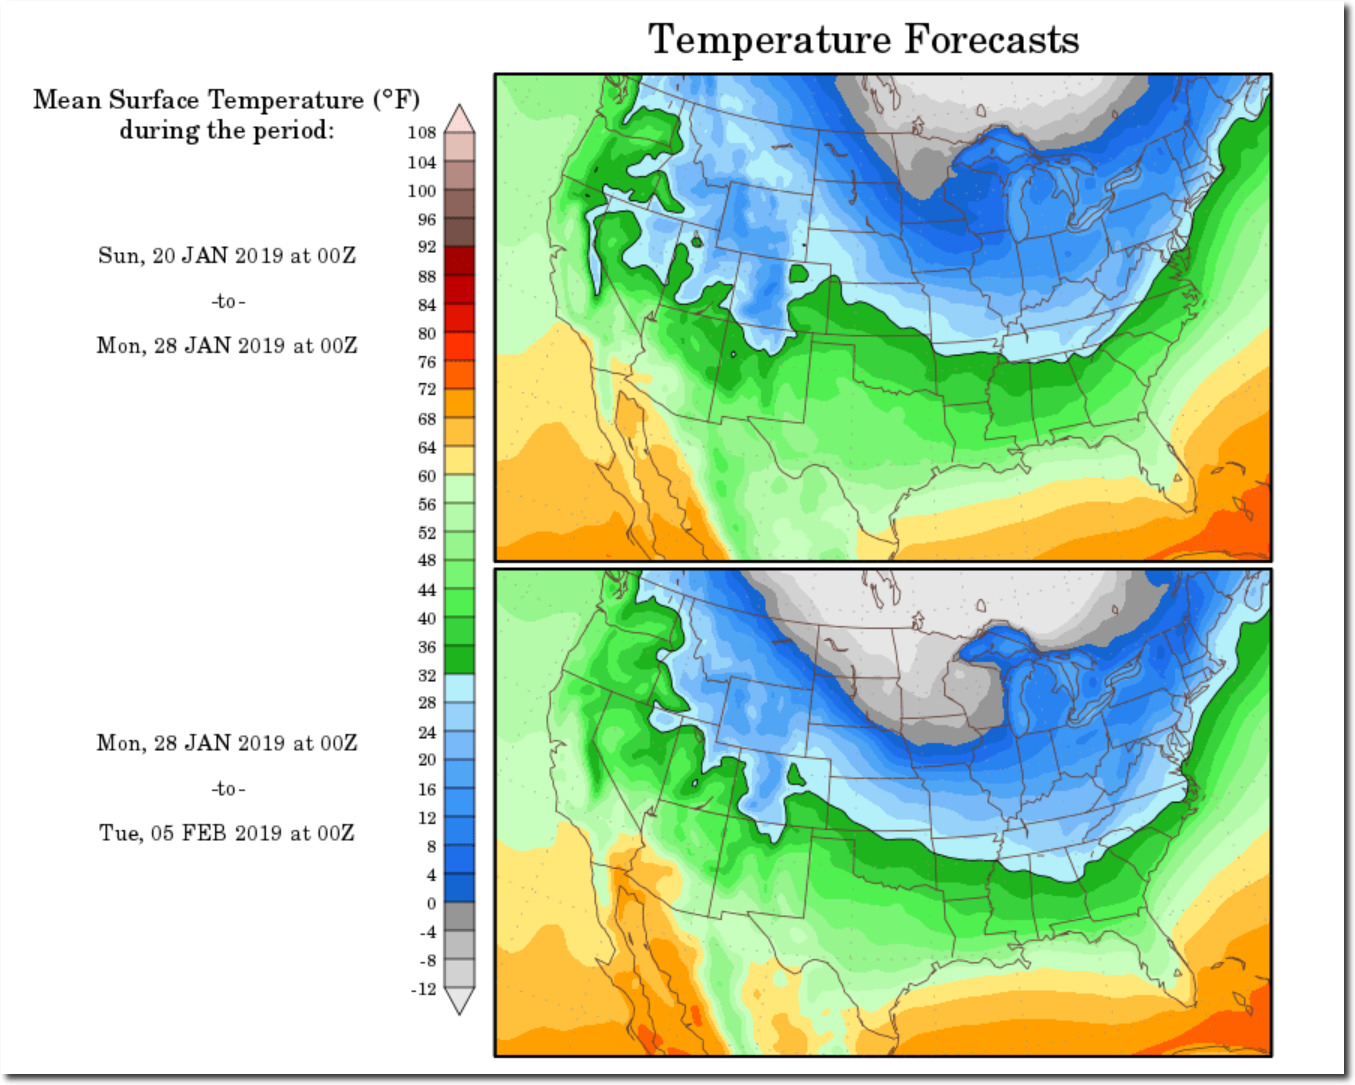
10-Day Temperature Outlook for the Conterminous U.S.
There has been no trend in Arctic sea ice extent since the New York Times wrote that article.
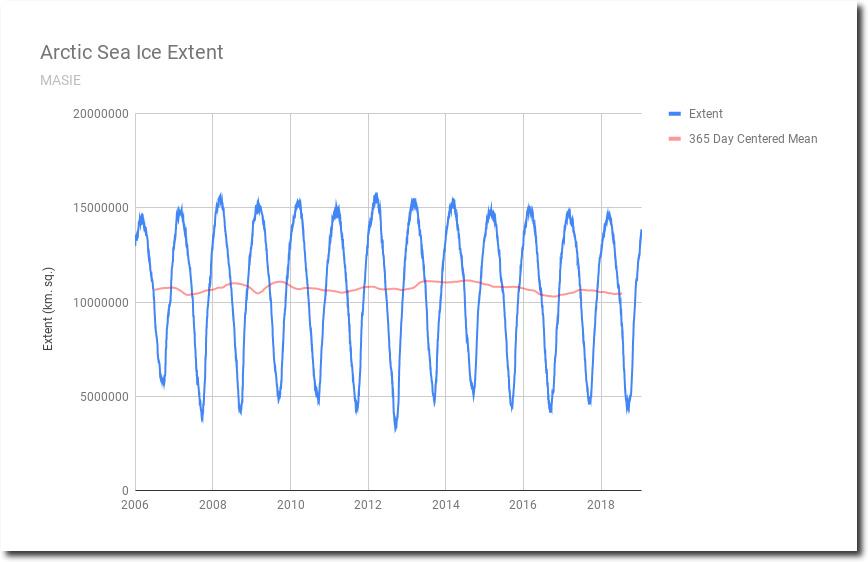
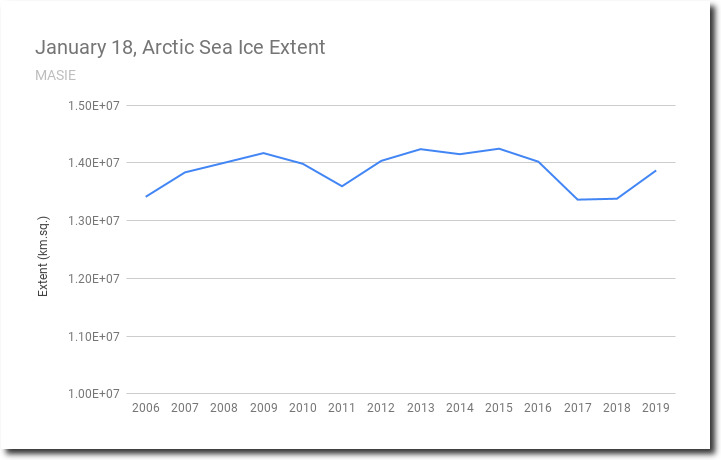
Polar bear populations are larger than they were 40 years ago.
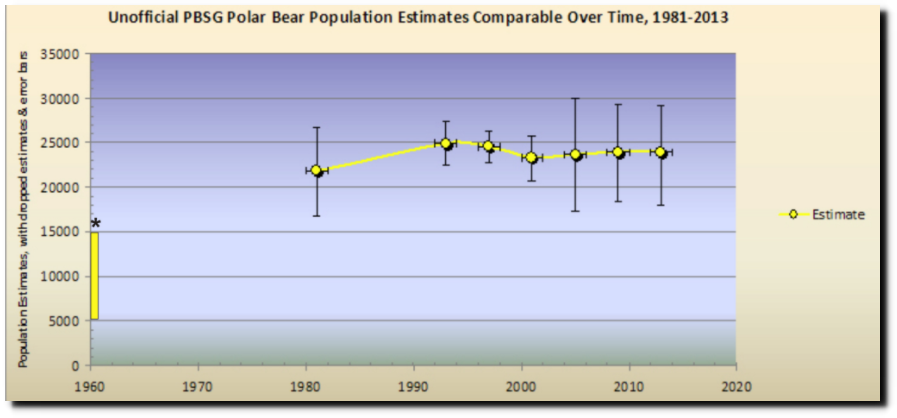
Twenty good reasons not to worry about polar bears | polarbearscience
Nothing in the New York Times article had anything to do with reality. But why should it it be different than any of their other reporting?
Berkeley Earth’s US temperature graph shows an impressive hockey stick.
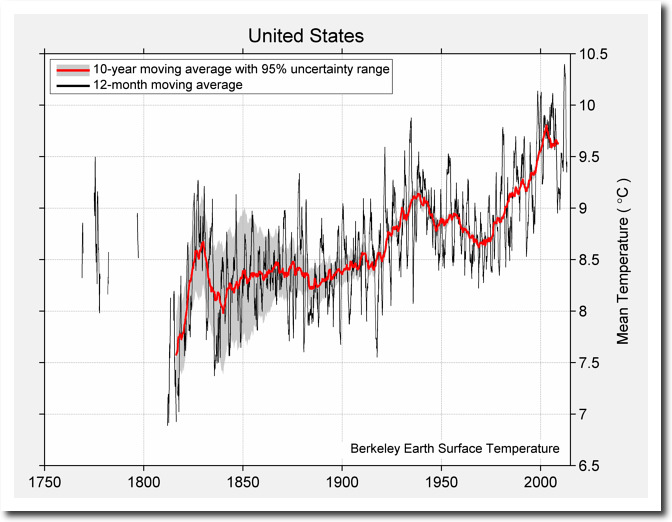
In 1989, NOAA said the US had not warmed over the past century. Berkeley Earth showed nearly 1C warming during that same period.
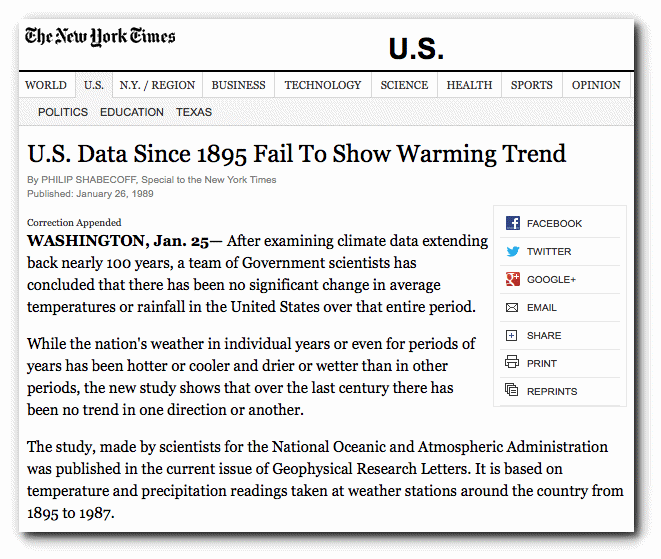
U.S. Data Since 1895 Fail To Show Warming Trend – NYTimes.com
In 1999, NASA showed the same thing – little or no net warming since 1895, with the 1930s as the hottest decade.
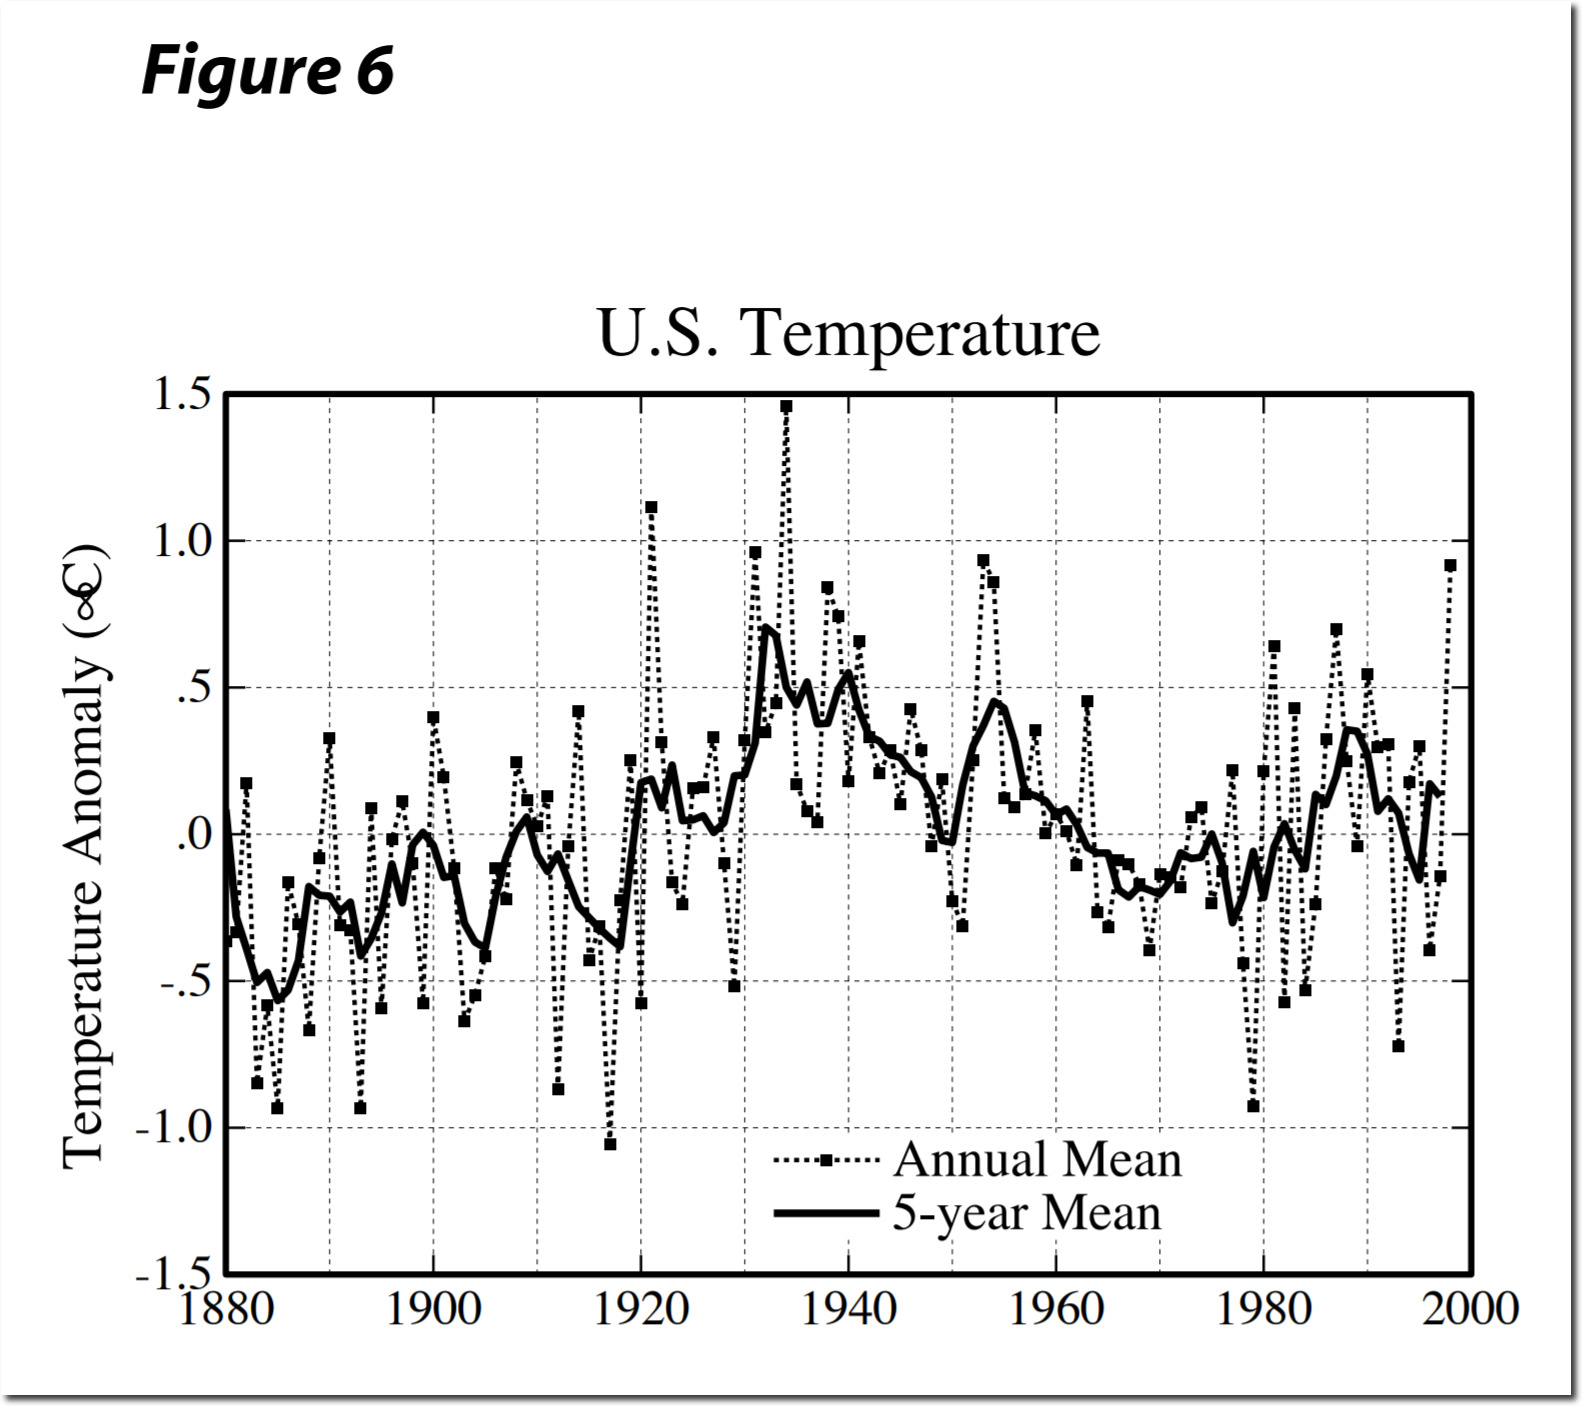
https://pubs.giss.nasa.gov/docs/1999/1999_Hansen_ha03200f.pdf
The USHCN raw data shows a cyclical pattern with no net warming over the past 80 years.
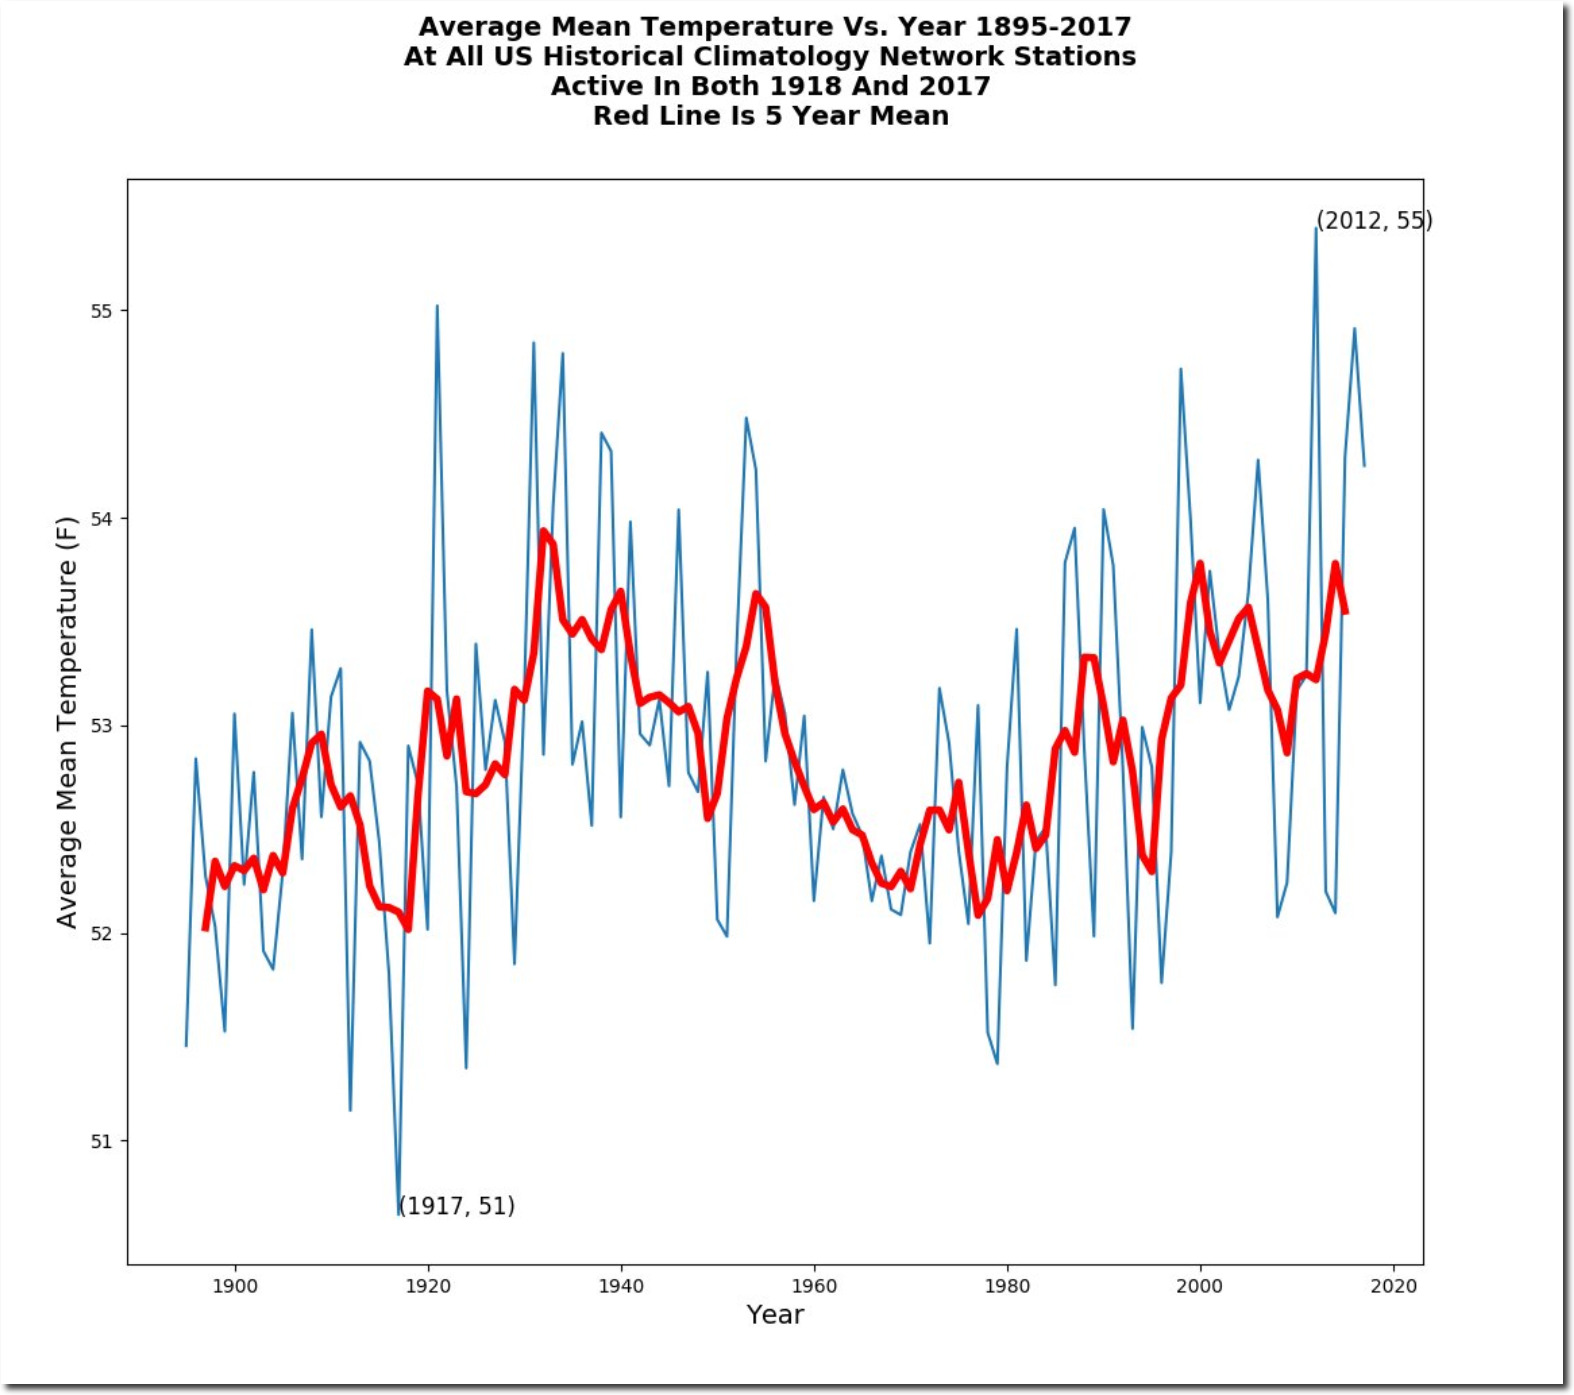
The graph below overlays The USHCN data and the Berkeley Earth data at the same X-Y scale. Their Y-axis temperatures are ridiculously low, so I normalized the Y-axis to the left side of the graph.
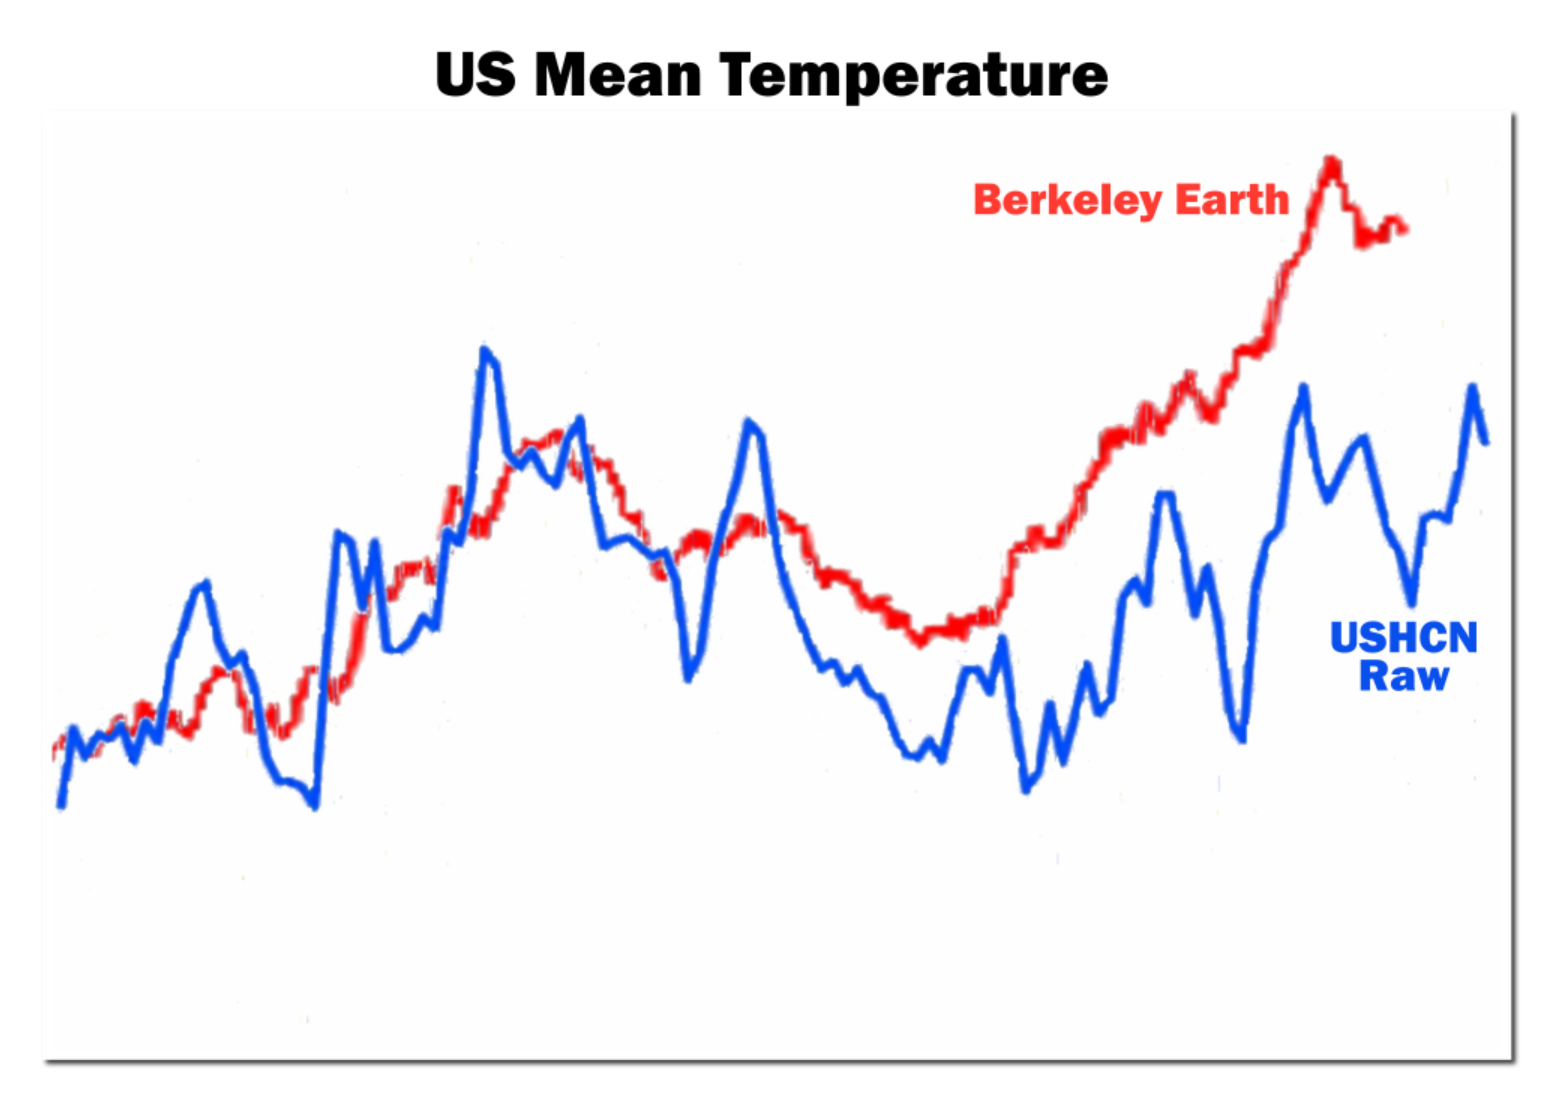
The USHCN raw temperatures closely match the NASA 1999 US temperature graph. But that didn’t fit the global warming agenda, so NASA altered the data.
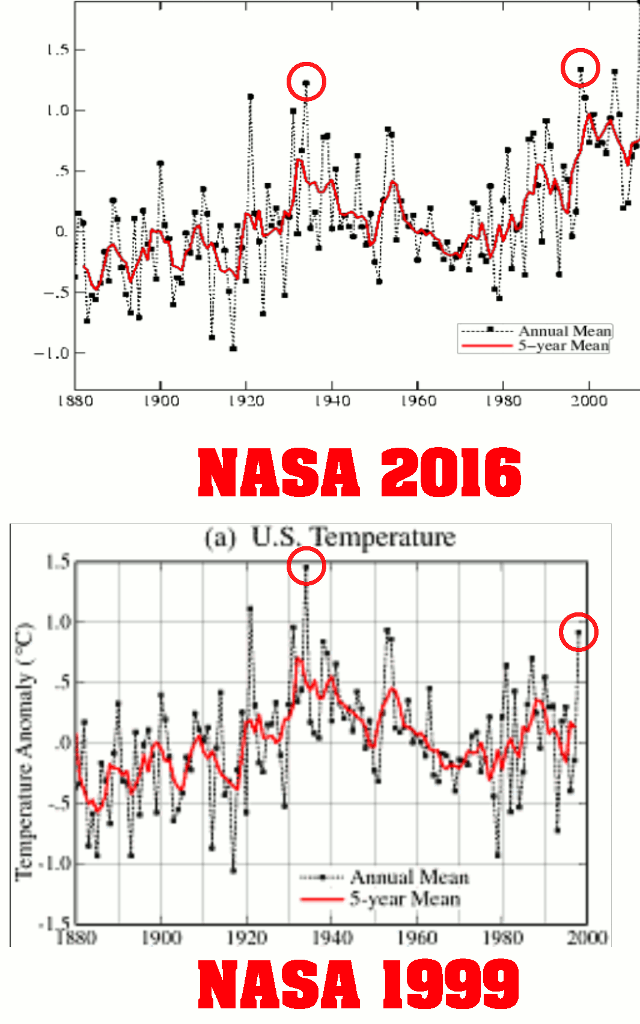
However, NASA data tampering pales by comparison to the garbage Berkeley Earth is producing,
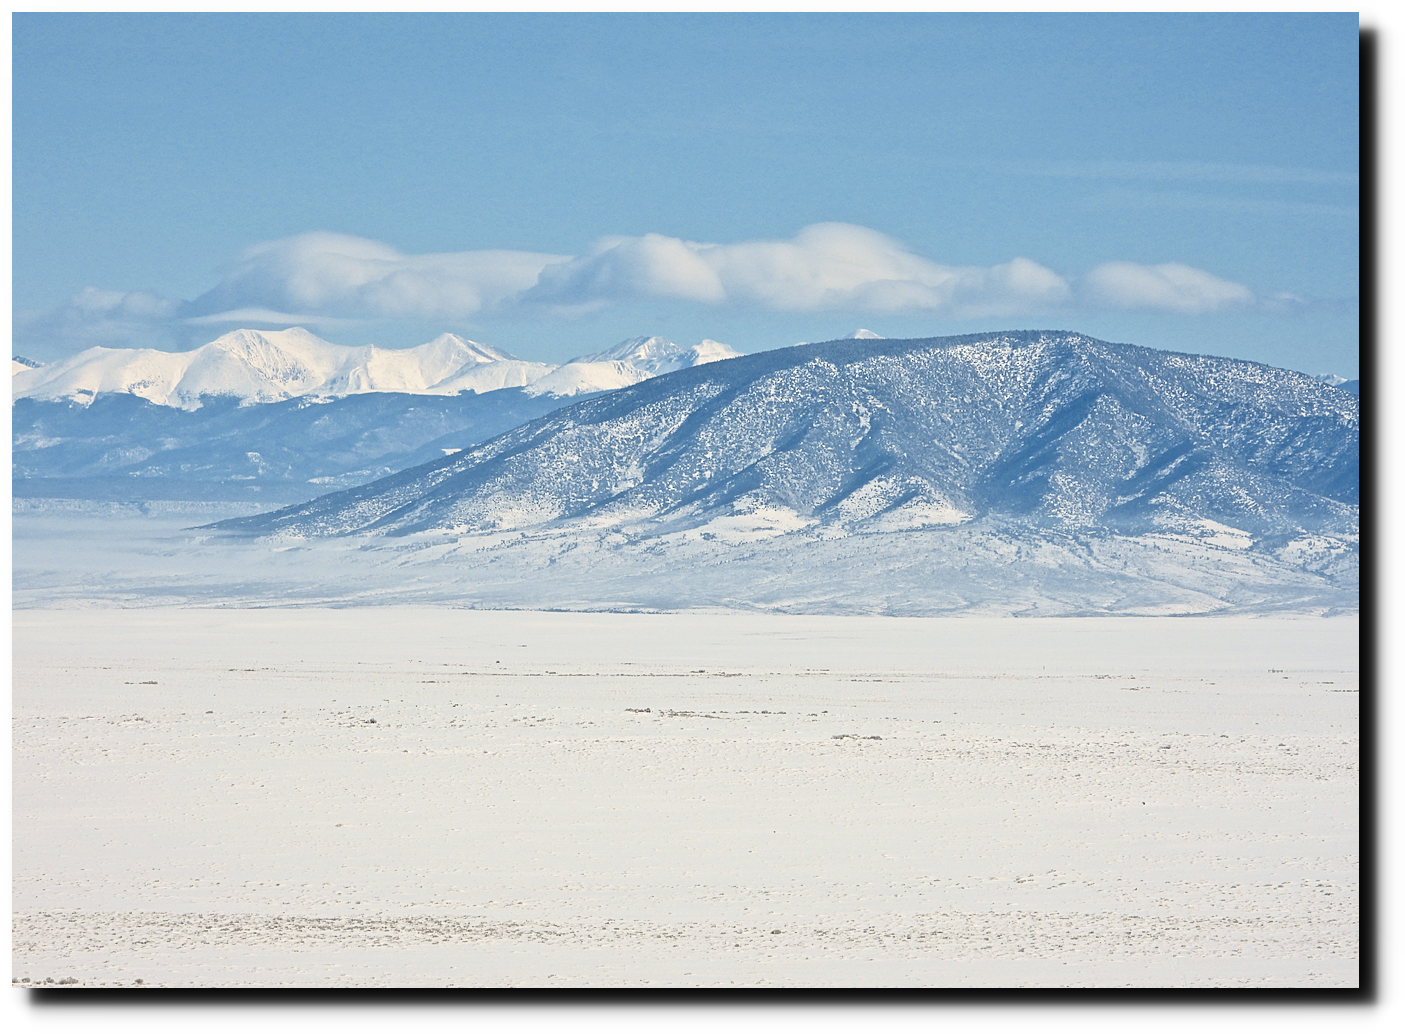
Downslope winds today, so very little atmospheric distortion.
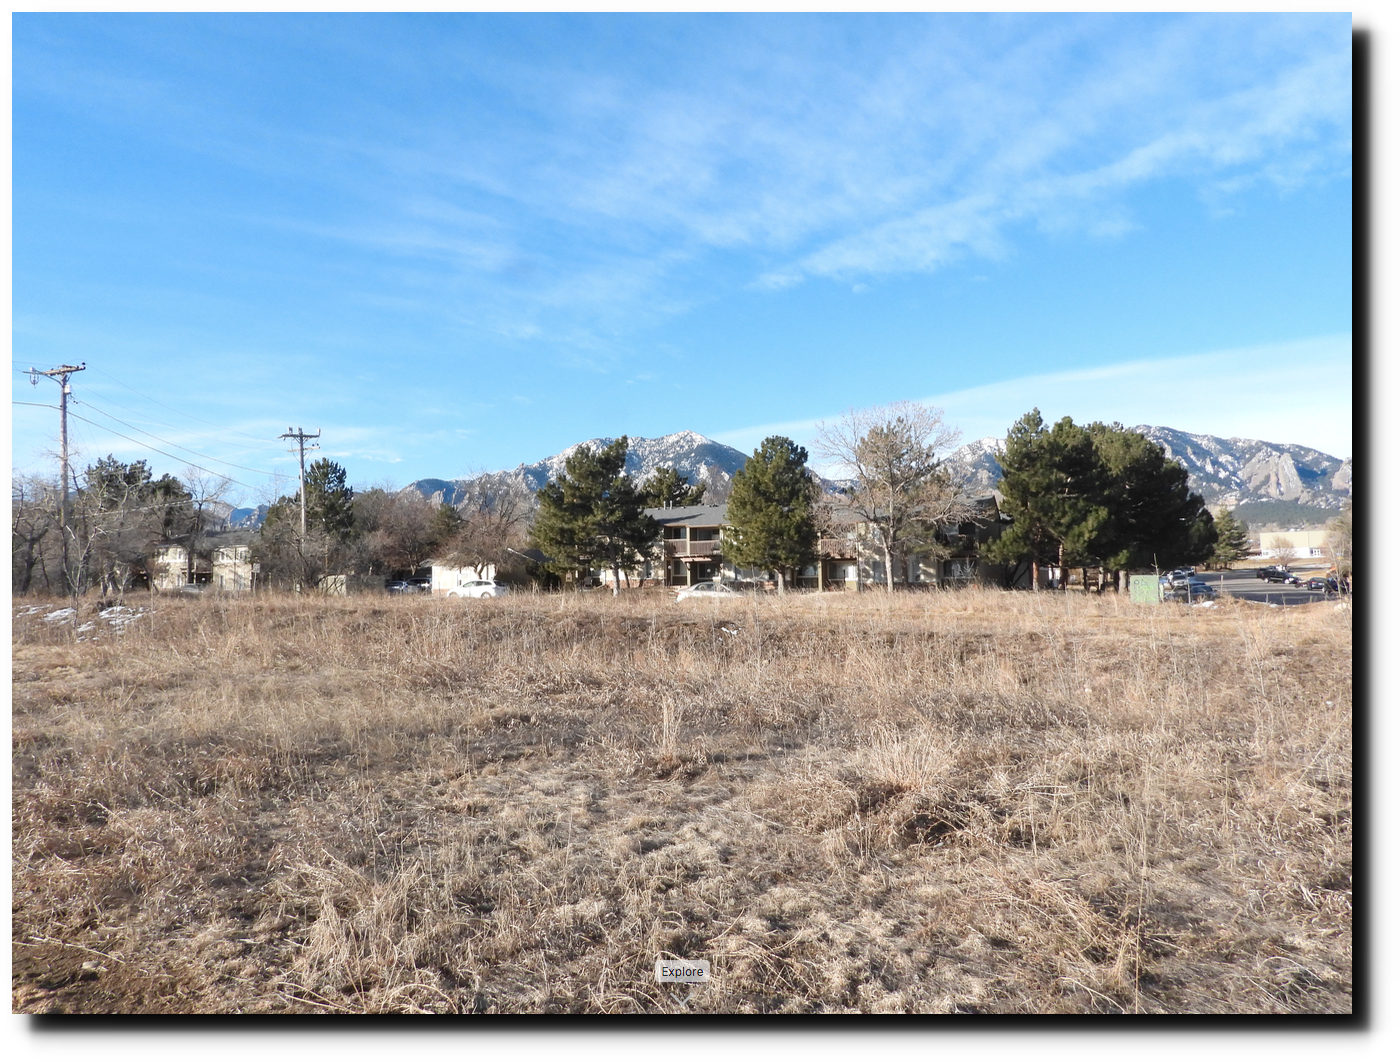
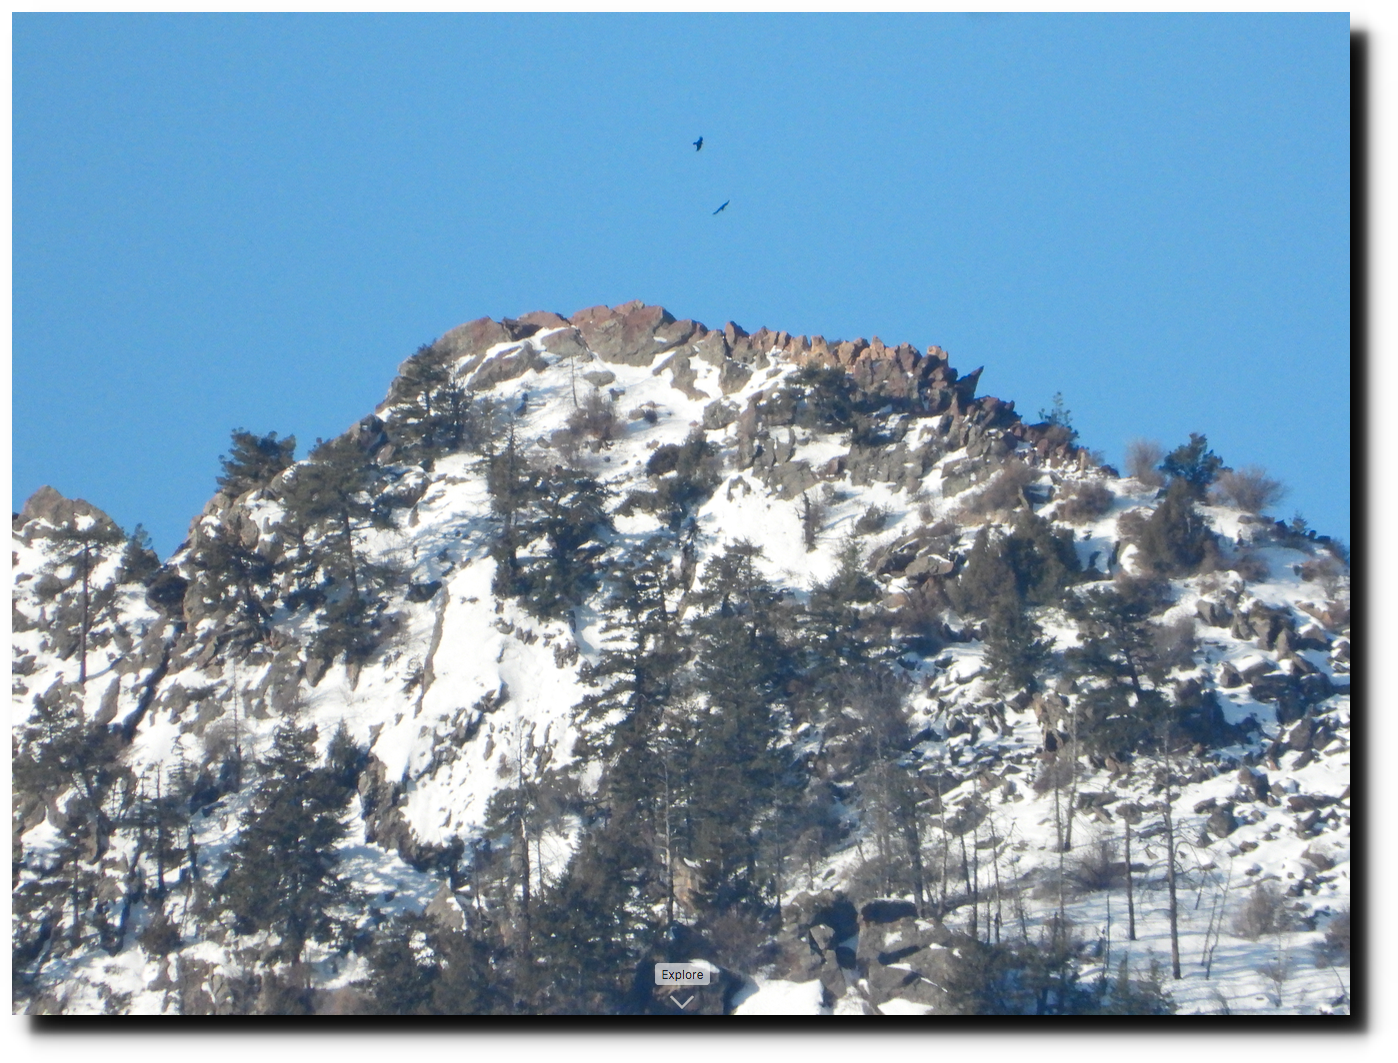
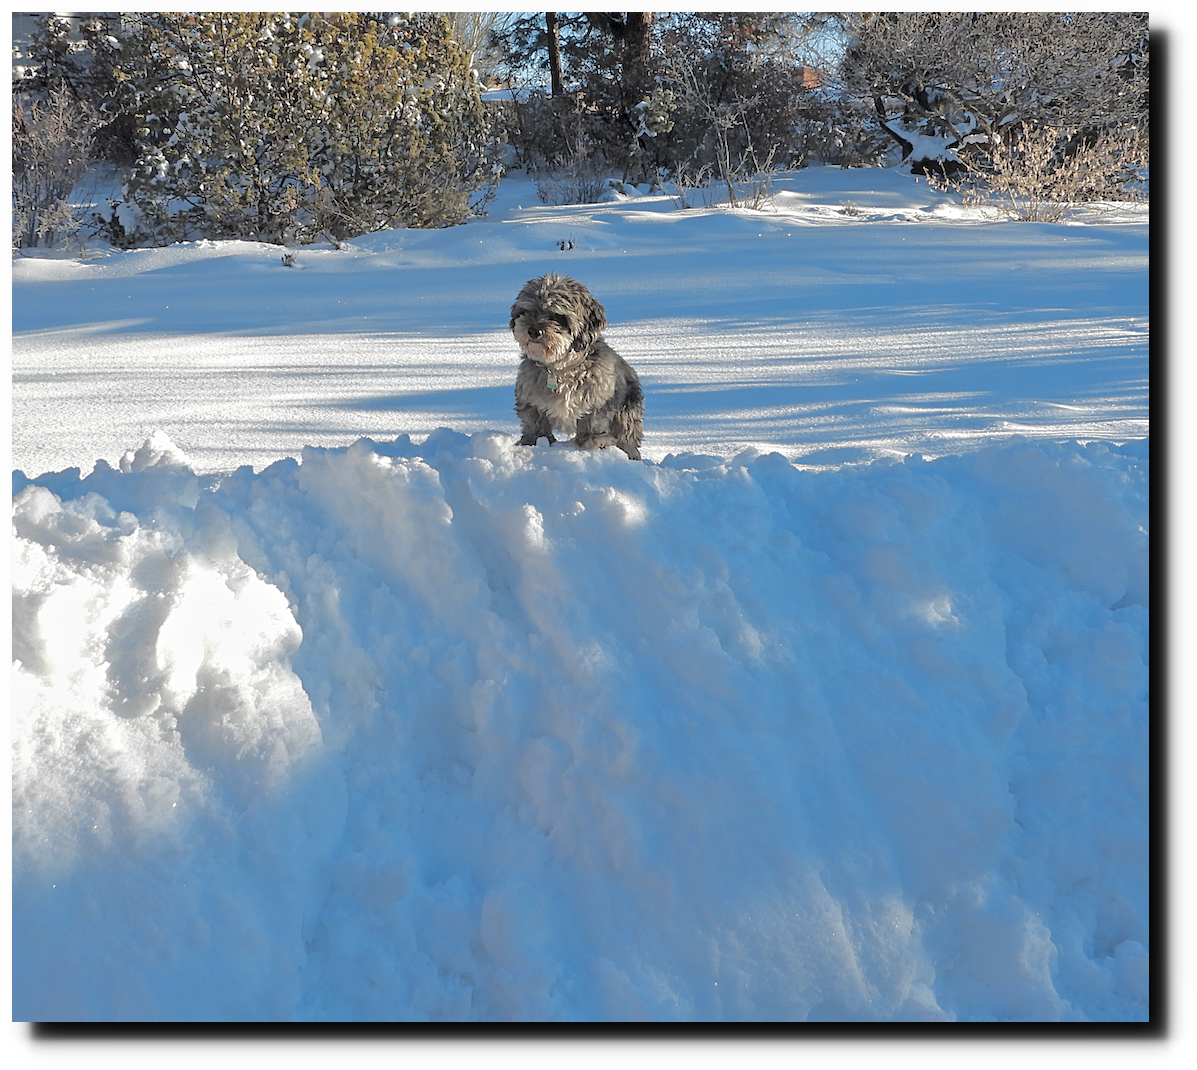
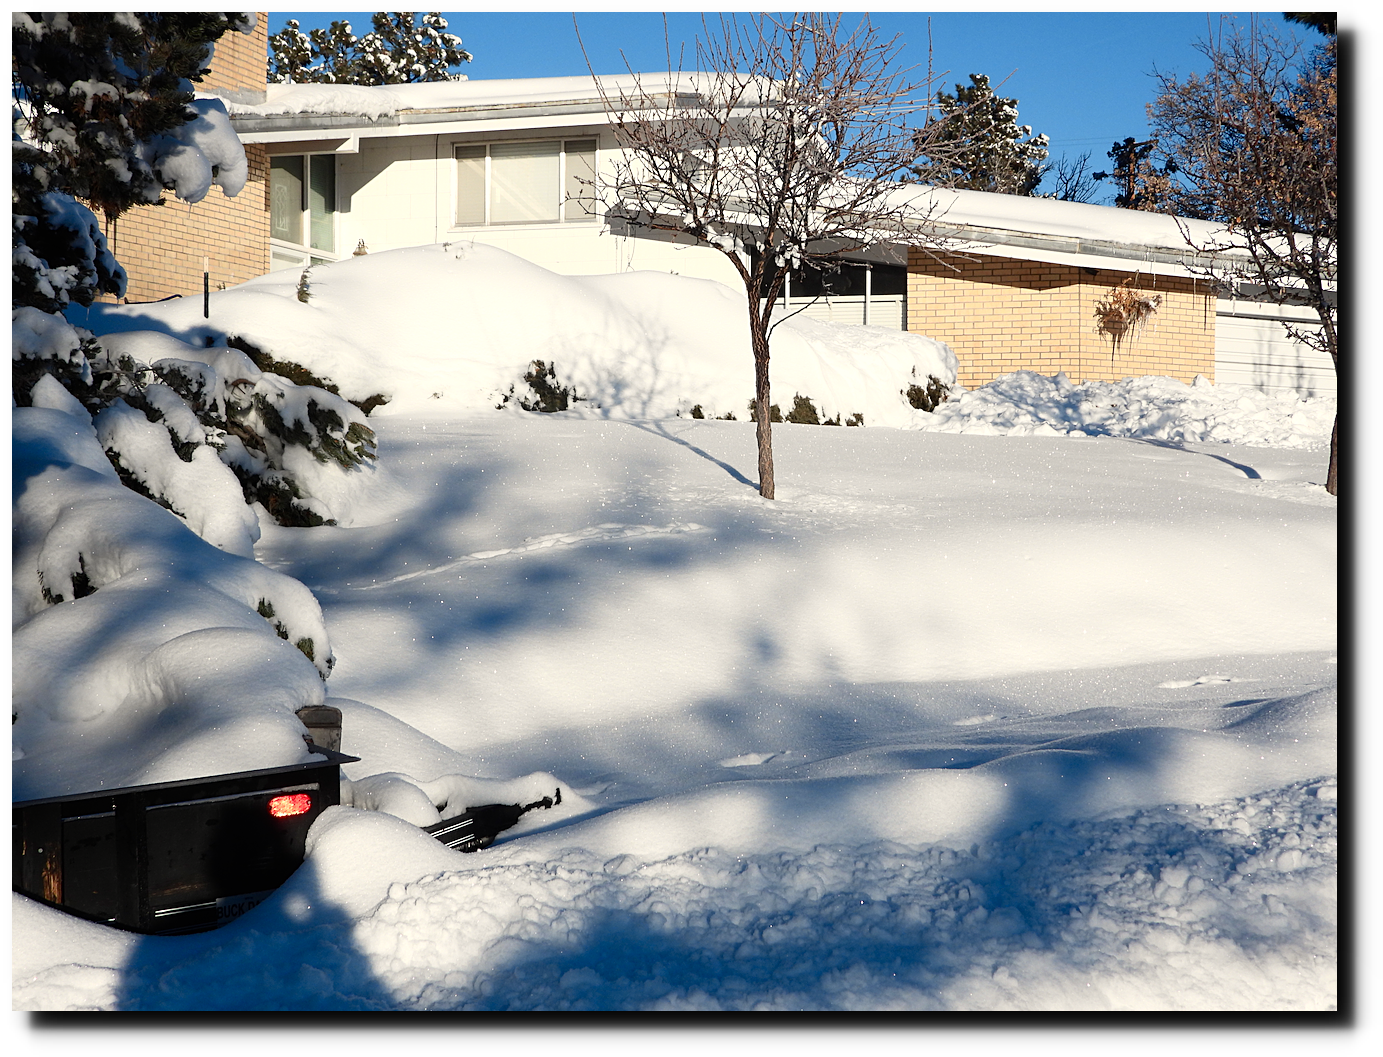
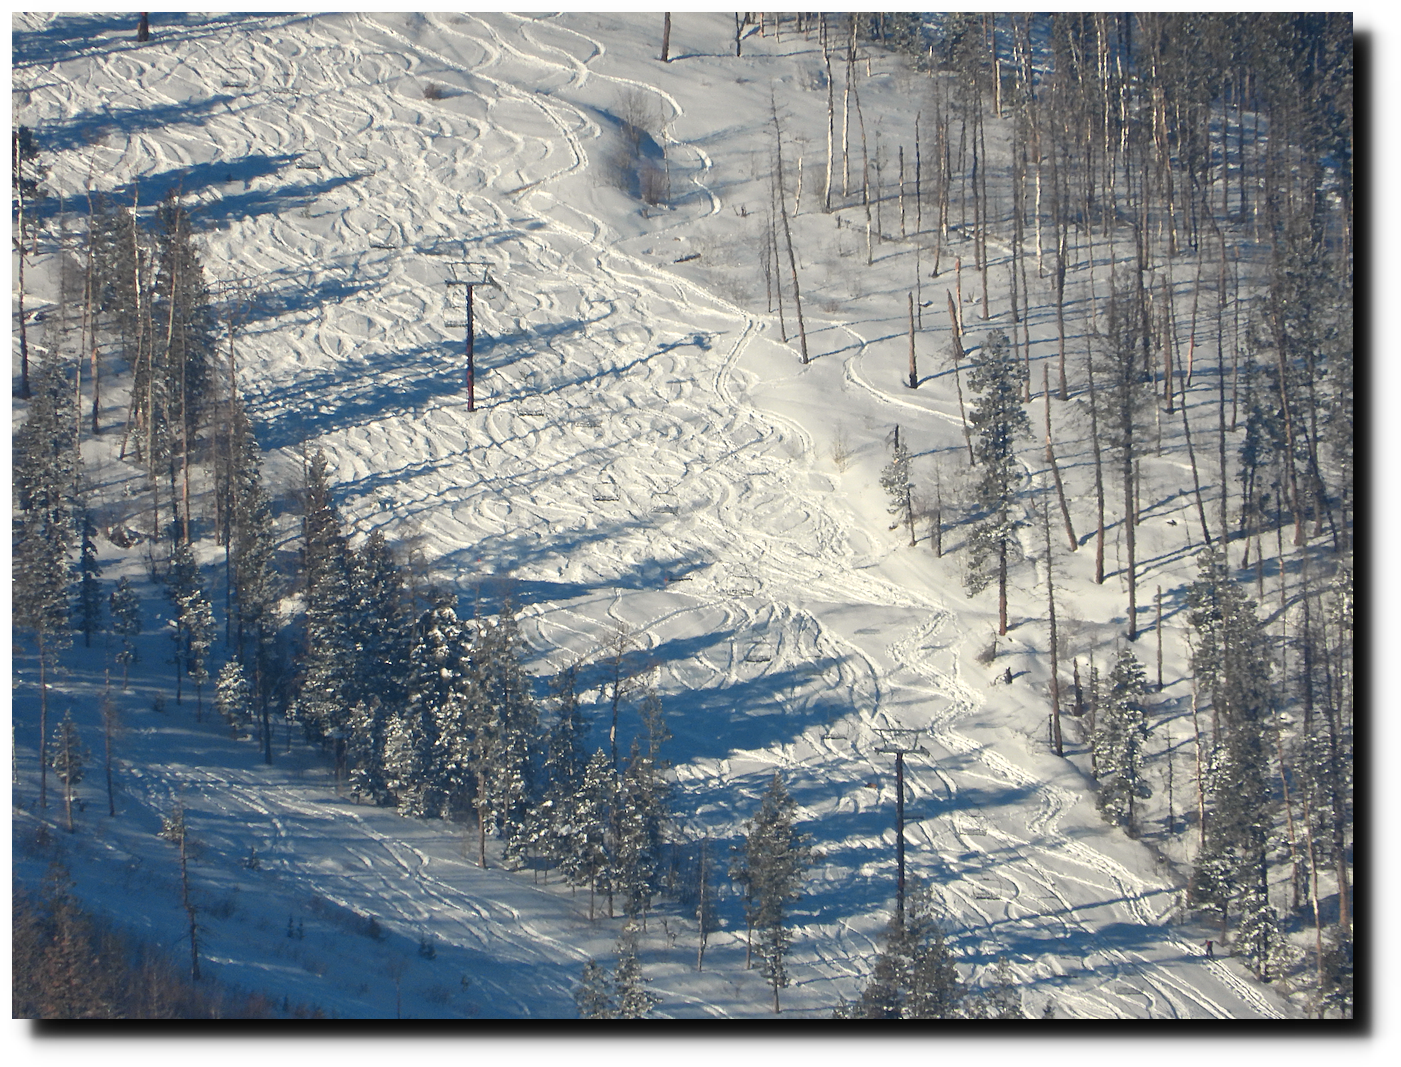
Toto was researching the permanent drought and end of snow in New Mexico yesterday. Los Alamos has had nearly four feet of snow in the past month, and are expecting more later this week.
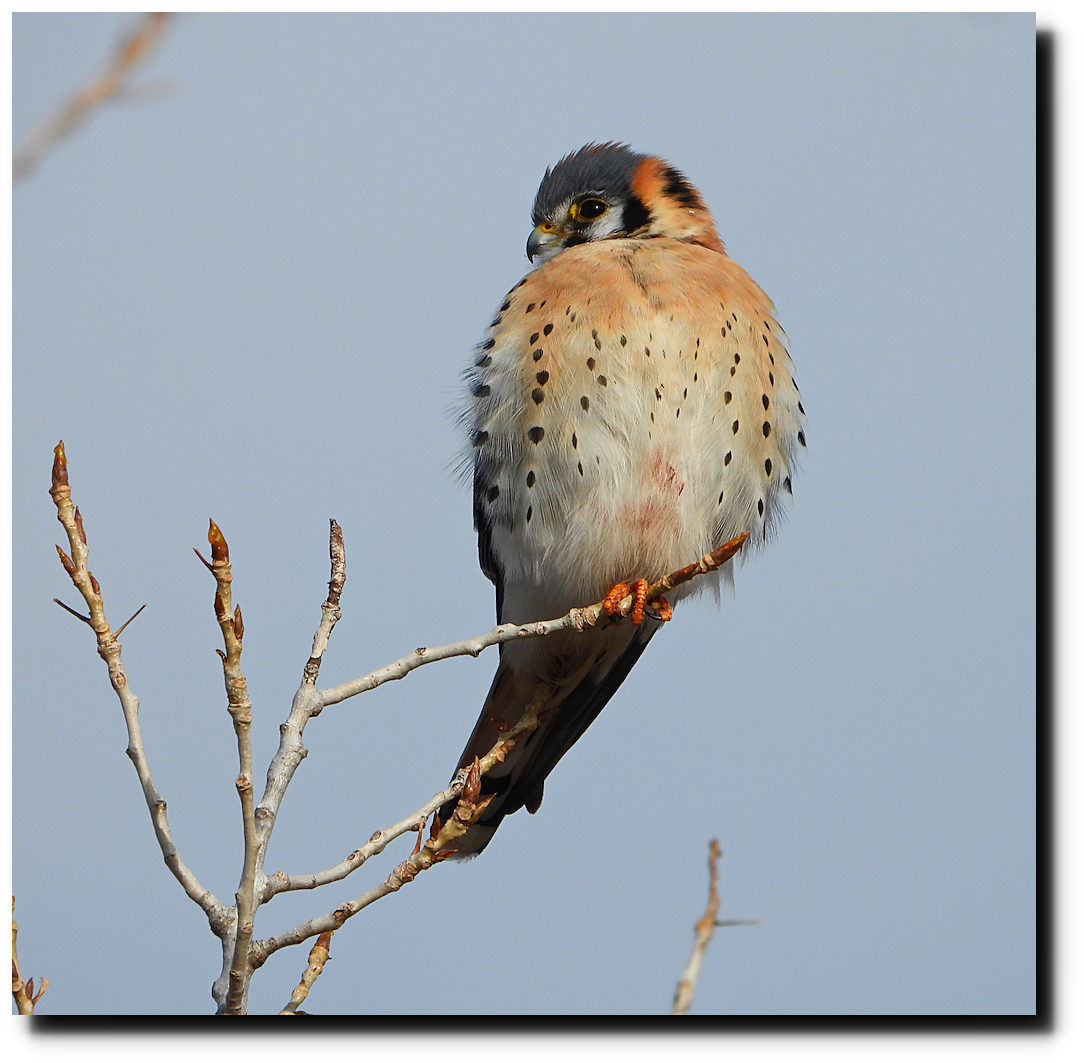
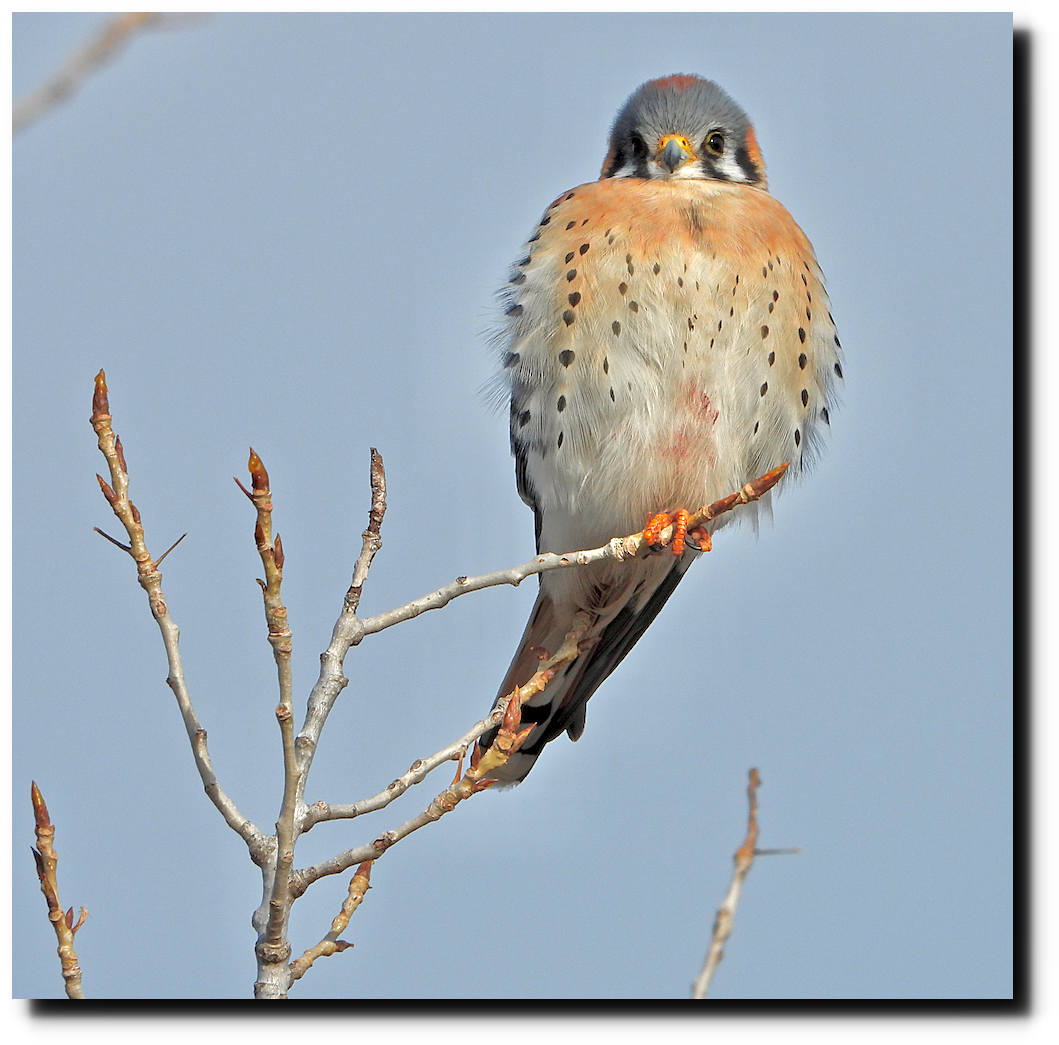
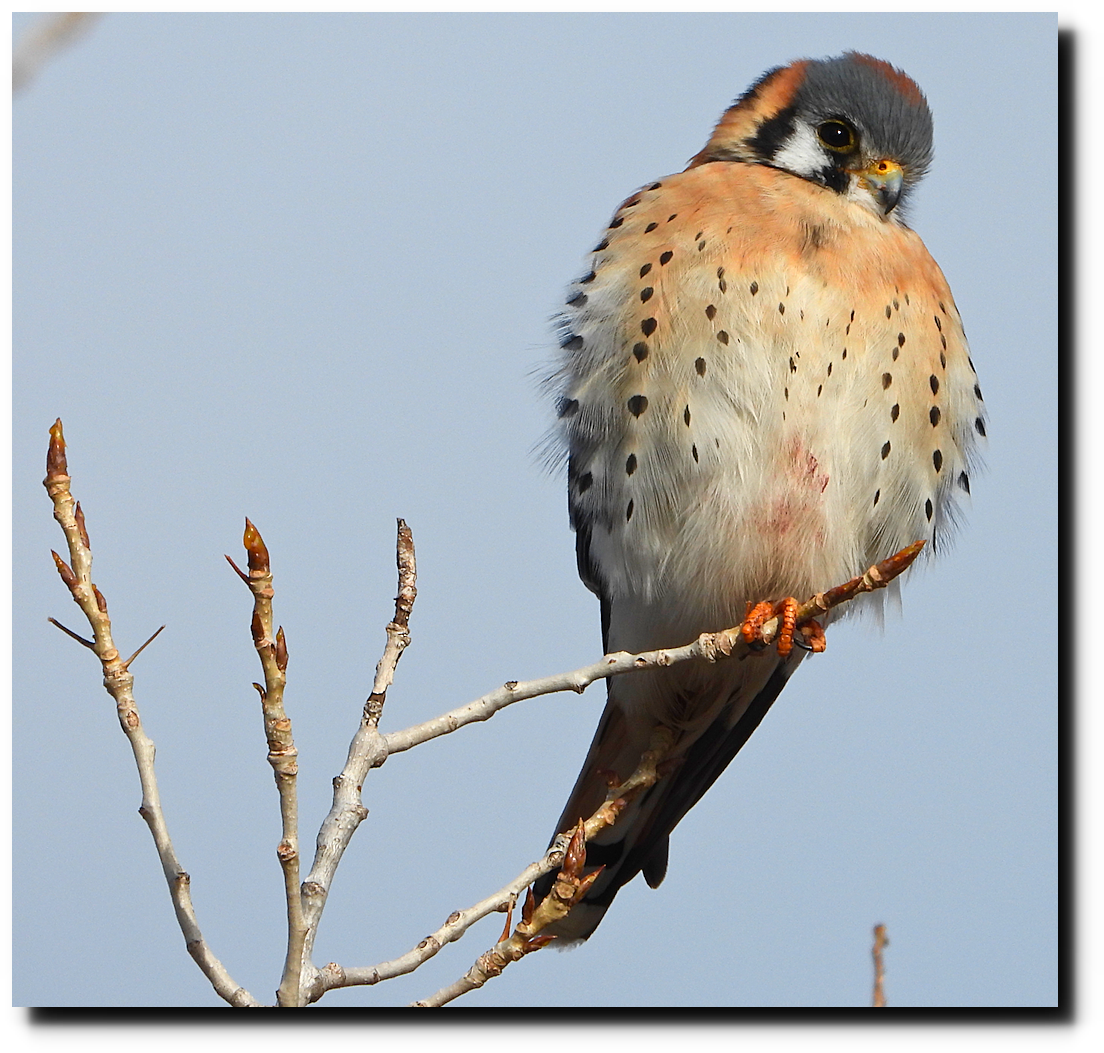
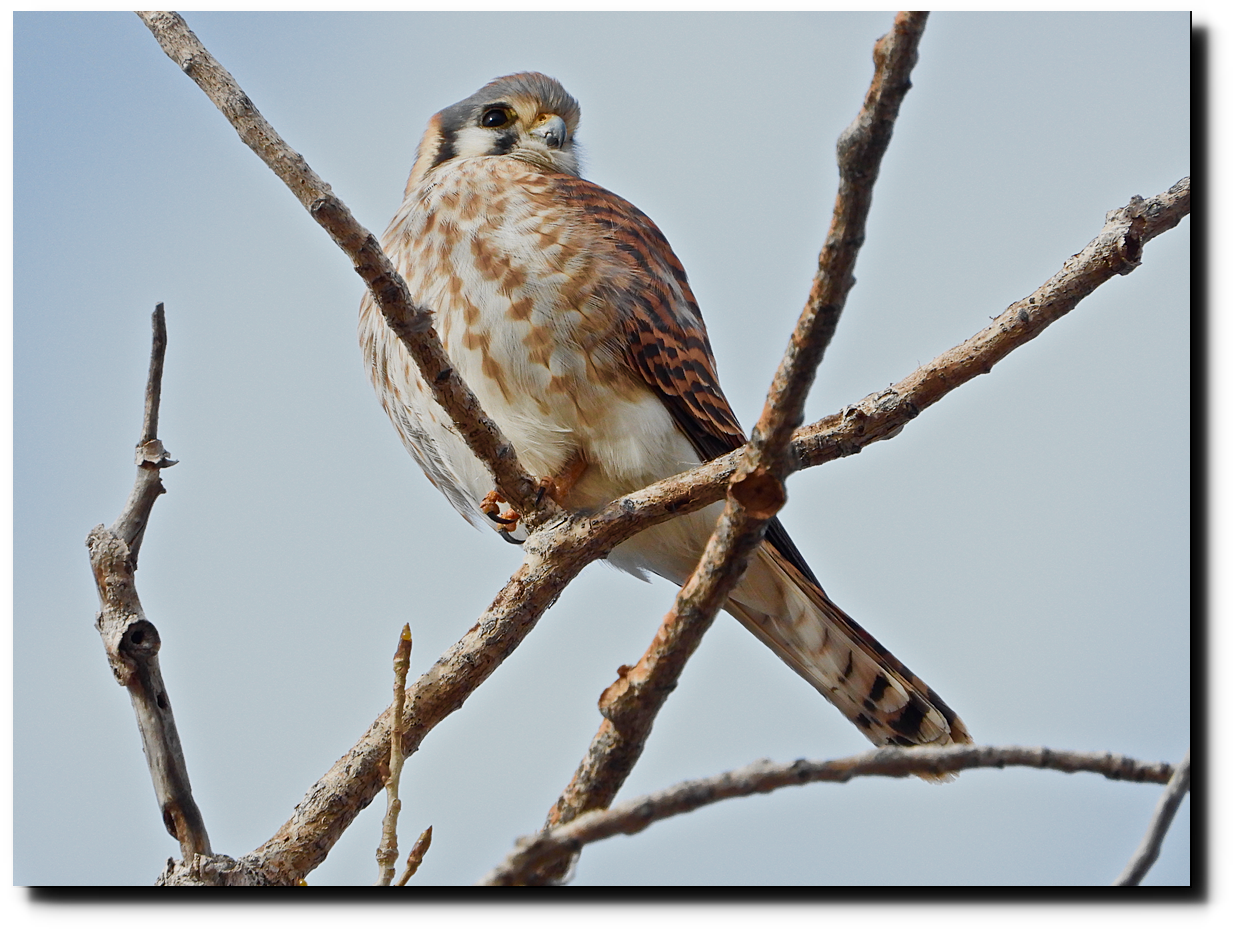
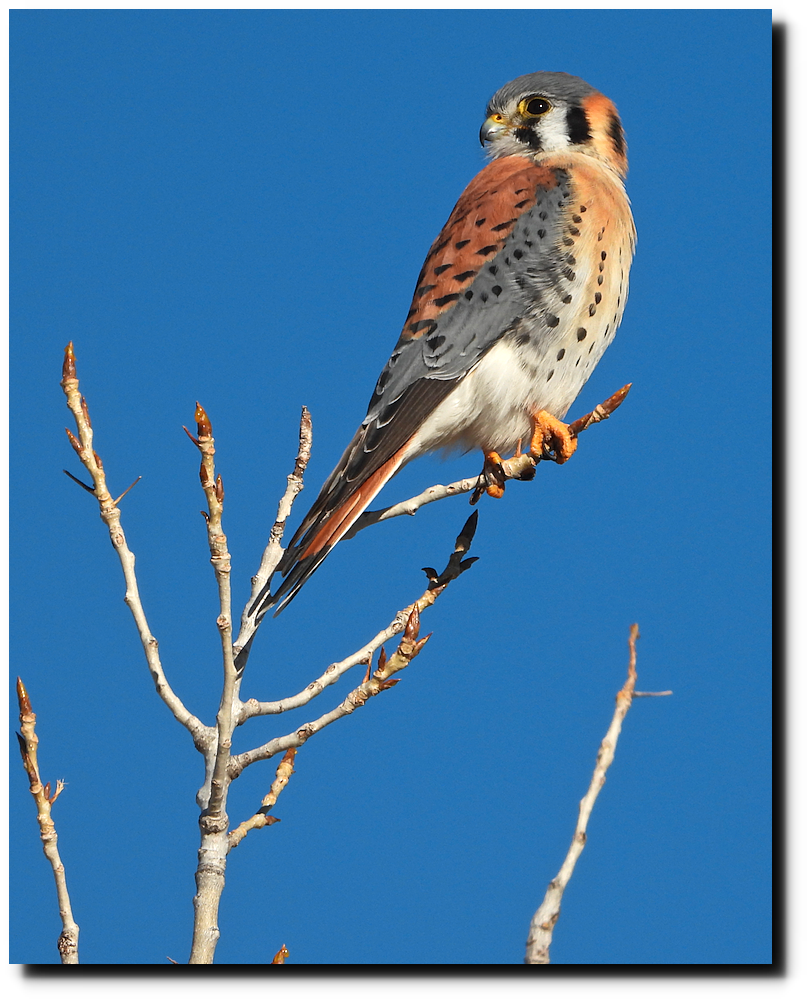
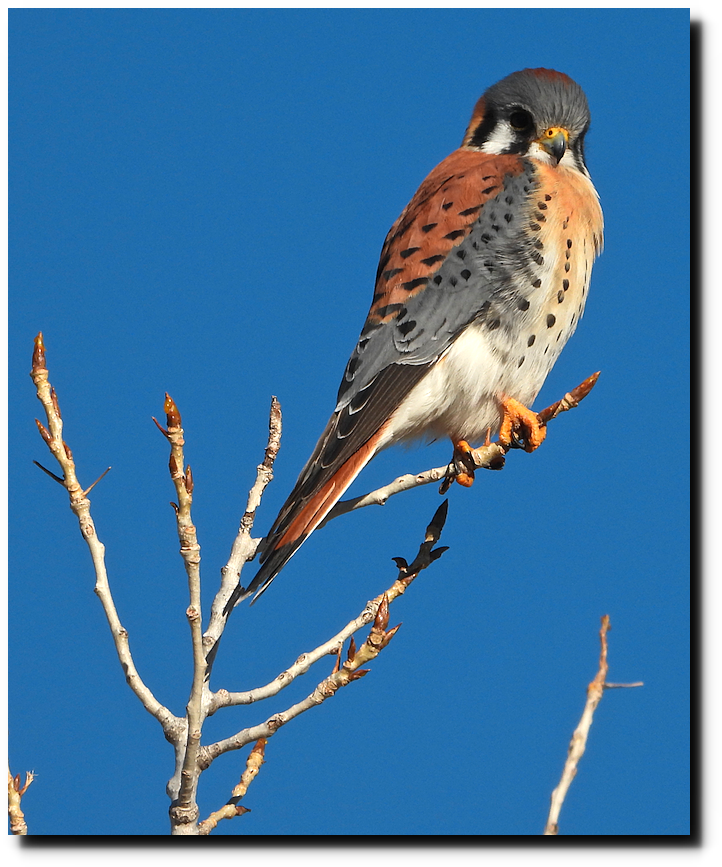
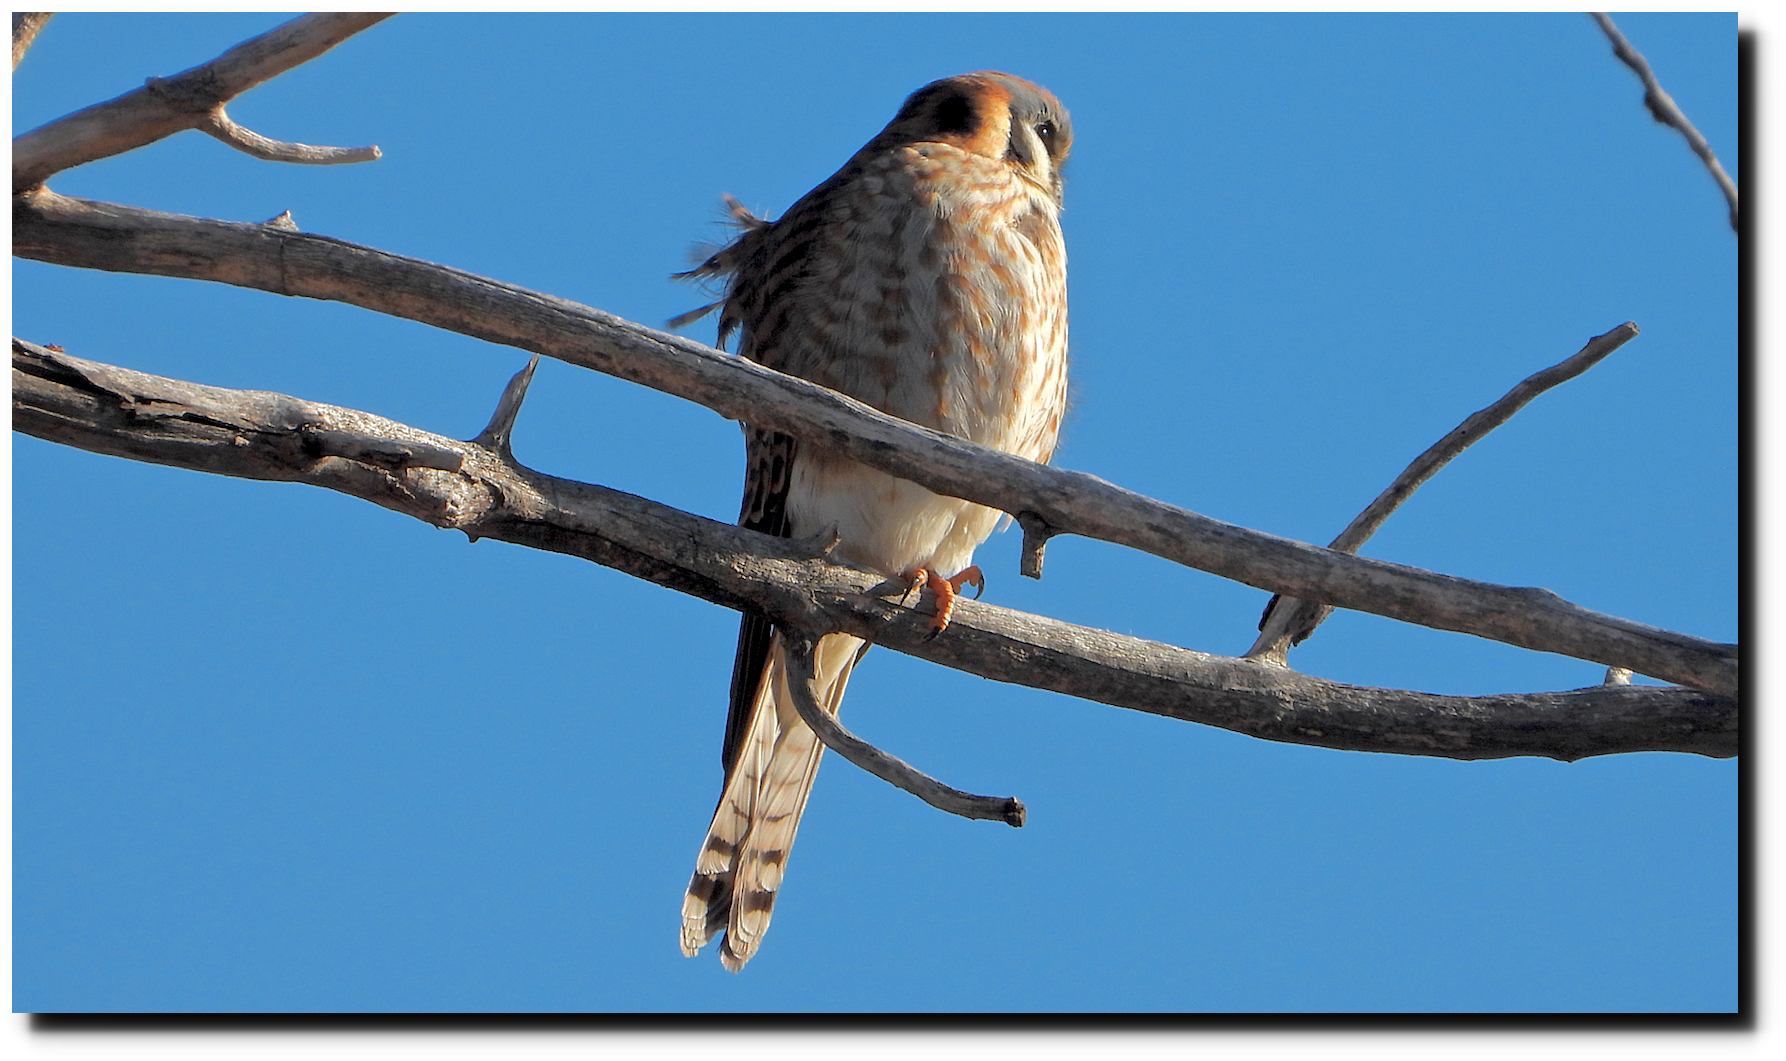
Saw this beauty in Boulder this morning.