
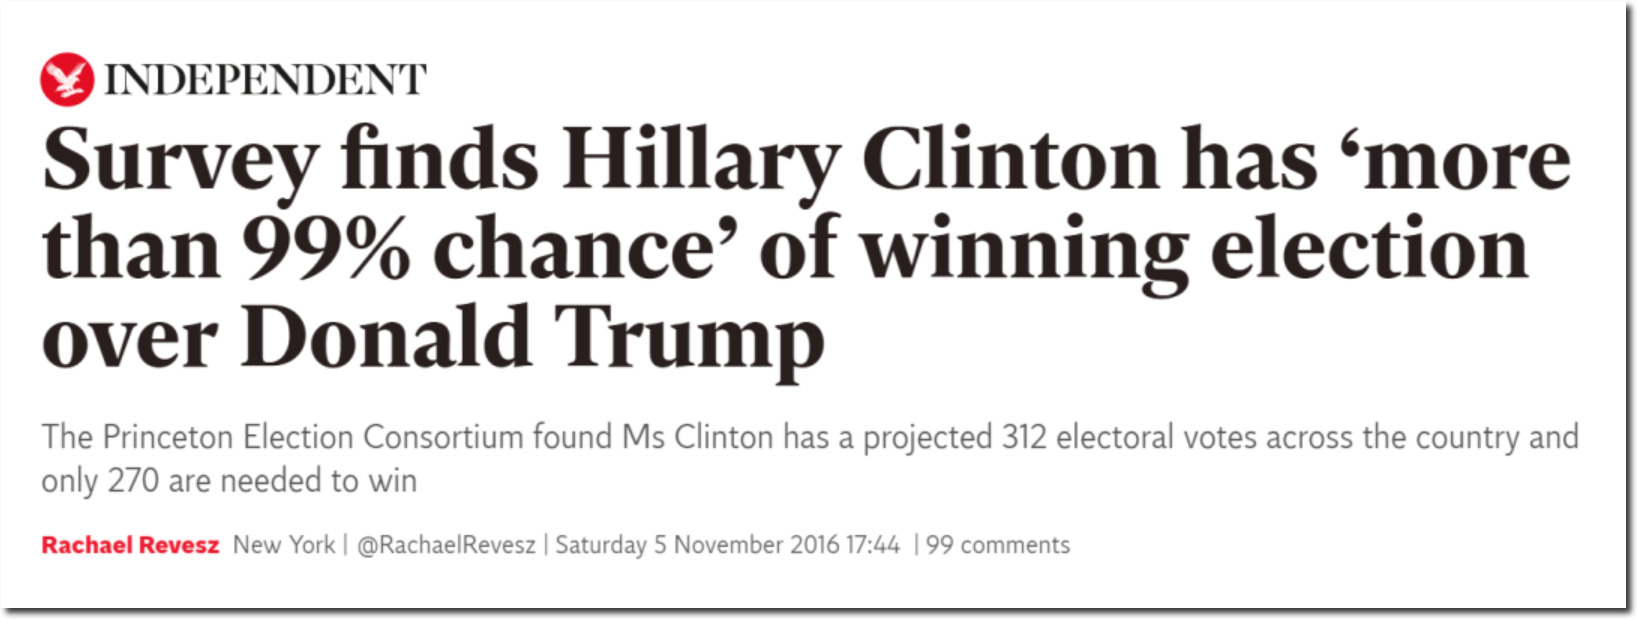




Disrupting the Borg is expensive and time consuming!

Google Search
-
Recent Posts
- Declining Spring Snow Cover In Northern New Mexico
- You Can’t Fool Mother Nature
- Cattle And The Climate
- One Atomic Bomb Per Hour
- New Video : Analyzing Oil And Gas
- Is Antarctica Melting?
- High Speed Analysis And Visualization
- El Nino To The Rescue?
- Fake News Update
- Growth Of Antarctic Sea Ice
- 65 Years Of Progress!
- El Nino To The Rescue?
- Worst March Drought On Record
- ChartGL Process Control Demo
- The Biggest Money Laundering Scam
- Drought In The Headwaters Of Lake Powell
- Unrealistic Expectations Of Water Availability
- Did Bill Gates Do This?
- Worst March Drought On Record In The US
- The Real Hockey Stick Graph
- Analyzing The Western Water Crisis
- Gaslighting 1924
- “Why Do You Resist?”
- Climate Attribution Model
- Fact Checking NASA
Recent Comments
- conrad ziefle on Declining Spring Snow Cover In Northern New Mexico
- Bob G on You Can’t Fool Mother Nature
- Ivan G Wainwright on You Can’t Fool Mother Nature
- conrad ziefle on You Can’t Fool Mother Nature
- Bob G on You Can’t Fool Mother Nature
- Gordon Vigurs on You Can’t Fool Mother Nature
- arn on Cattle And The Climate
- Bob G on Cattle And The Climate
- Robertvd on Cattle And The Climate
- Bob G on Cattle And The Climate
Global Warming To Melt The Planet By Tomorrow
According to leftists, the more insane your beliefs, the more accurate they are.
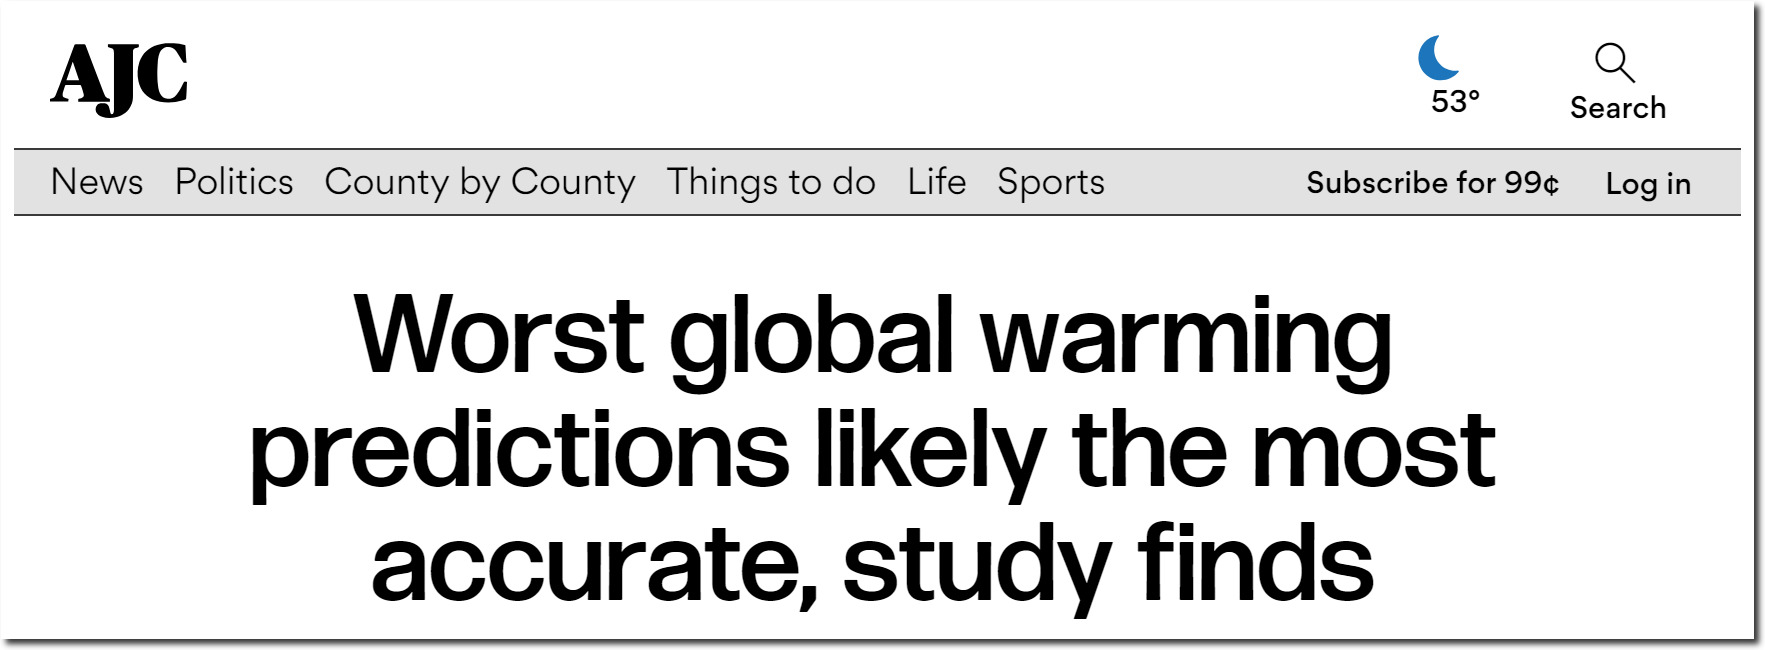
Study: Worst global warming predictions likely the most accurate
Posted in Uncategorized
Leave a comment
Maldives To Drown In 30 Years
Experts say the Maldives will be submerged in thirty years.
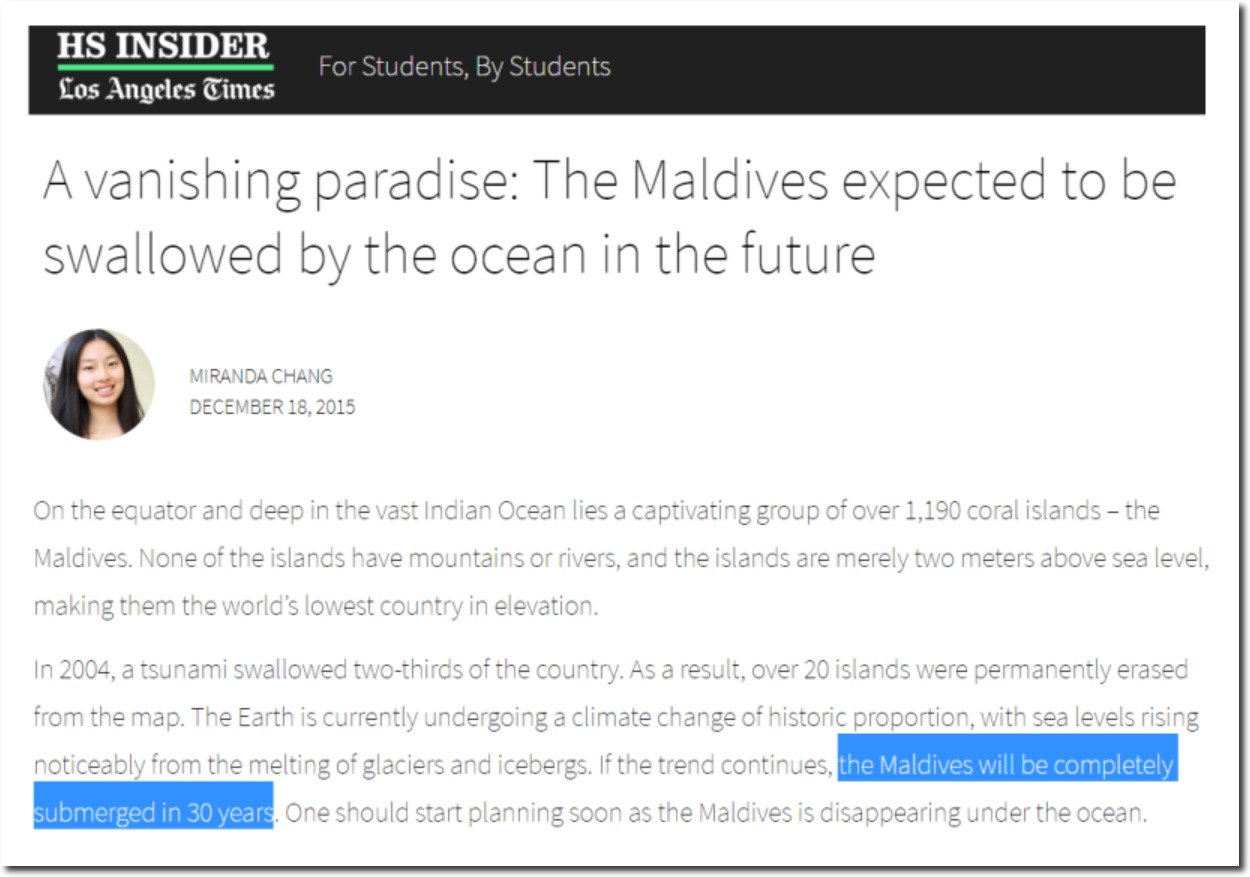
A vanishing paradise: The Maldives expected to be swallowed by the ocean in the future – HS Insider
Thirty years ago, experts said the Maldives would be submerged this year.
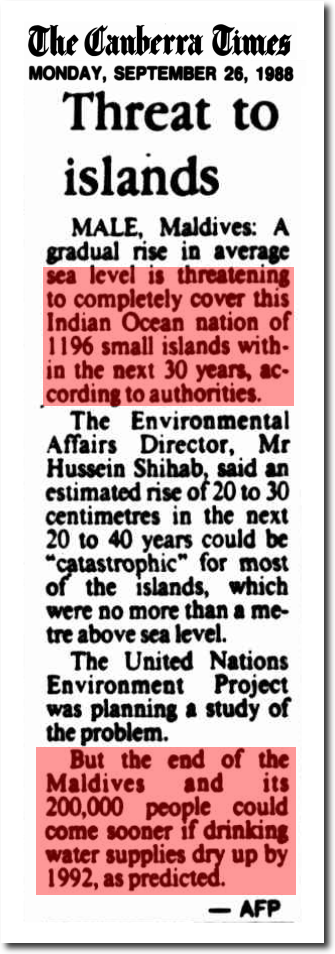
26 Sep 1988 – Threat to islands
Conditions there look brutal. The ocean now extends all the way to the beach. Only global communism can stop this.

Posted in Uncategorized
Leave a comment
Election Collusion Update

The Arizona Senate debate was a pretty obvious setup between the PBS moderator and the Sinema campaign. The debate came a few days after video was released showing Sinema describing Arizona as a “meth lab” and saying that Arizonans were “crazy.”
The moderator didn’t mention anything about that, and instead opened up the debate asking Sinema how she reconciled her liberal past with her new conservative image. Based on her reaction, it was obvious that she was expecting that exact question and she reeled off a well rehearsed answer – bragging about how often she votes with President Trump. The moderator smiled and left it at that.
The moderator then went on pressing one Democratic Party talking point after another, and kept attacking Martha McSally for agreeing with President Trump.
I was just listening to YouTube music and a Sinema ad came on, attacking McSally for how often she votes with President Trump. How stupid would a person have to be to vote for a two-faced slimeball like that?
Posted in Uncategorized
Leave a comment
Mass Insanity
“If you tell a lie big enough and keep repeating it, people will eventually come to believe it. The lie can be maintained only for such time as the State can shield the people from the political, economic and/or military consequences of the lie.”
– Joseph Goebbels
In a sane world, there would be a massive GOP landslide, but two years of nonstop deep state propaganda has turned vulnerable minds to putty.

For some, a vibrant US economy complicates voting decision
A vibrant economy should make voting Republican a no-brainer. Democrats have done everything they could to resist and sabotage success.
Posted in Uncategorized
Leave a comment
Mann Self-Identifies As A Rocket Scientist

https://twitter.com/MichaelEMann/status/1059120054007222272
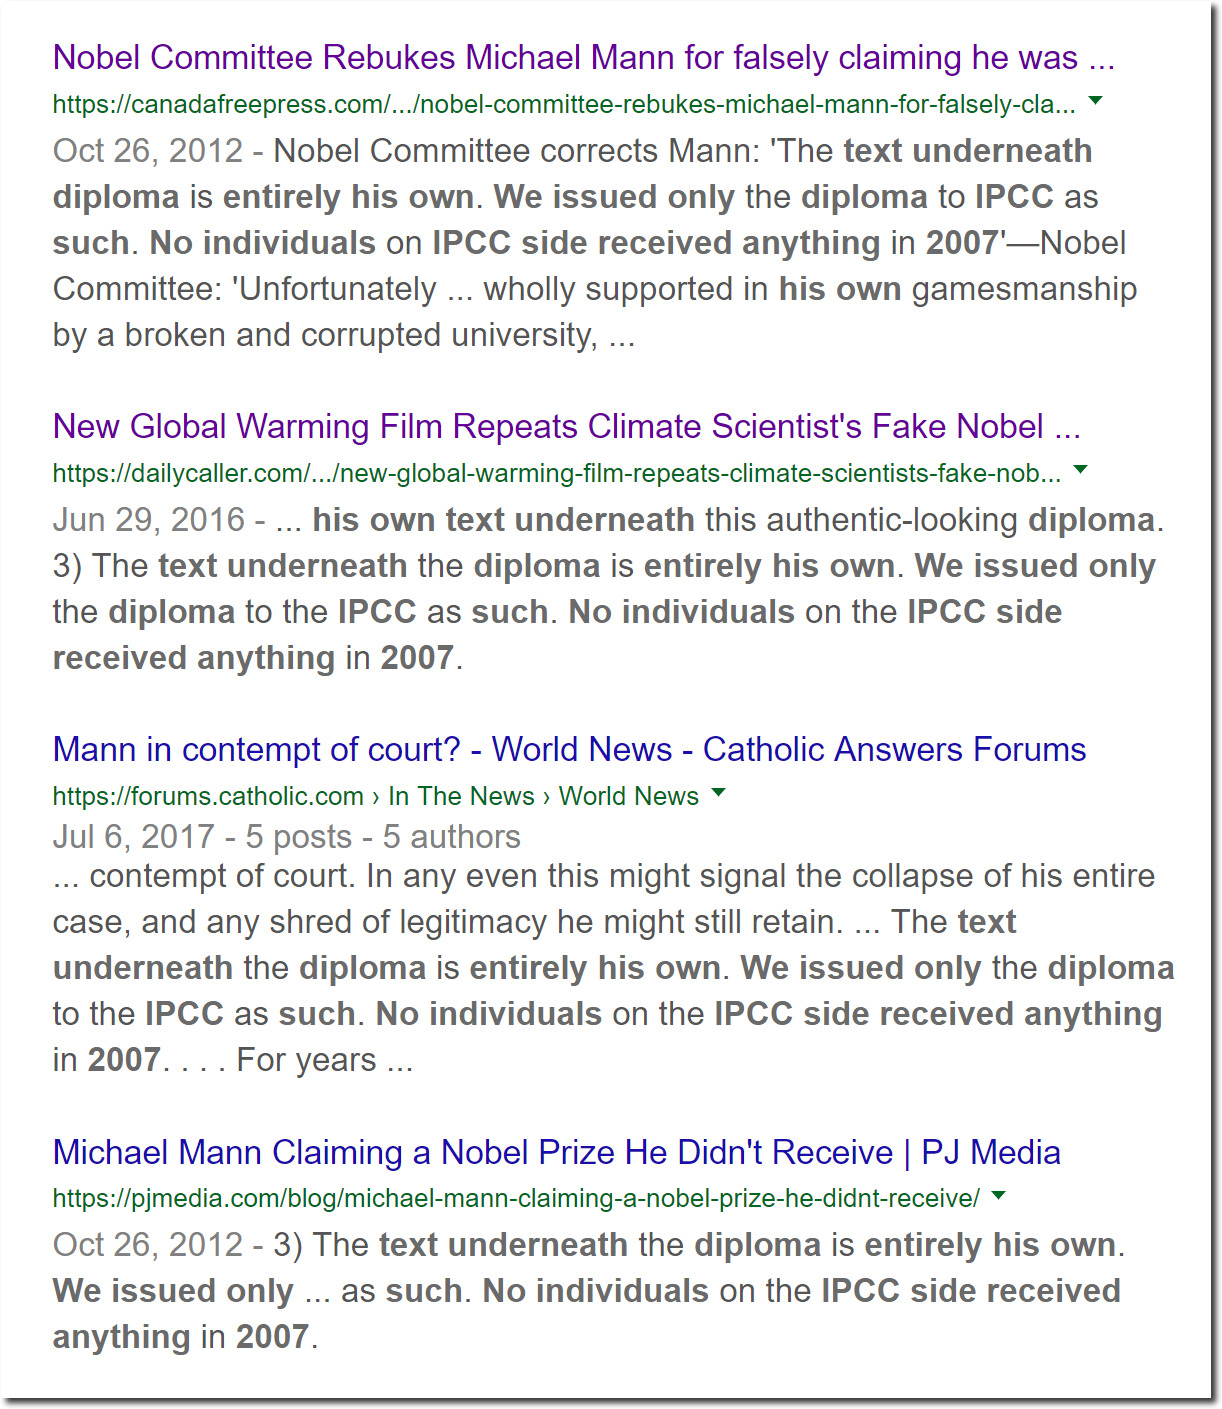
This is not surprising, because he also self-identifies as a Nobel Prize winner and funniest of all – as a scientist.
Posted in Uncategorized
Leave a comment
The Case For Socialist Reeducation Camps
This couple in the Maldives seems to be unaware that experts predicted the islands would be underwater by now, that they are emitting CO2, and that their long haul flight probably caused a hurricane somewhere.

Live Cam Maldives – Meeru Island
Capitalism is evil. They never had these kinds of problems in the German Democratic Republic or the Union of Soviet Socialist Republics.

Posted in Uncategorized
Leave a comment
Fake Data – The Basis Of Climate Science
Whenever you hear the consensus of scientists agrees on something or other, reach for your wallet, because you’re being had.
– Michael Crichton
NASA has a scientific consensus web page showing how closely different agencies’ temperature graphs line up. If all the graphs agree, they must be accurate! What other possible explanation could there be?
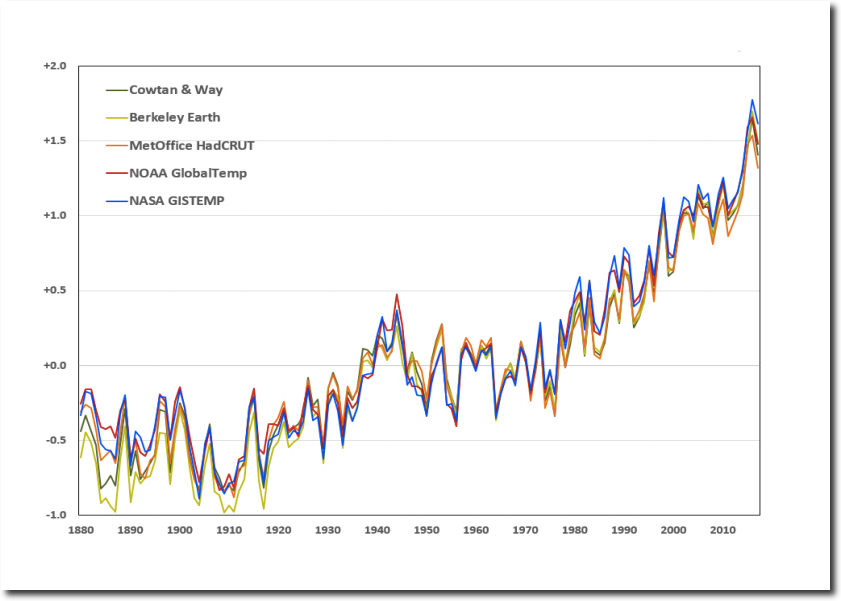
Scientific Consensus | Facts – Climate Change: Vital Signs of the Planet
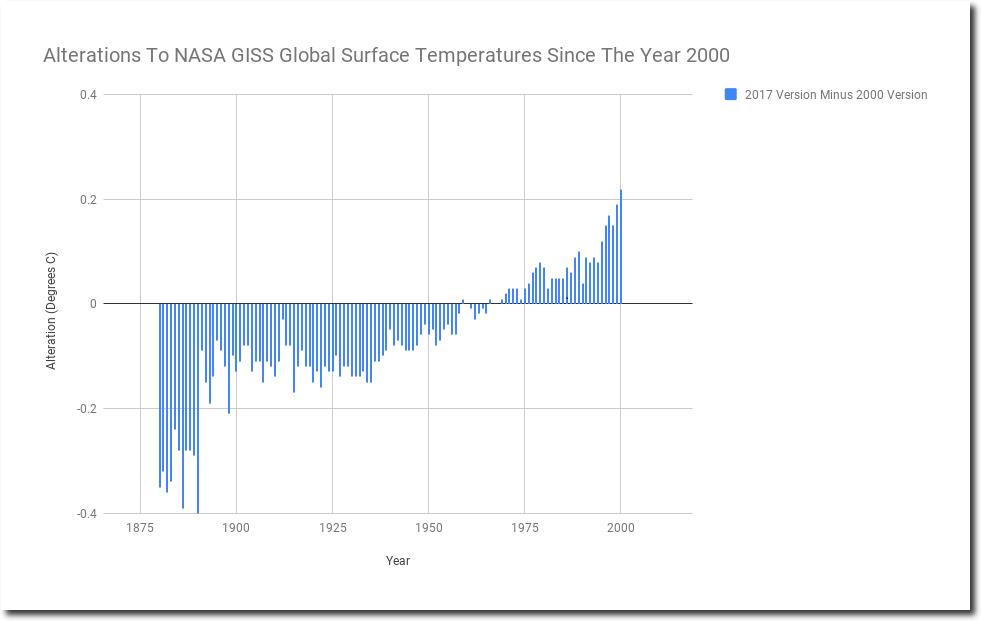
Unfortunately, the current NASA graph doesn’t even agree with their earlier graphs. Eighteen years ago, NASA showed 0.5C warming prior to the year 2000. Now they show twice as much warming prior to 2000.
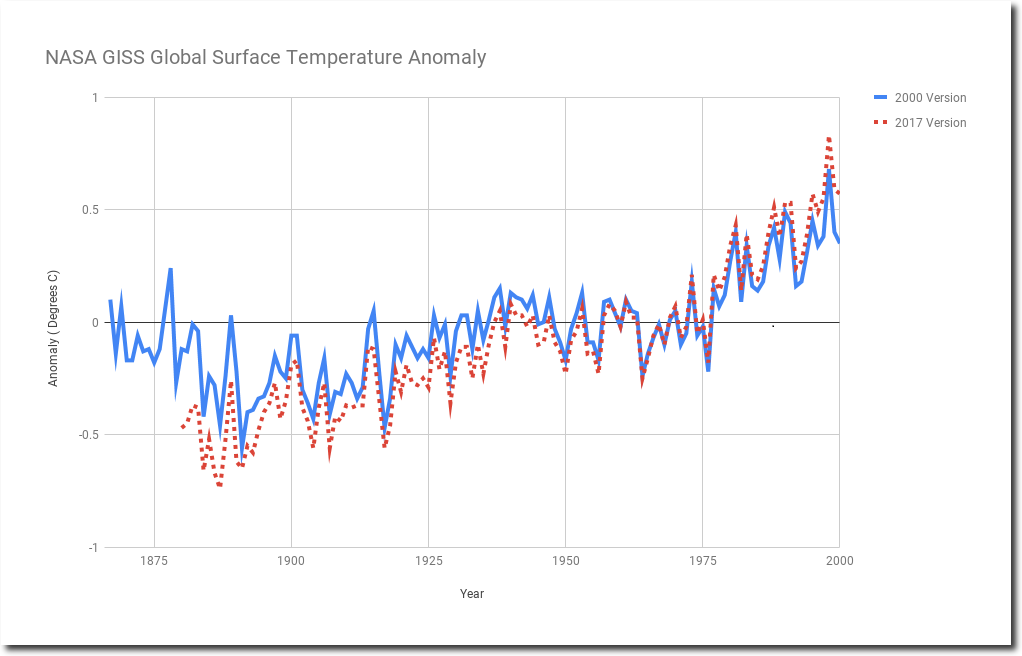
NASA accomplished this by hiding pre-1880 temperatures, progressively cooling older years, and progressively warming more recent years. They added 0.5C to the pre-2000 trend via good old fashioned data tampering.
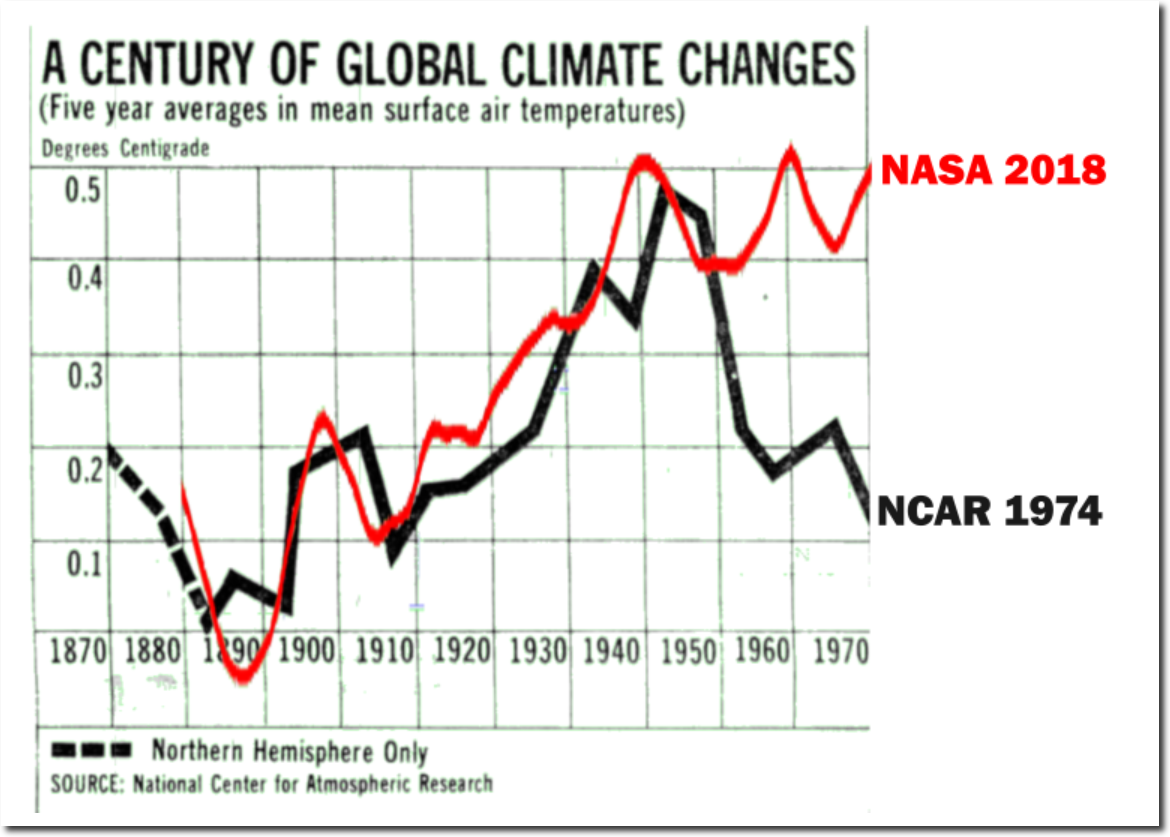
If we go back further to 1974, the National Center for Atmospheric Research showed almost 0.5C cooling from 1940 to 1970. NASA has complete erased this.
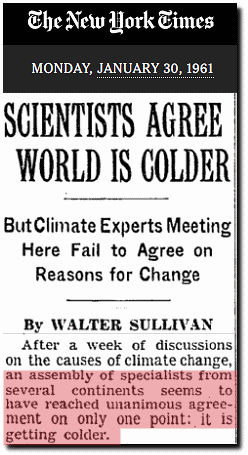
At the time, there was unanimous consensus among scientists that Earth was cooling.
The cooling was indisputable.
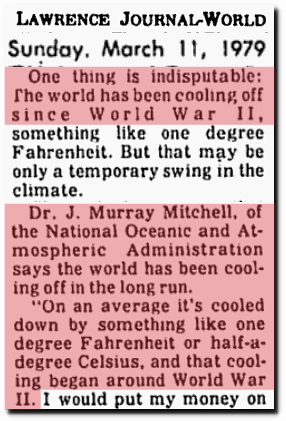
Lawrence Journal-World – Google News Archive Search
The US and Soviet Union were worried about “ominously thickening” Arctic ice, and a new ice age.
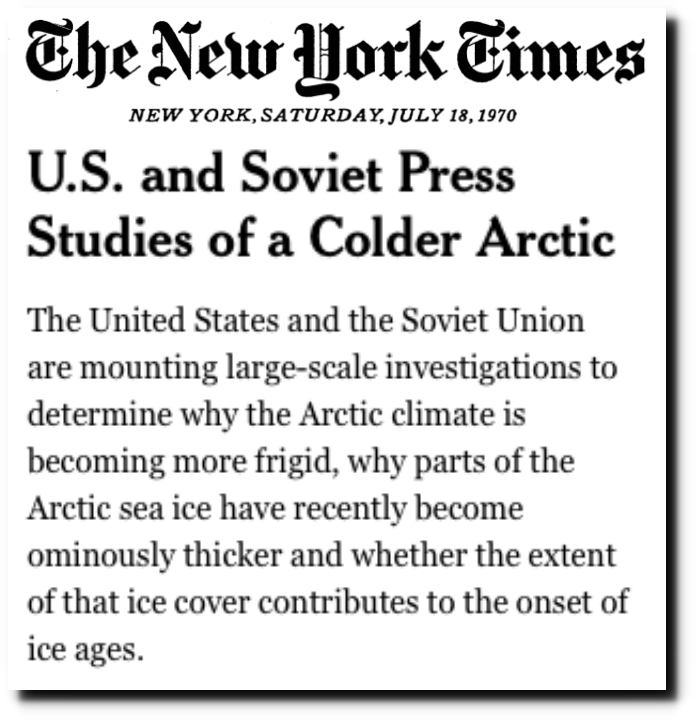
TimesMachine: July 18, 1970 – NYTimes.com
Glaciers were growing in Norway for the first time in 200 years.
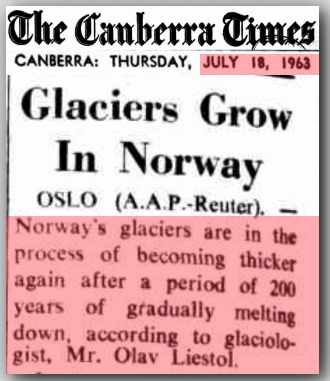
18 Jul 1963 – Glaciers Grow In Norway
Icelandic ports were blocked with ice for the first time in a century.
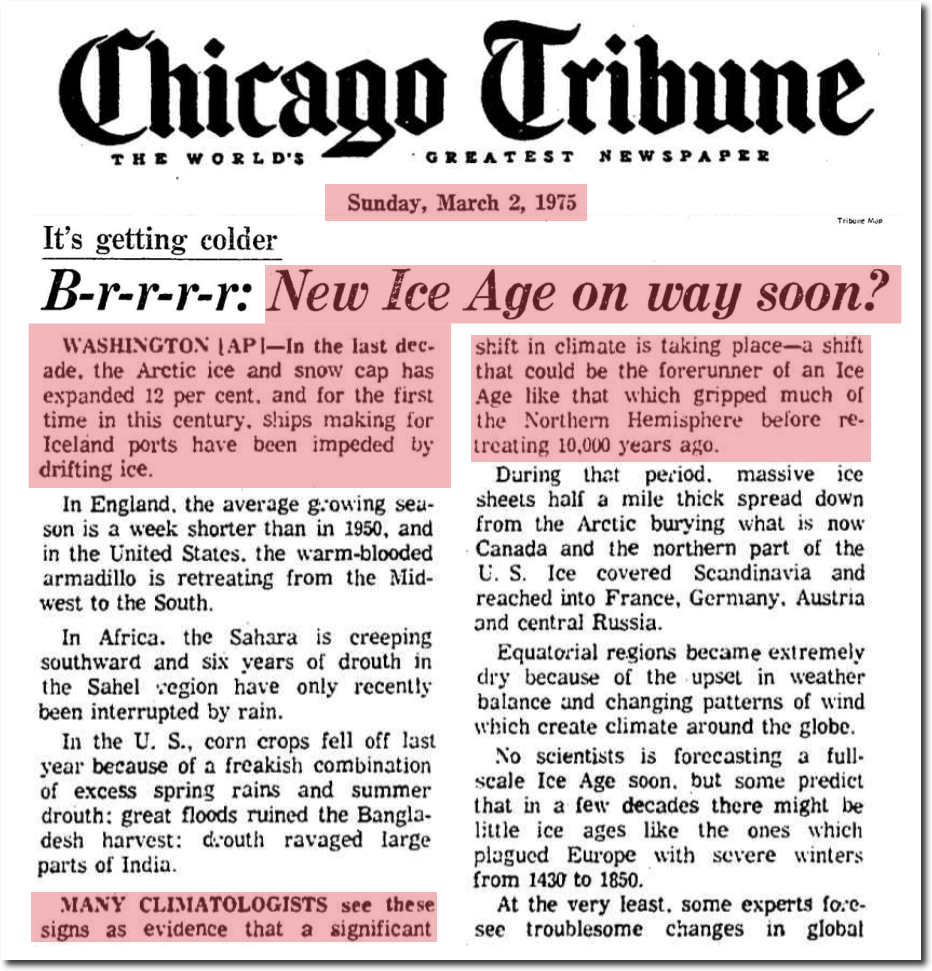
March 2, 1975 – B-r-r-r-r: New Ice Age on way soon? | Chicago Tribune Archive
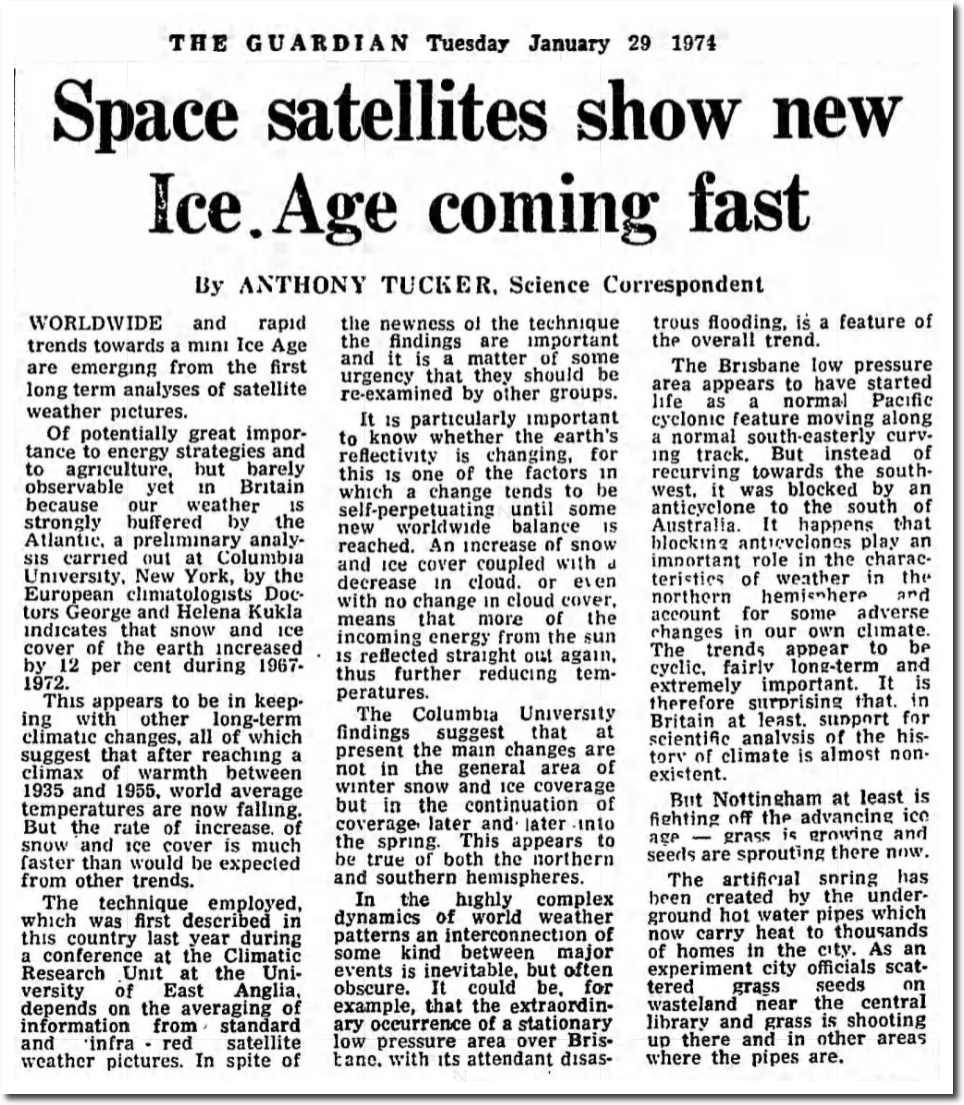
29 Jan 1974, 5 – The Guardian at Newspapers.com

Forty two top American and European investigators wrote a letter to President Nixon warning of a new ice age.
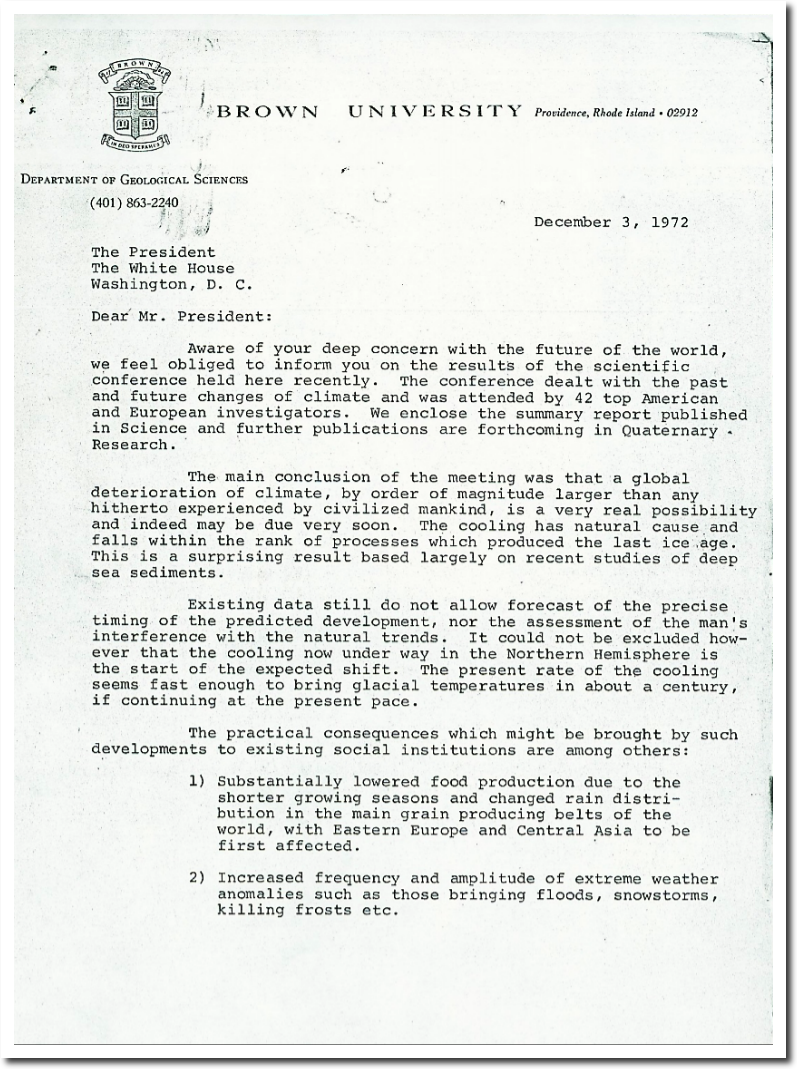
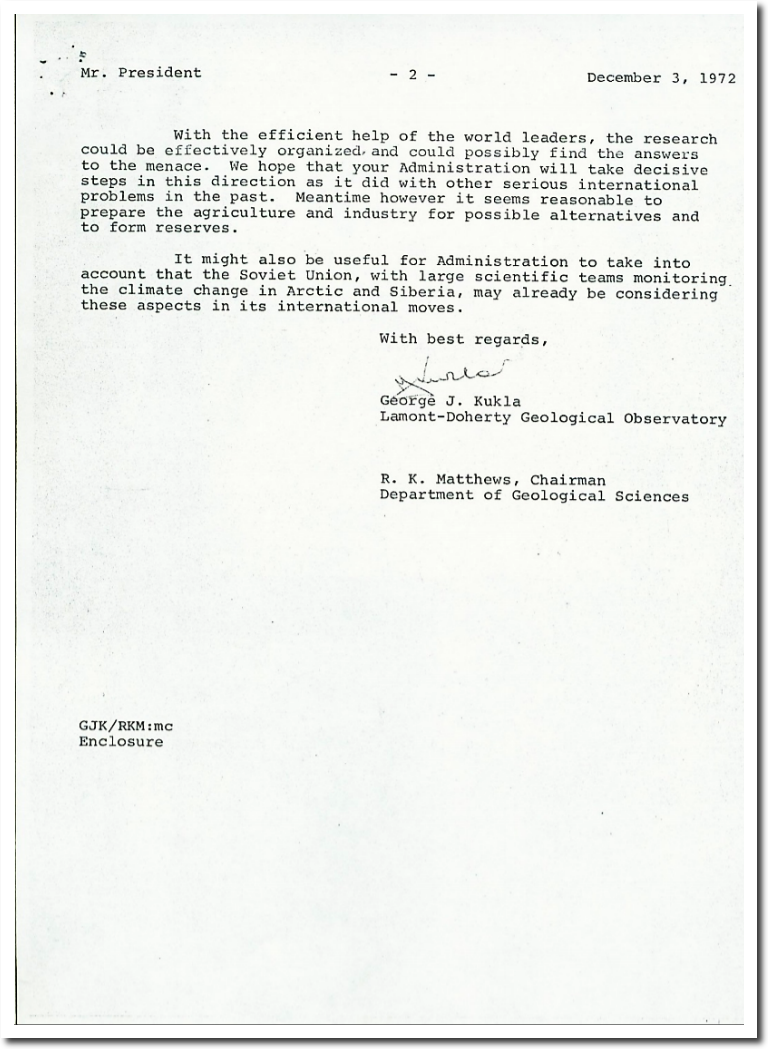
There is also strong historical evidence Earth was very warm prior to the 1960s. From the 1920s through the 1950s, the Arctic was having a meltdown.
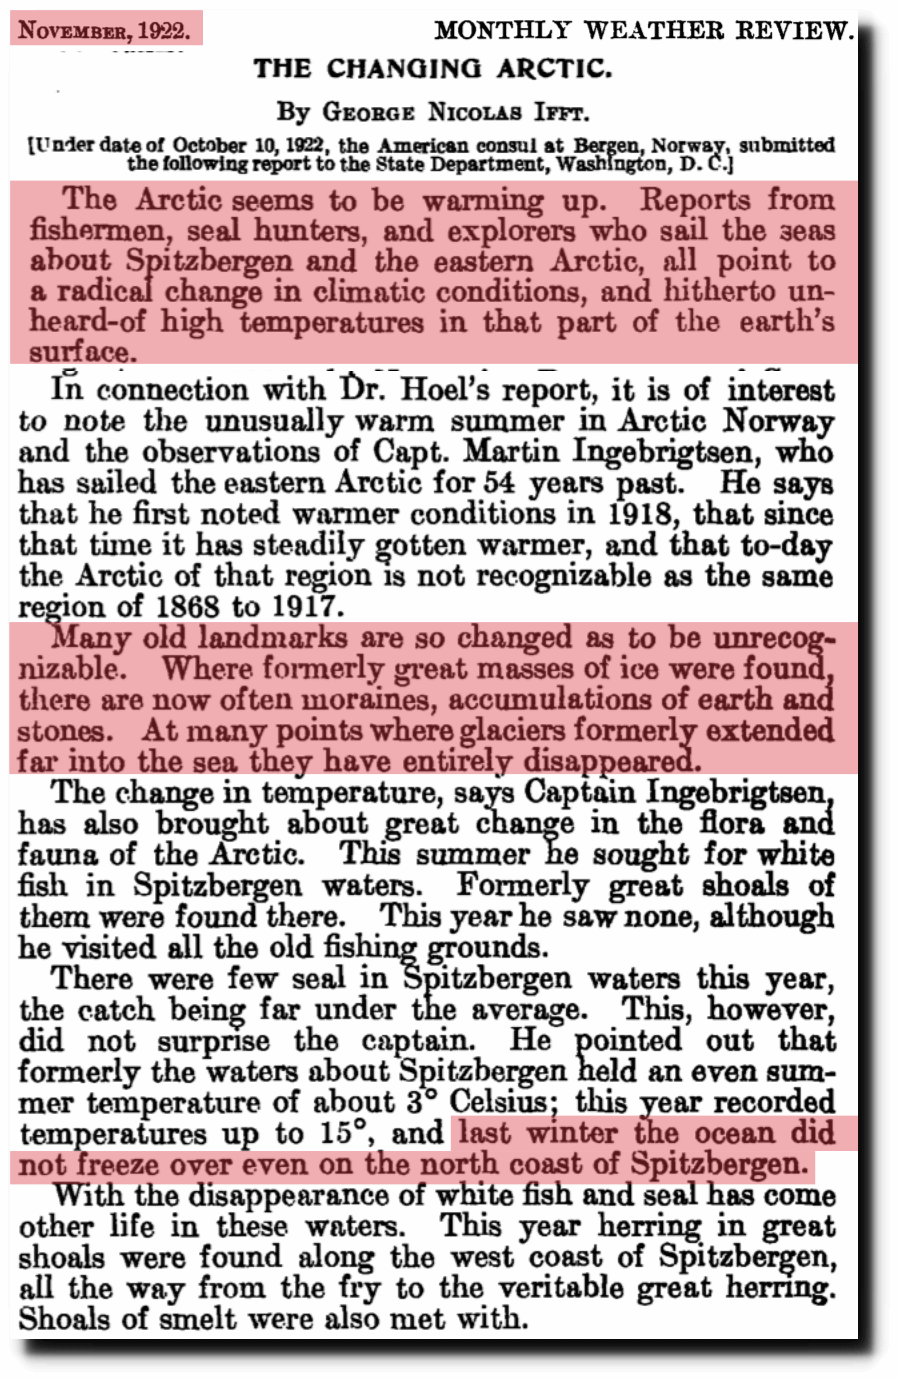
https://docs.lib.noaa.gov/rescue/mwr/050/mwr-050-11-0589a.pdf
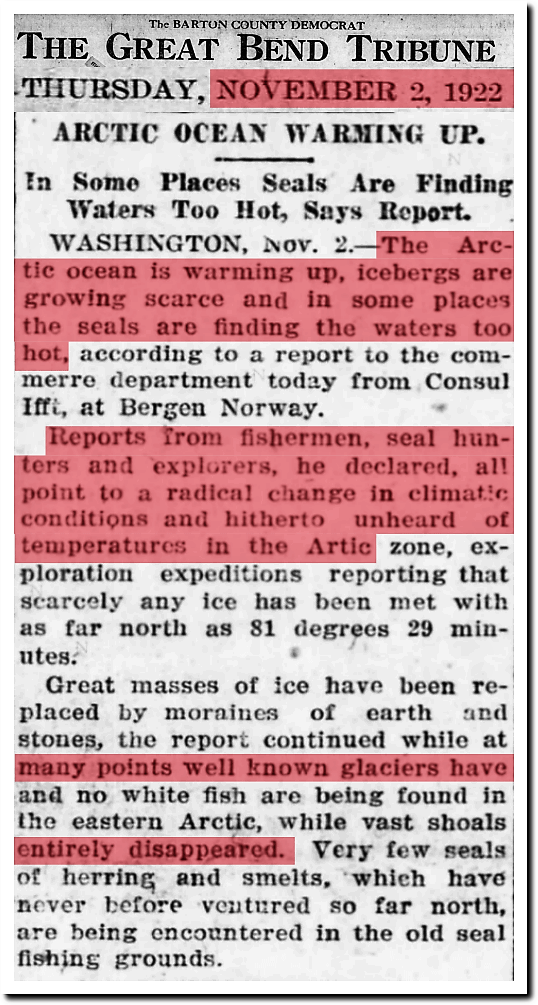
2 Nov 1922, Page 1 – Great Bend Tribune at Newspapers.com
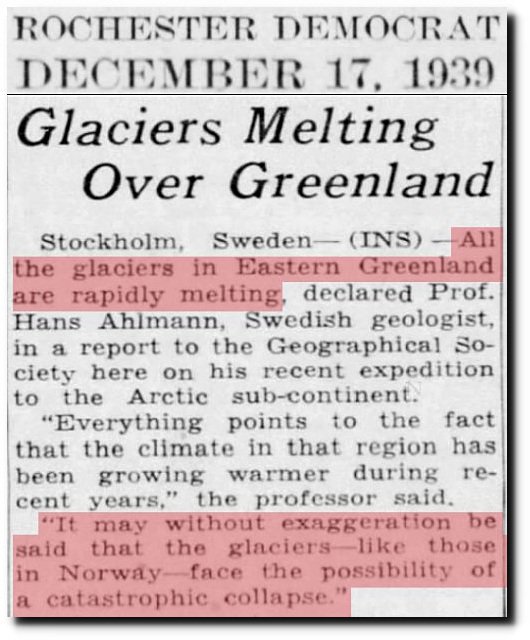
17 Dec 1939, Page 15 – Harrisburg Sunday Courier
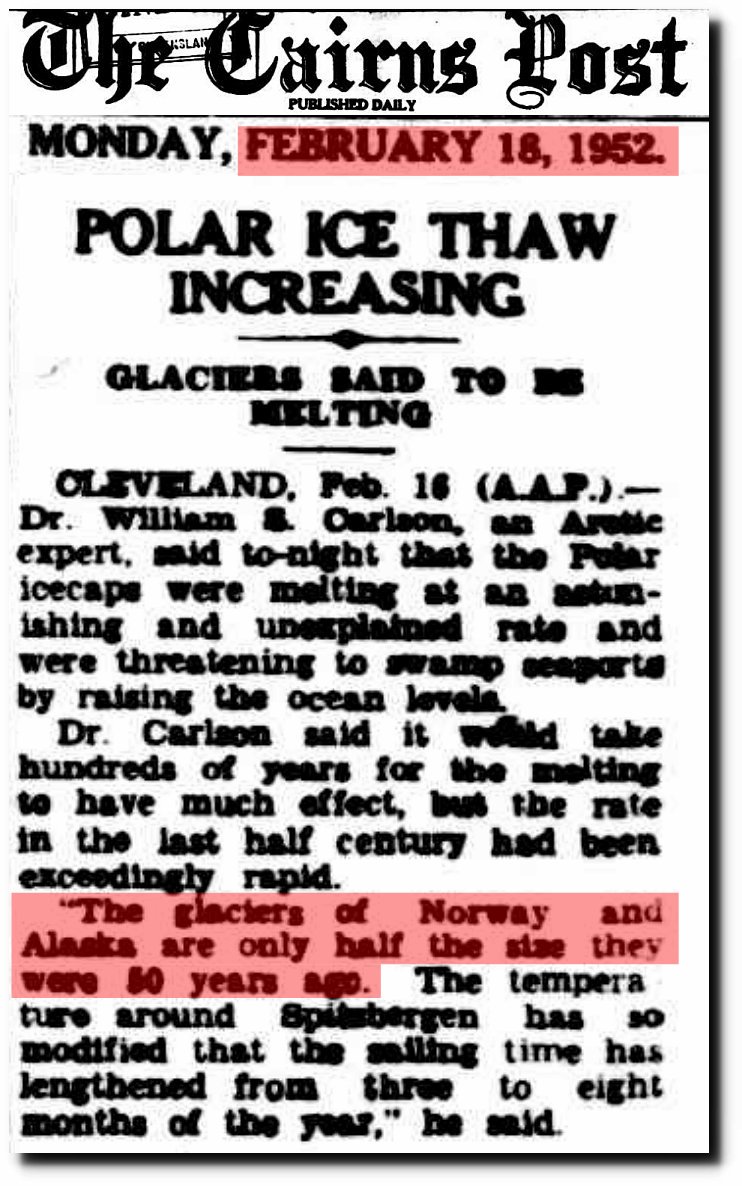
18 Feb 1952 – POLAR ICE THAW INCREASING
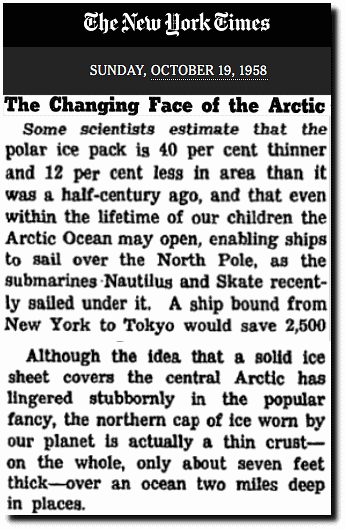
The Changing Face of the Arctic; The Changing Face of the Arctic – The New York Times
In twelve years, the Arctic went from meltdown “ominously thickening” ice.
Unadjusted NASA shows Iceland very warm around 1940, and then sharply cooling into the late 1970s..
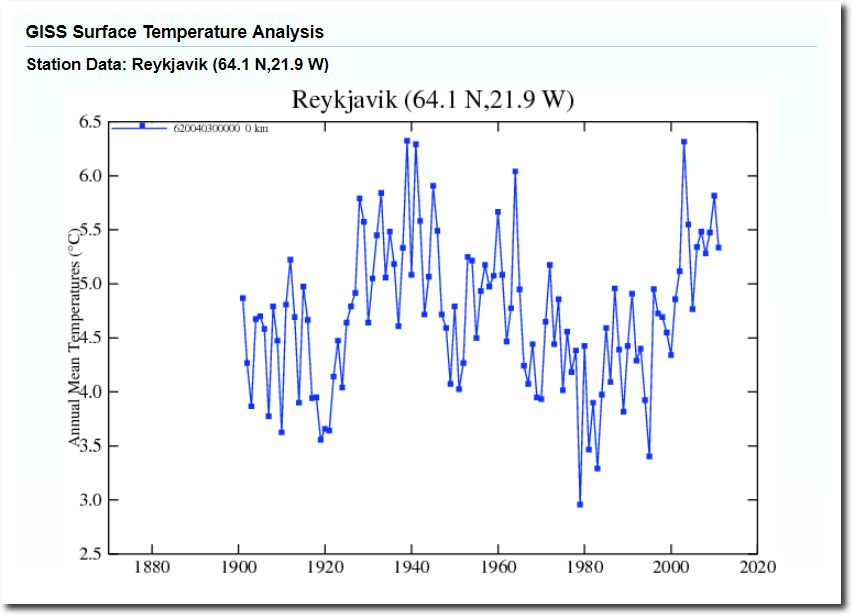
But after adjustment, Iceland temperatures look very different. The 1940’s warmth and subsequent cooling has been erased.
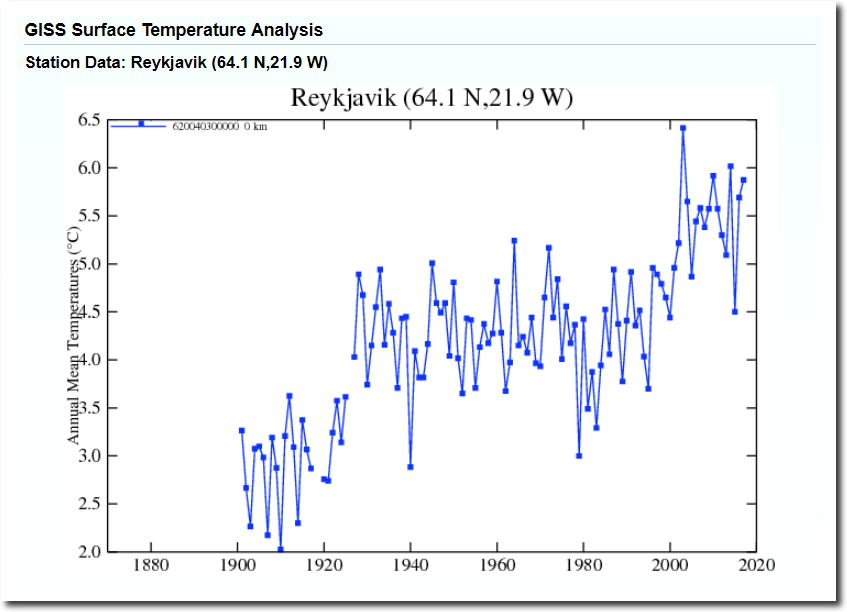
Evidence is overwhelming that Earth cooled from 1940 into the 1970’s. How did NASA erase it?
THE ROLE OF NOAA’S CLIMATE PREDICTION CENTER IN THE DEVELOPMENT OF CLIMATE SERVICES
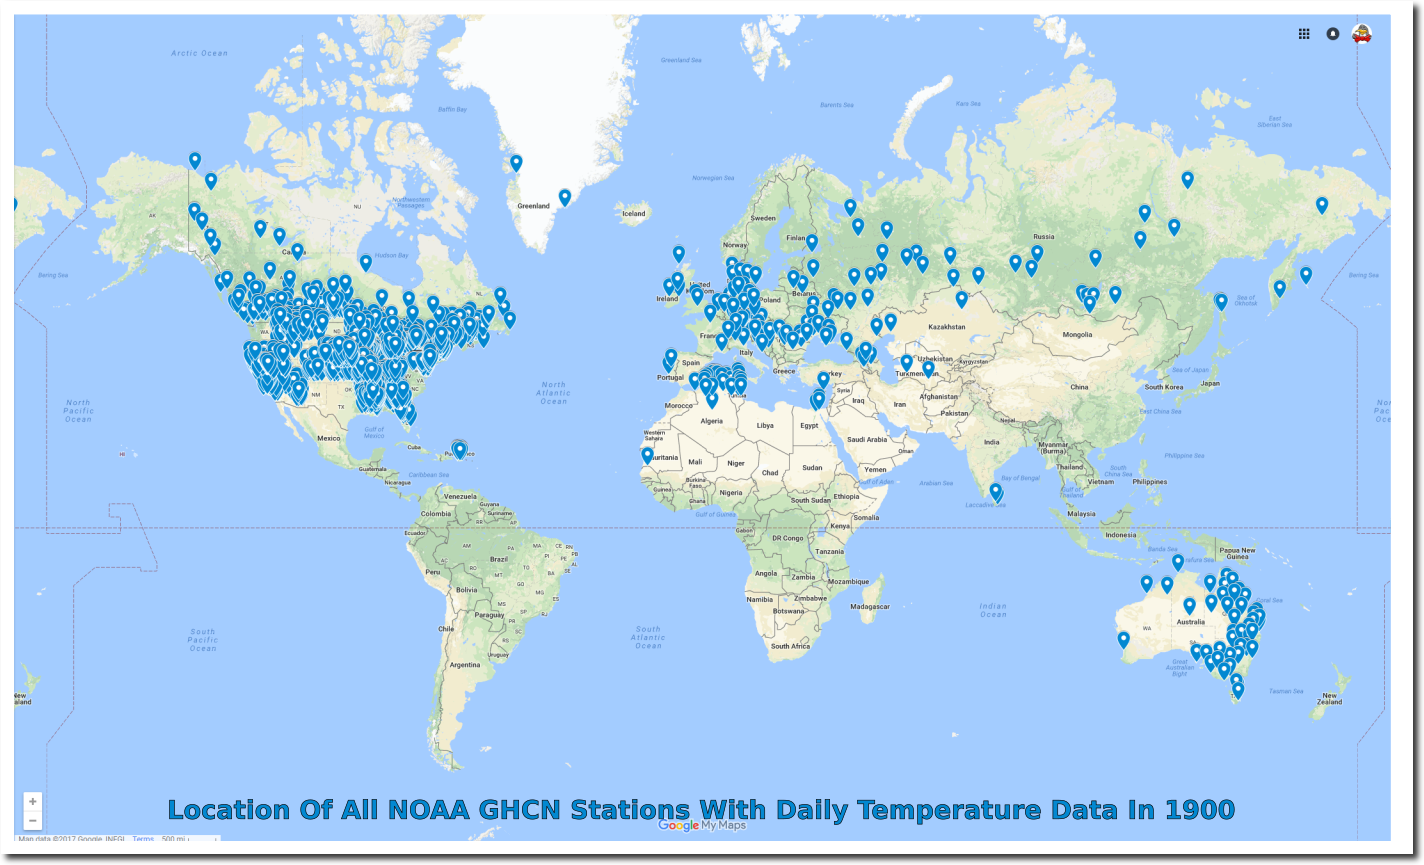
Let’s take a closer look at that. Outside of the US, the Global Historical Climatology Network has very little historical daily temperature data. Thermometers record temperatures one day at a time – and without daily temperature data, any claims made about global temperatures are meaningless. There is no such thing as a monthly thermometer.
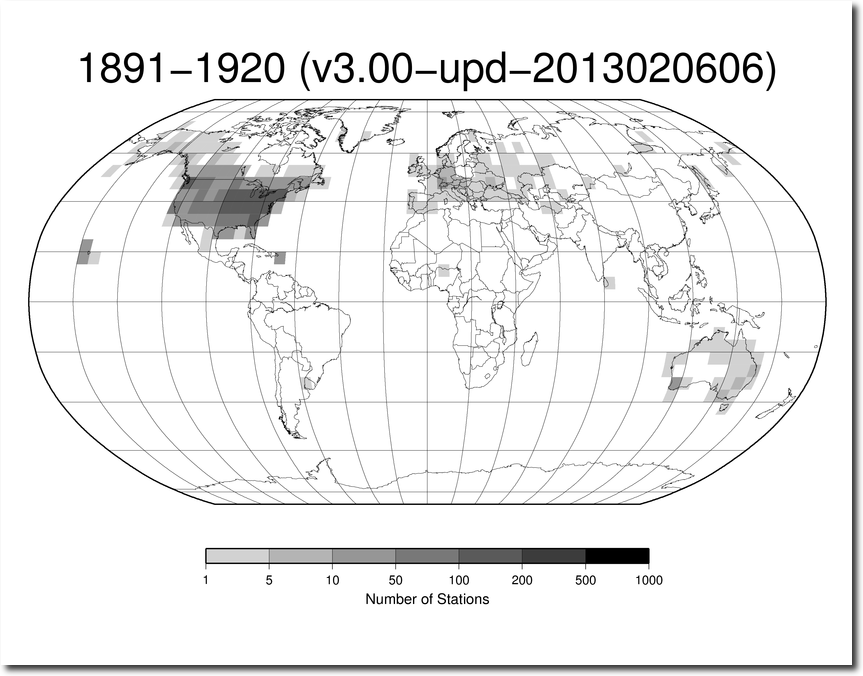
station-counts-1891-1920-temp.png (825×638)
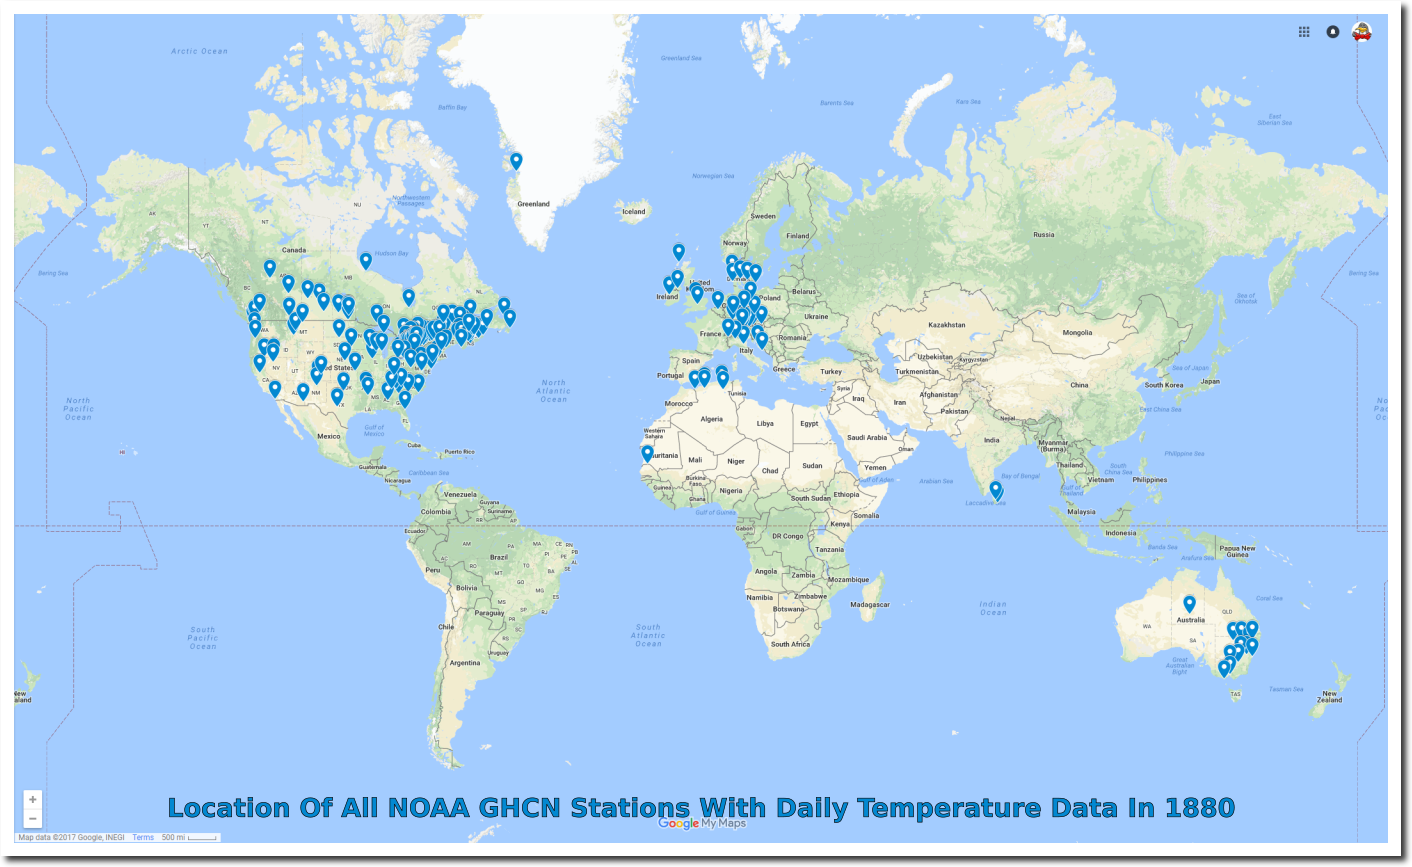
ftp://ftp.ncdc.noaa.gov/pub/data/ghcn/daily/ghcnd-inventory.txt
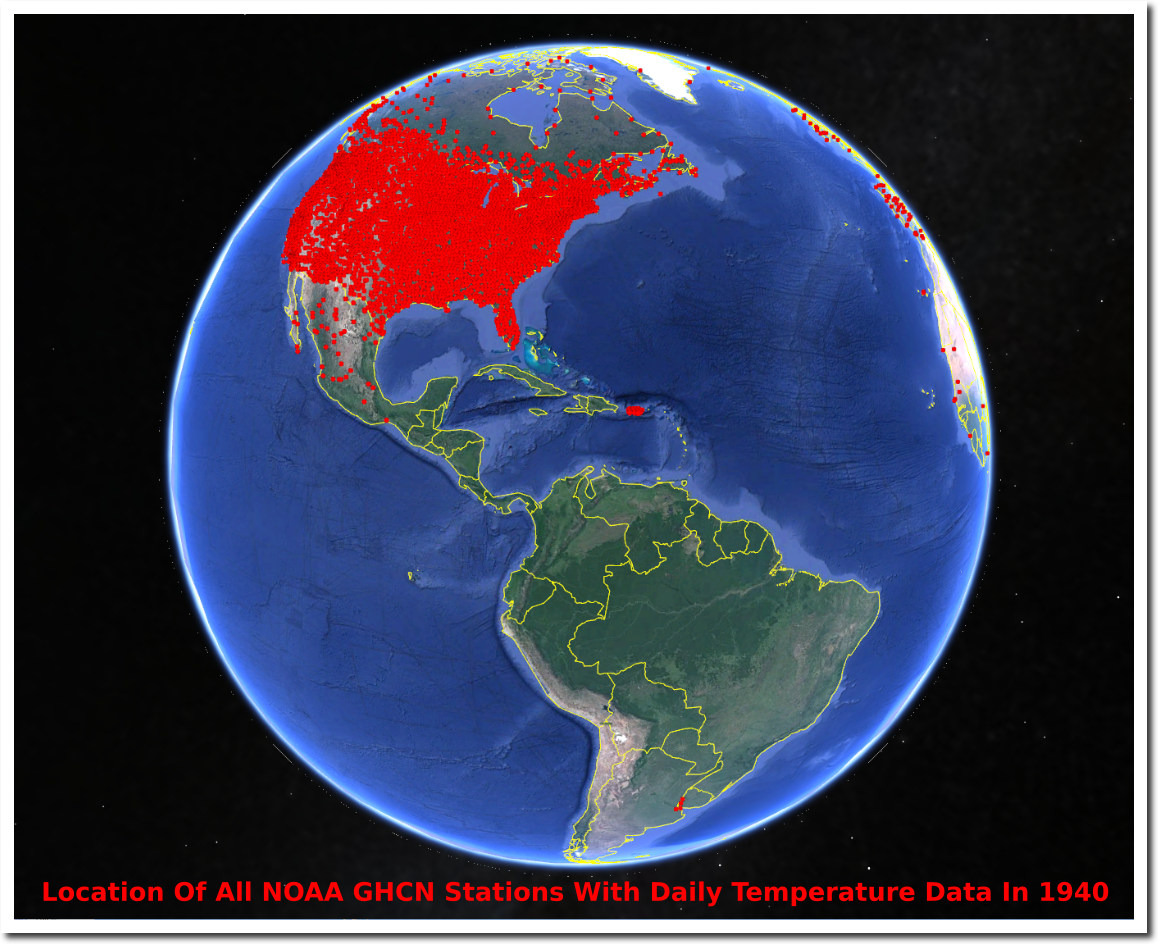
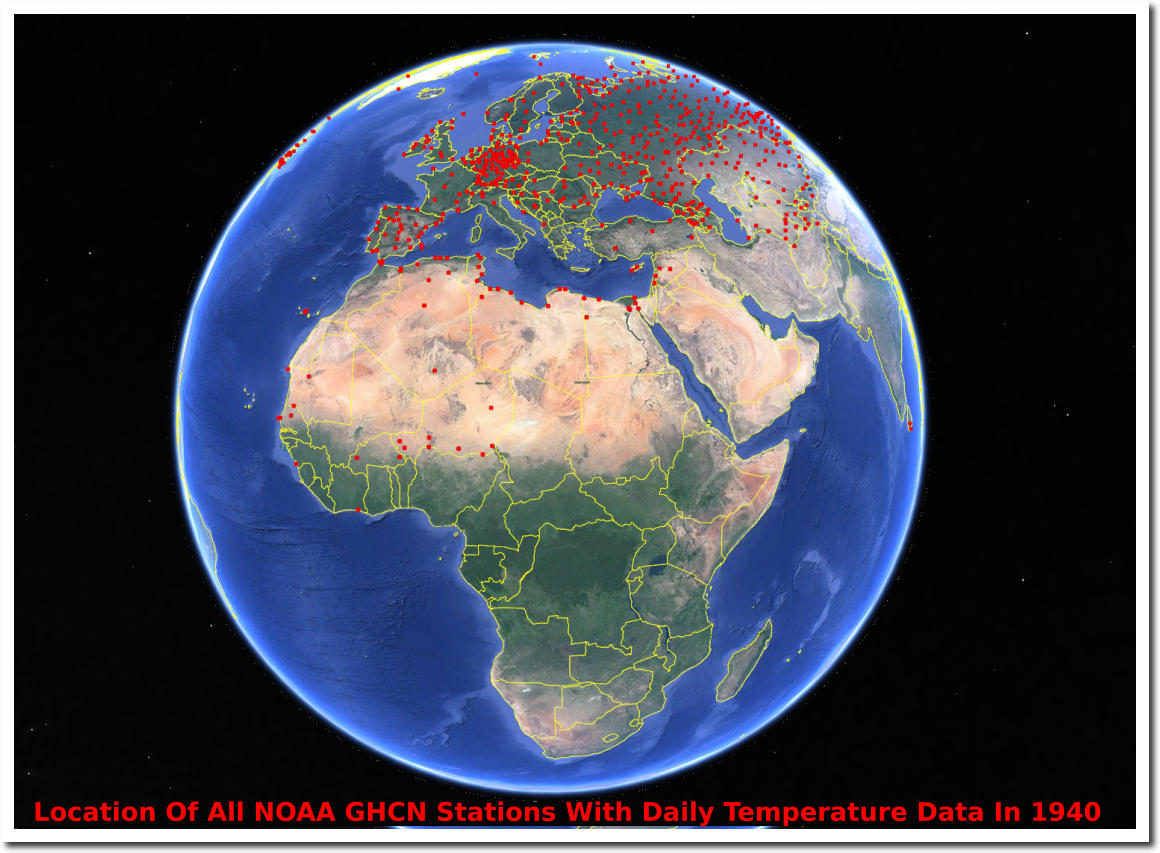
ftp://ftp.ncdc.noaa.gov/pub/data/ghcn/daily/ghcnd-inventory.txt
Forty years ago, climate scientists didn’t even attempt to claim they knew southern hemisphere temperatures, because there was so little data.
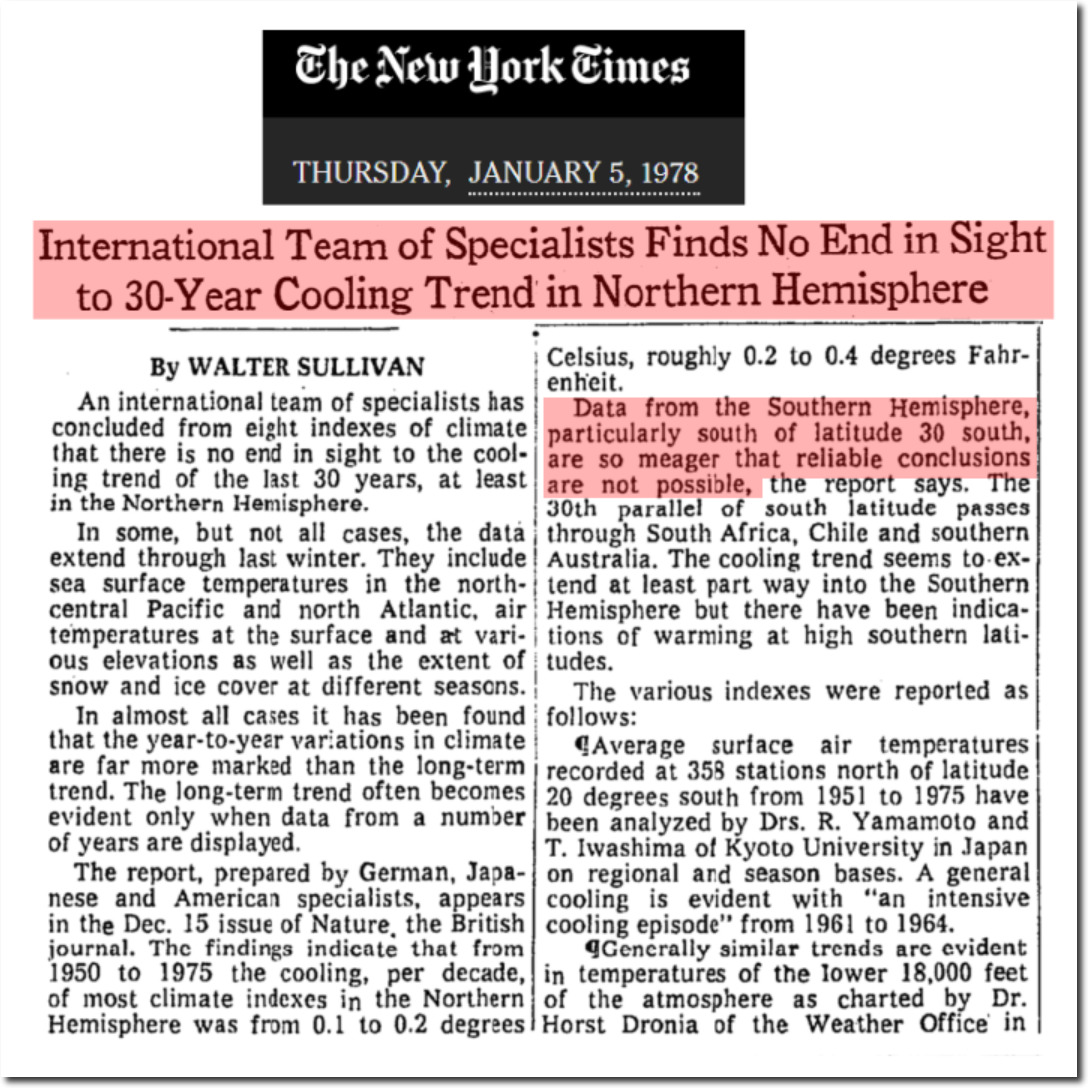
TimesMachine: January 5, 1978 – NYTimes.com
In 1989, NOAA’s top climate expert reported that most global warming occurred before 1919, and that earth cooled from 1921 to 1979. The scientific consensus has completely erased this inconvenient truth.
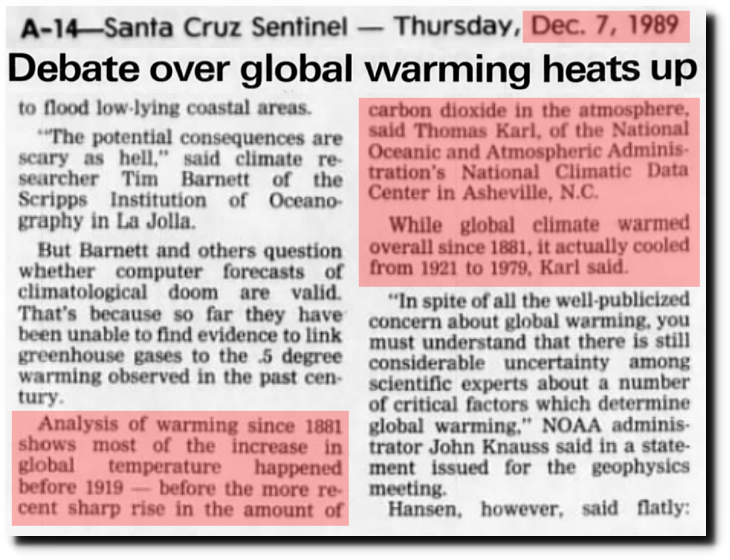
07 Dec 1989, Page 14 – Santa Cruz Sentinel at Newspapers.com
Not only is there very little land data available, but there is also very little ocean data too. Climategate E-mails showed that they are simply making much of the data up. Until about fifteen years ago, NASA and NOAA didn’t even attempt to include pre-1950 ocean data in their graphs.
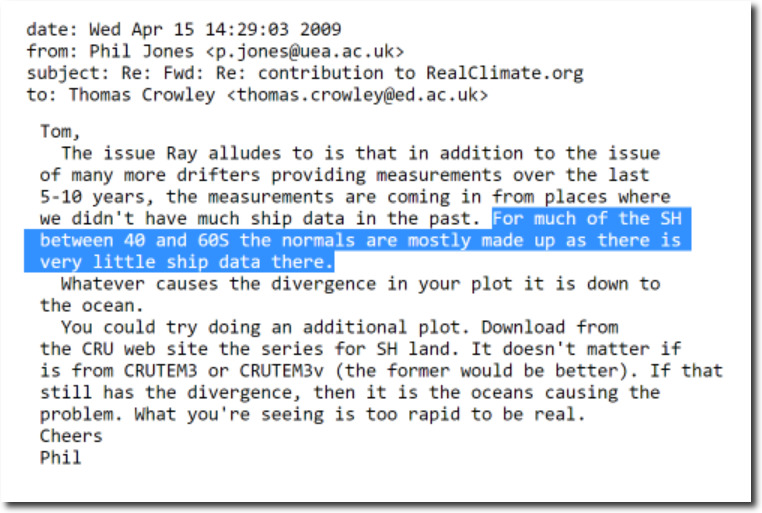
di2.nu/foia/foia2011/mail/2729.txt
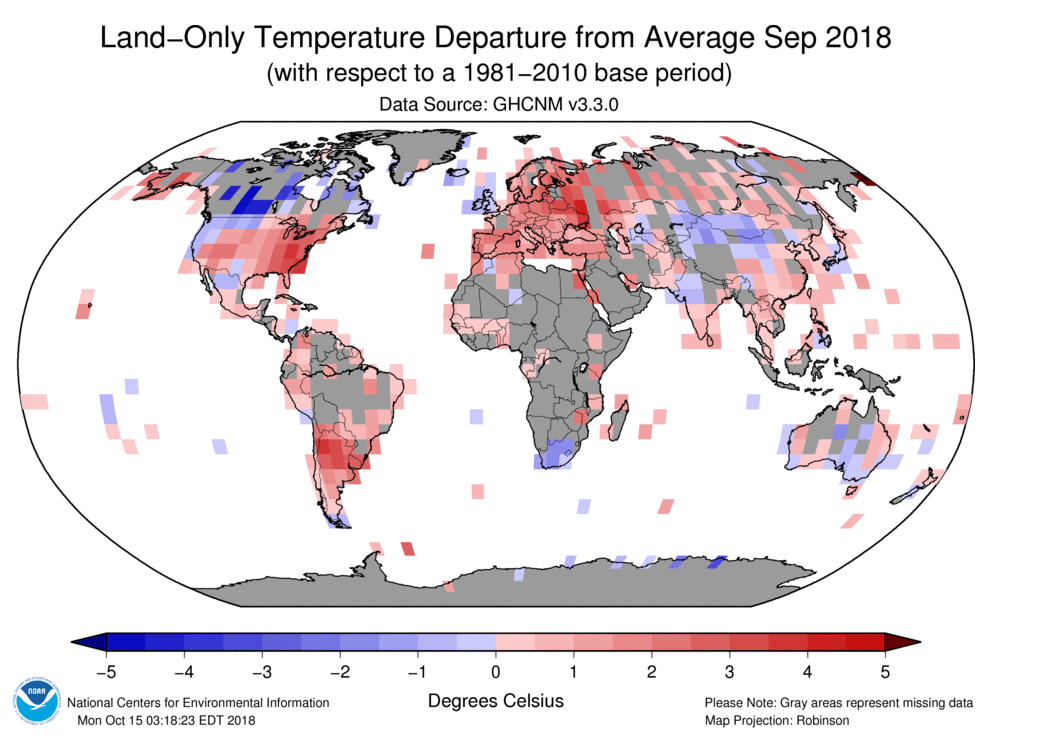
And even now, much of the data is fabricated. Last month NOAA showed Saudi Arabia record hot, even though they had no thermometer readings there.
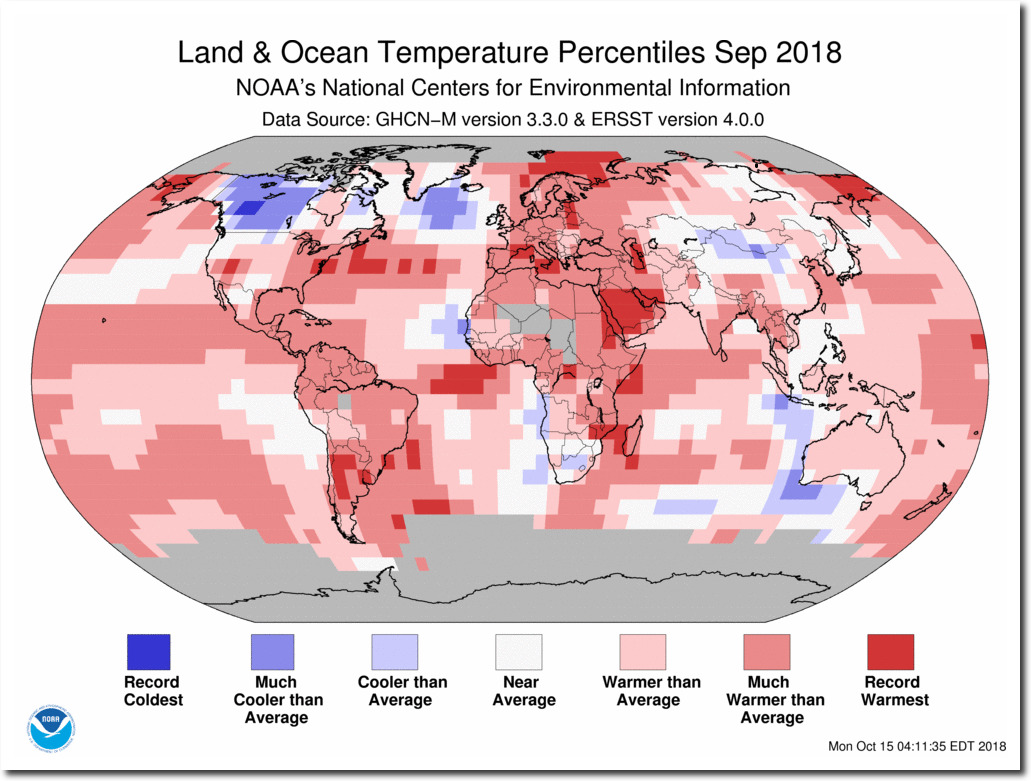
September-2018-Global-Temperature-Percentiles-Map.png (993×743)
Much of the land surface is gray, meaning “missing data.”
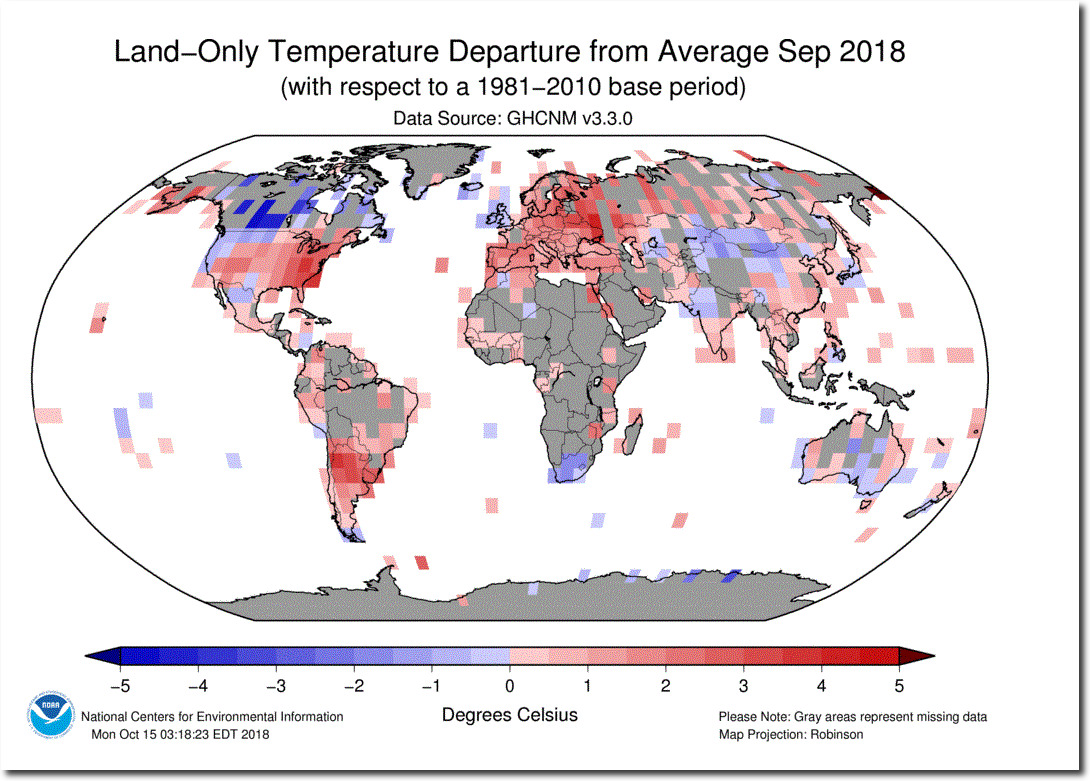
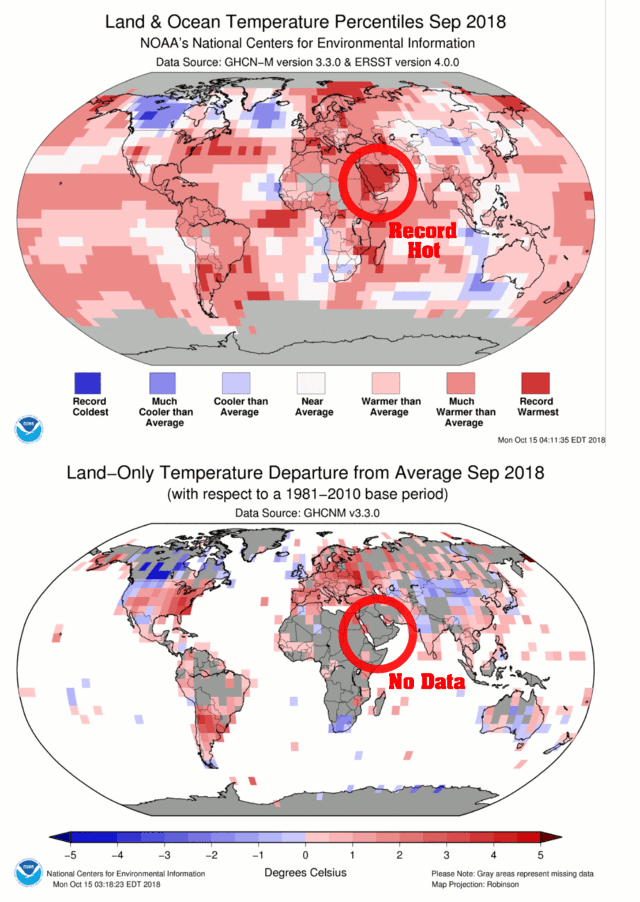
The only large area on the planet with good long-term temperature data is the US, and NOAA massively tampers with the data to turn cooling into warming.
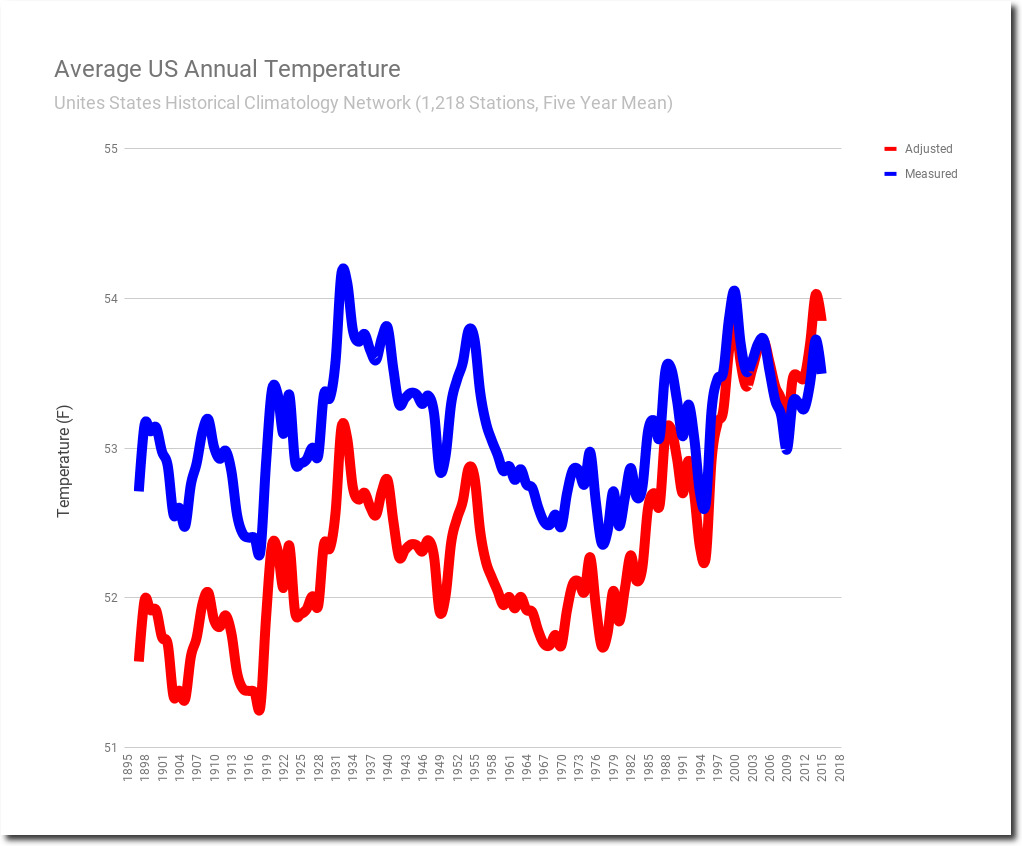
Spreadsheet Data
NOAA has accomplished this through a spectacular hockey stick of data tampering.
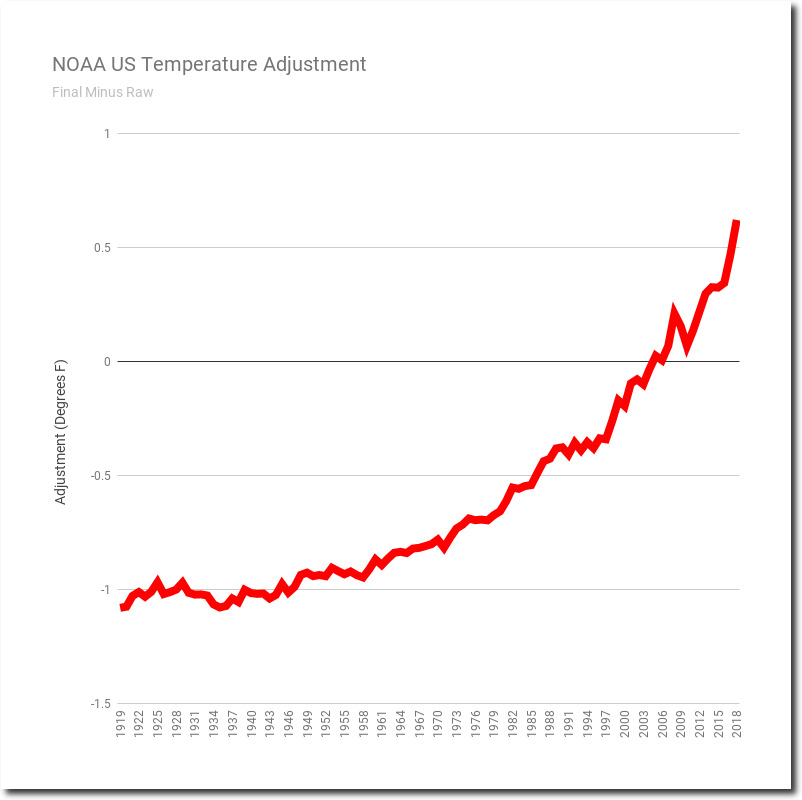
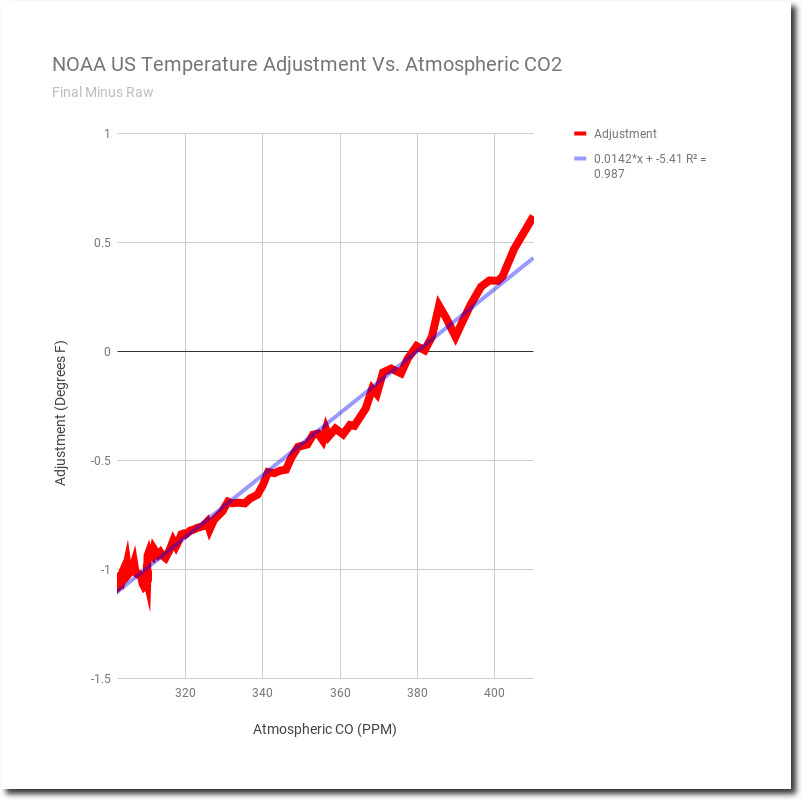
The adjustment being made correlates almost perfectly with atmospheric CO2. The ultimate example of junk science confirmation bias.
In 1989, NOAA reported that there was no trend in the US climate over the prior century.
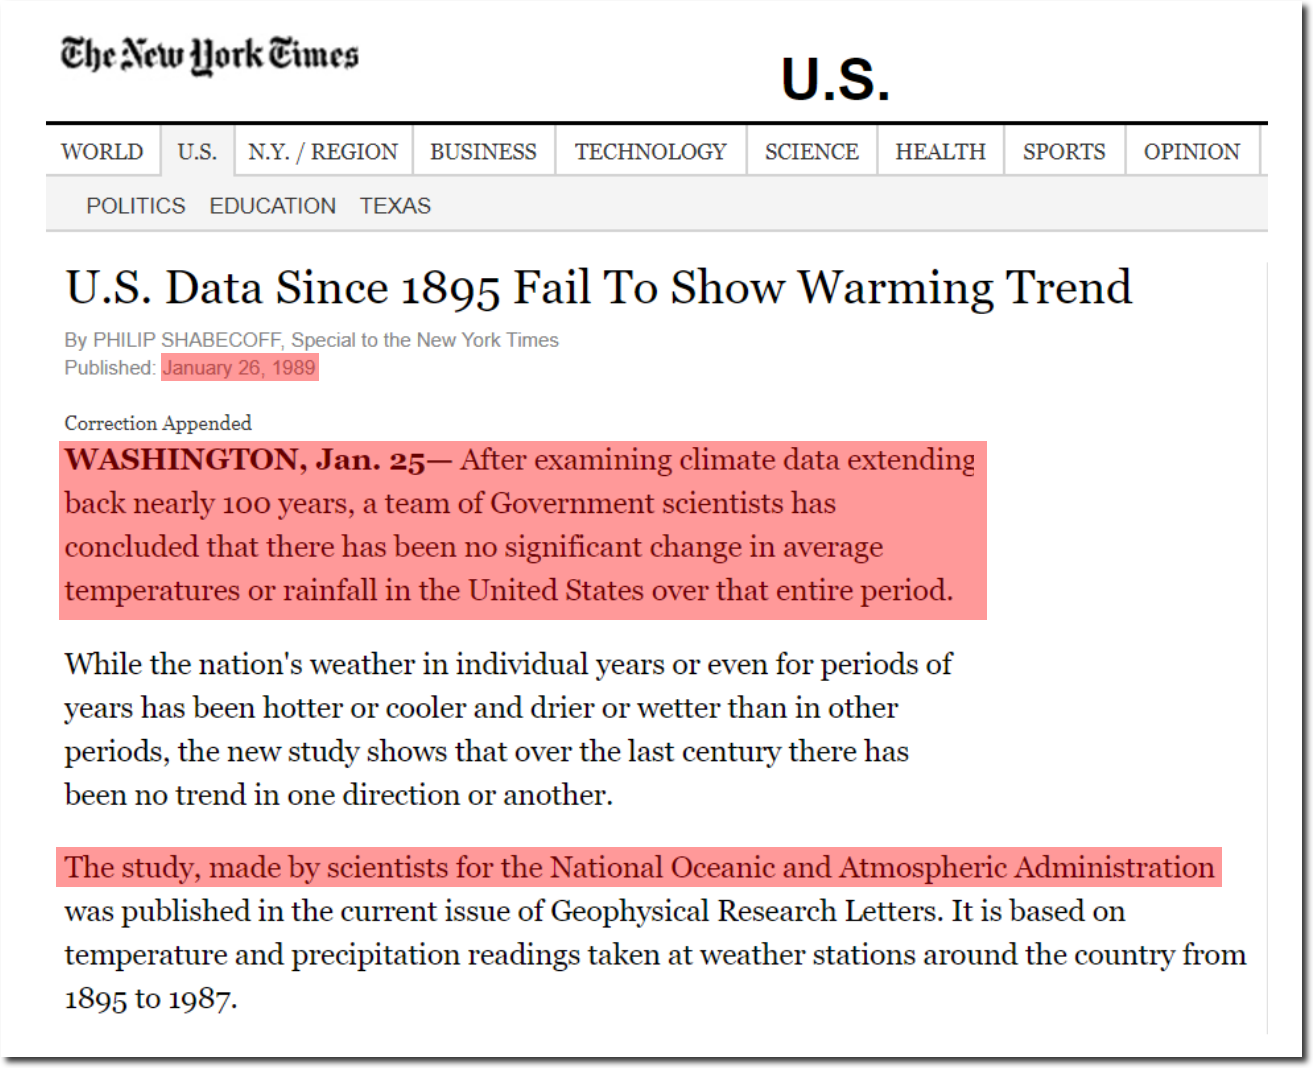
U.S. Data Since 1895 Fail To Show Warming Trend – NYTimes.com
In 1999, NASA’s James Hansen lamented that the US was not warming.
How can the absence of clear climate change in the United States be reconciled with continued reports of record global temperature?
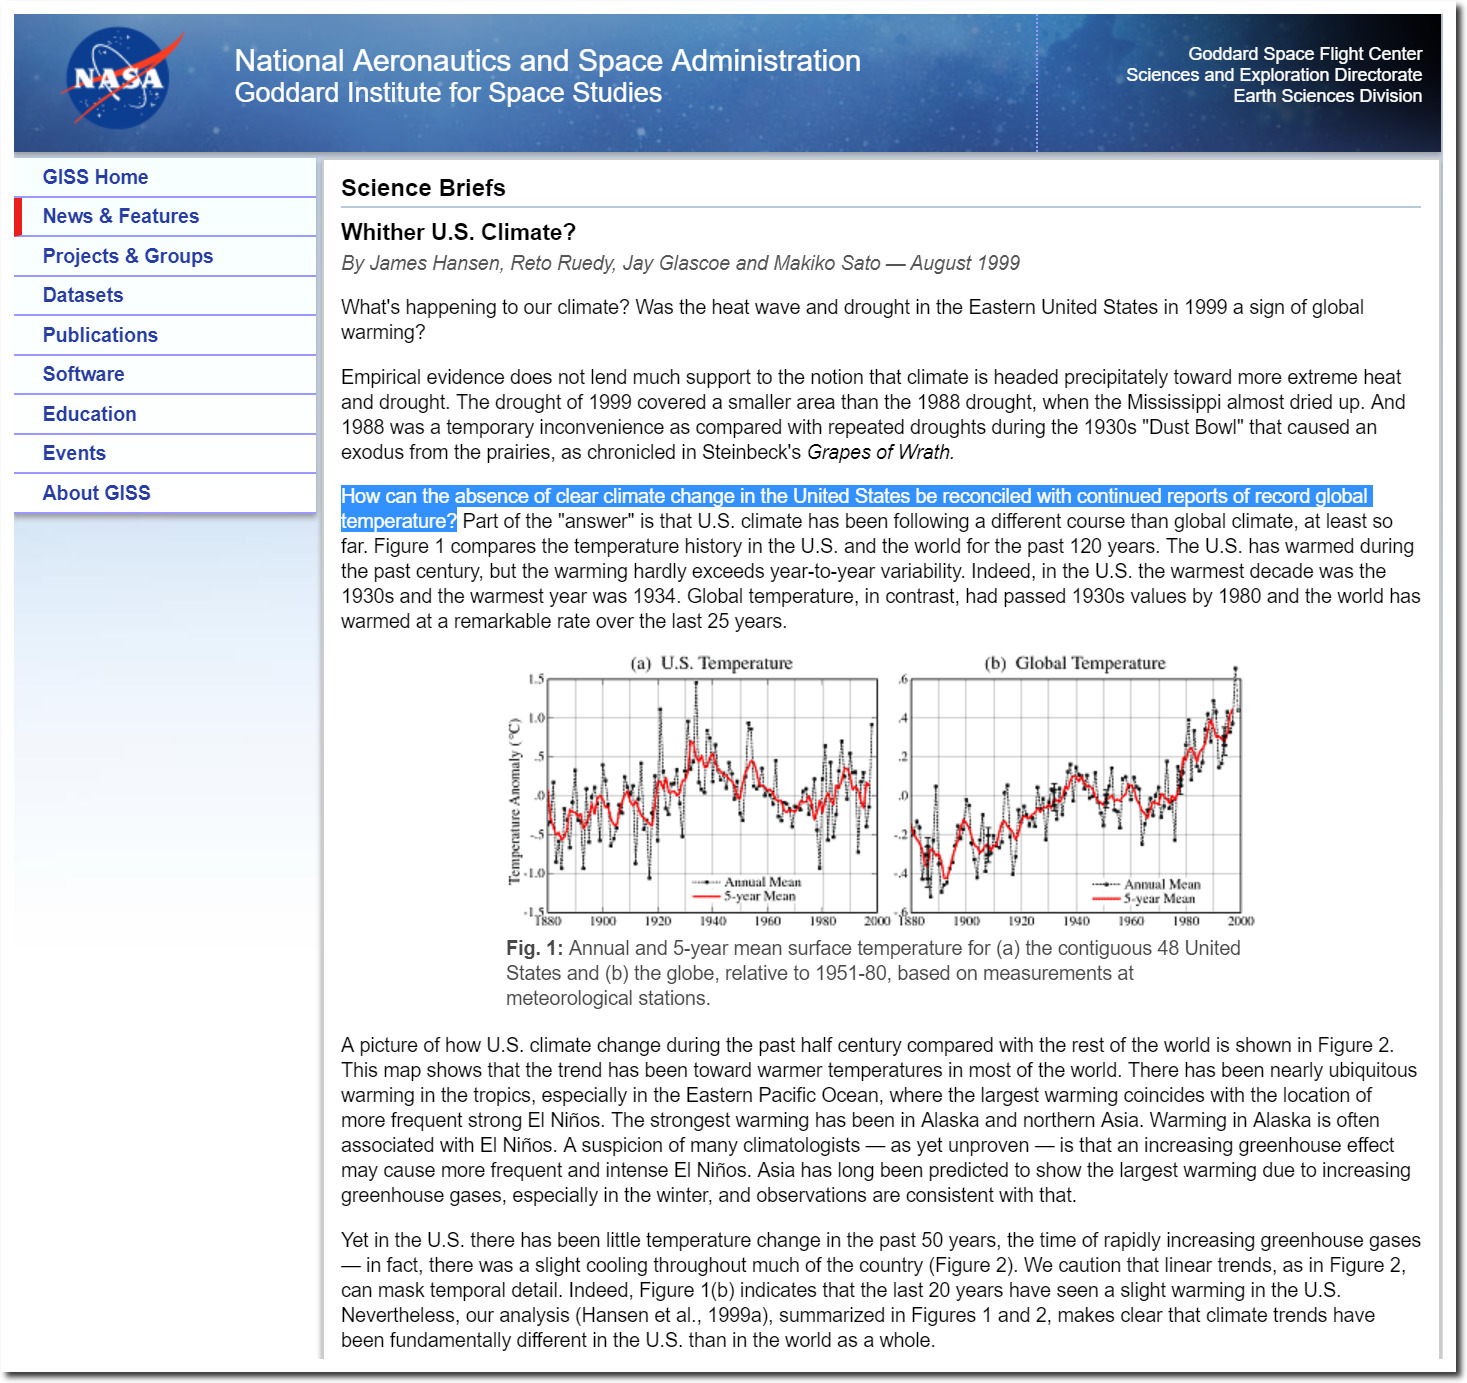
NASA GISS: Science Briefs: Whither U.S. Climate?
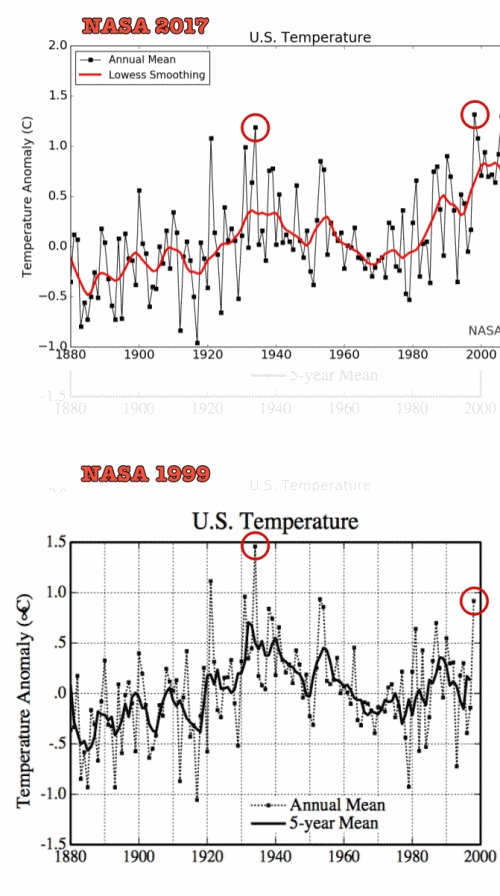
So he simply changed his own data, to turn cooling into warming.
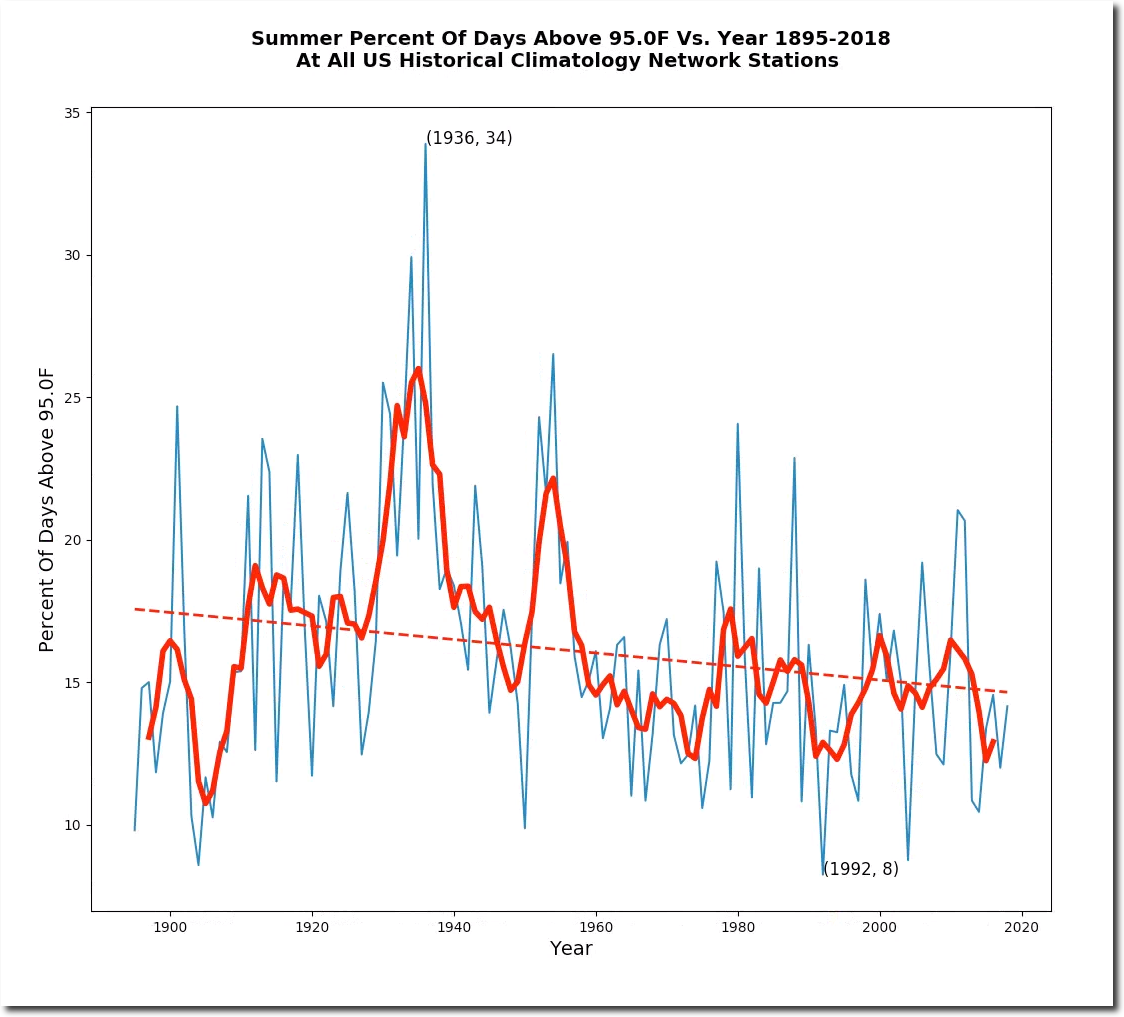
The frequency of hot afternoons has actually plummeted in the US over the past century.
Climate scientists took the best temperature data set in the world (the US temperature record) and corrupted it to match the generally worthless global temperature record. And sadly, one of the two satellite temperature data sets has become corrupted recently too. Three years ago, Carl Mears at Remote Sensing Systems was coming under tremendous pressure from the climate community to show some troposphere warming.
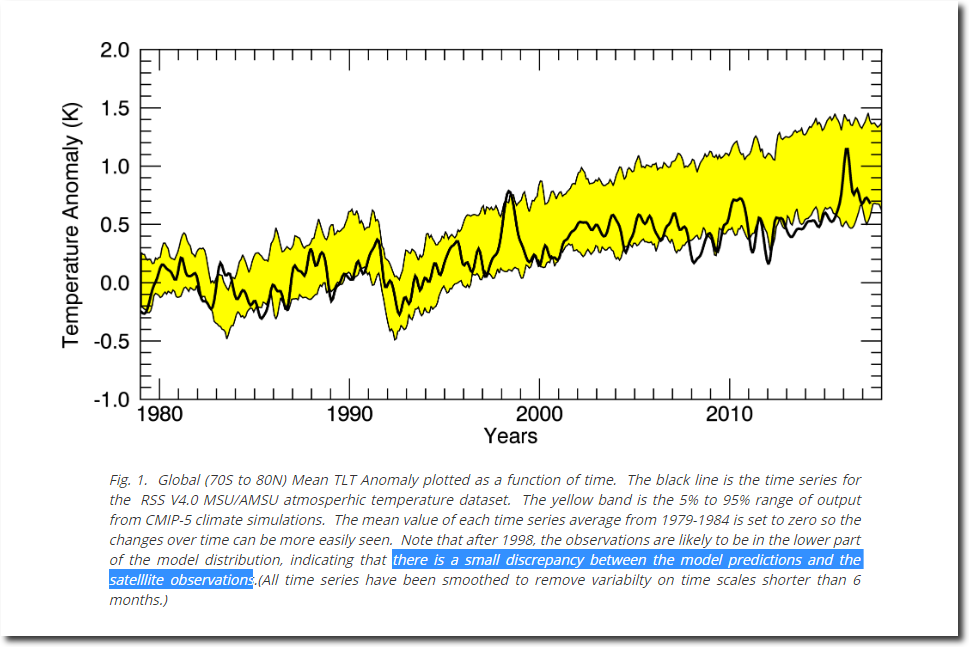
Note that after 1998, the observations are likely to be below the simulated values, indicating that the simulation as a whole are predicting too much warming.
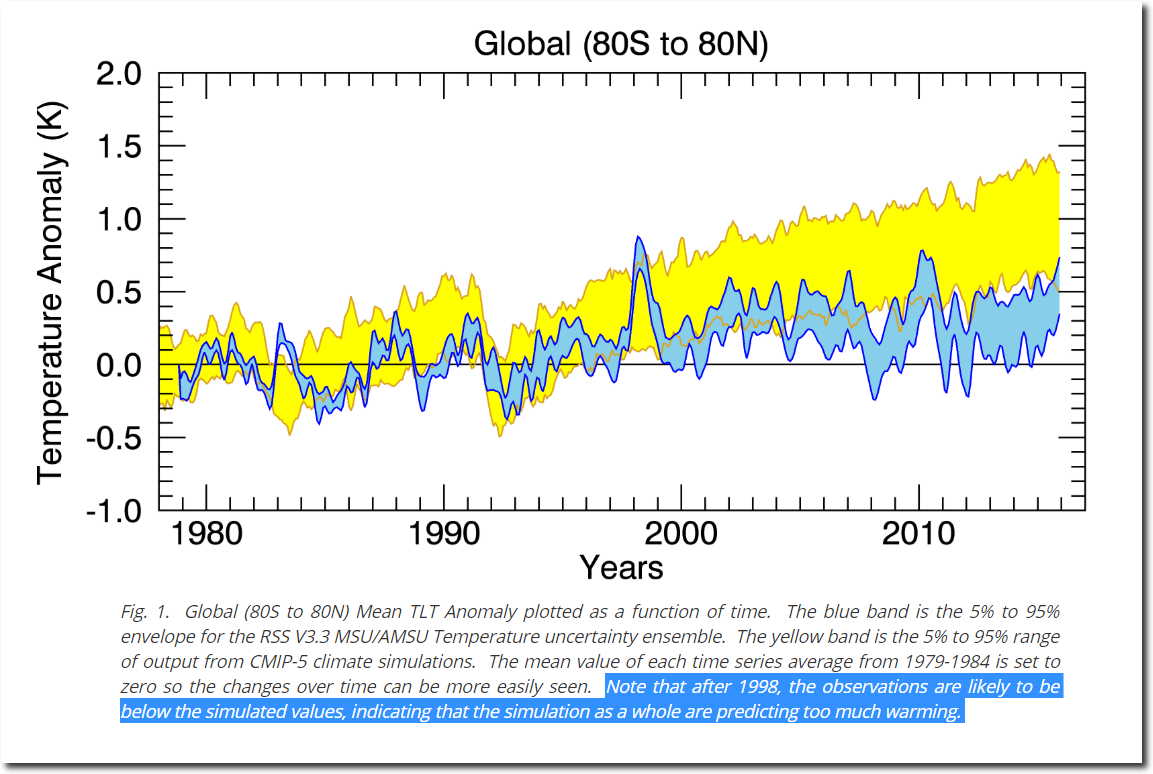
Climate Analysis | Remote Sensing Systems
I predicted in 2015 that he would give in to the pressure and alter his data.
Look for the satellite data to be adjusted to bring it into compliance with the fully fraudulent surface temperatures. The Guardian is now working to discredit UAH, so it seems likely that RSS will soon be making big changes – to match the needs of the climate mafia. Bookmark this post.

Dr. Roy Spencer also predicted this :
“I expect there will soon be a revised TLT product from RSS which shows enhanced warming, too.
Here’s what I’m predicting:
1) neither John Christy nor I will be asked to review the paper
2) it will quickly sail through peer review (our UAH V6 paper is still not in print nearly 1 year after submission)
3) it will have many authors, including climate model people and the usual model pundits (e.g. Santer), which will supposedly lend legitimacy to the new data adjustments.
Let’s see how many of my 3 predictions come true.
-Roy”
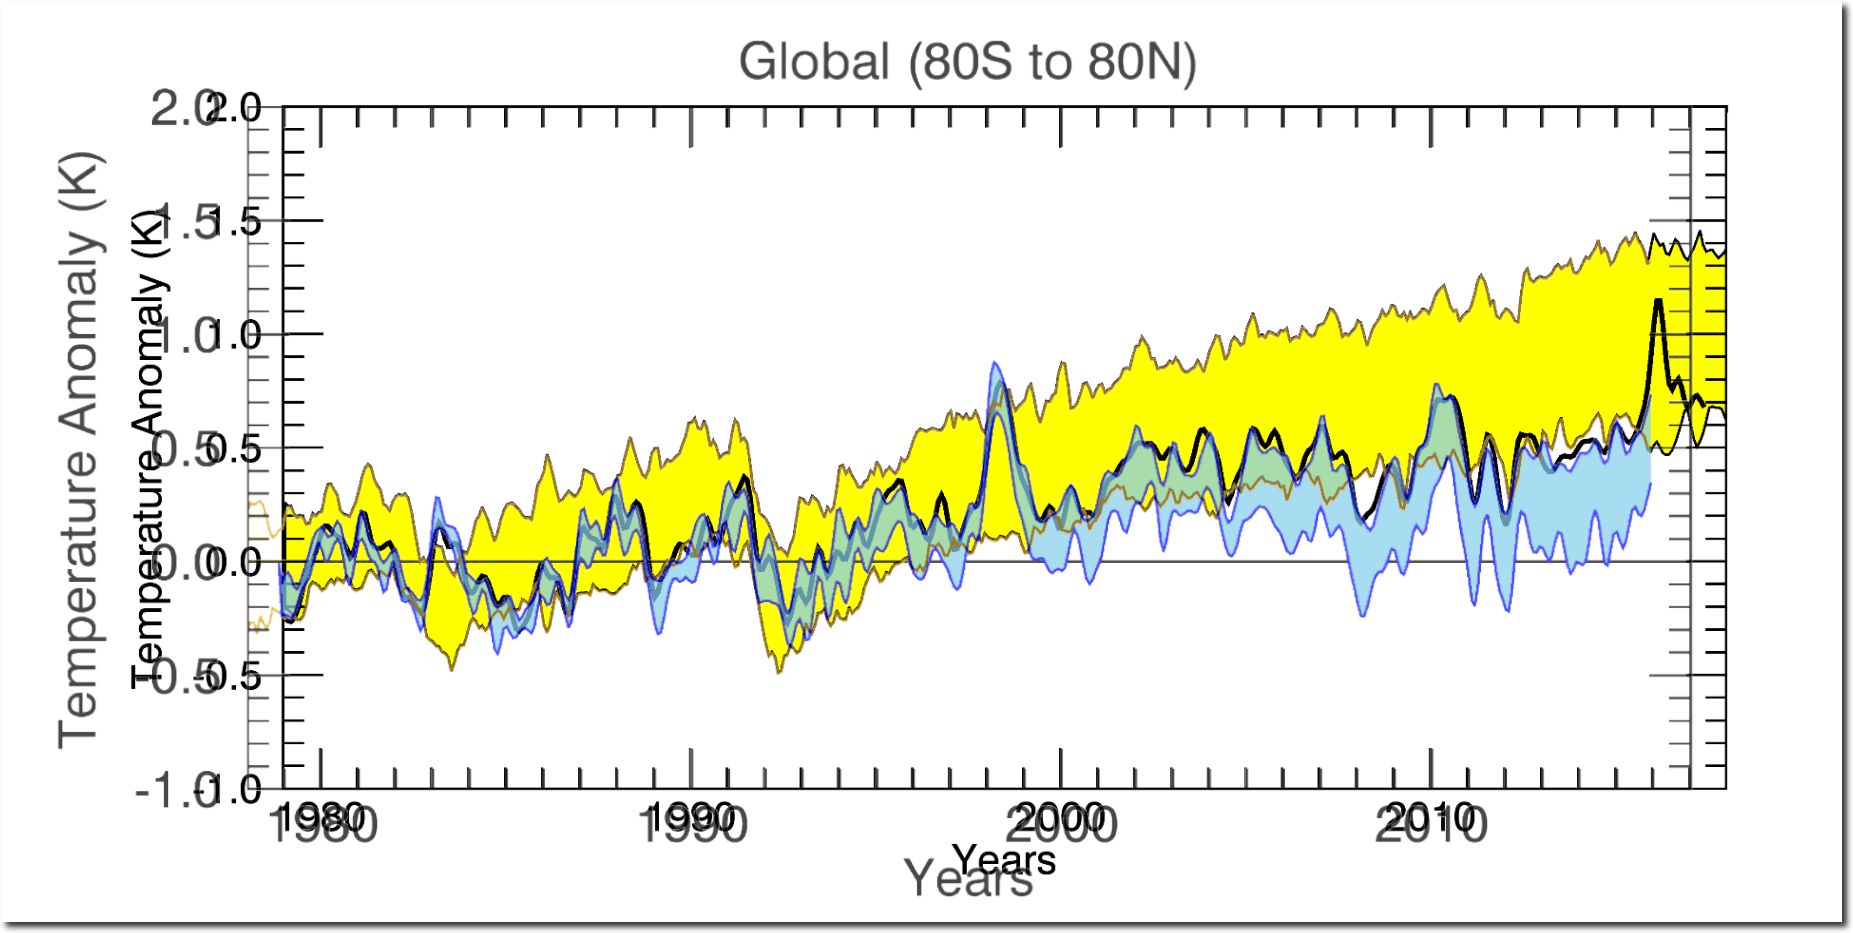
And that is exactly what happened. Mears altered his own data to make the models look slightly better. The large discrepancy became a small discrepancy.
there is a small discrepancy between the model predictions and the satellite observations
The image below overlays Mears’ old graph on his new one. It is clear what he did – he eliminated the blue error interval, and started using the high side of the interval as his temperature. Science by peer-pressure is not science.
In summary, the close agreement between the temperature sets is a result of collusion, group think, scientific corruption, thuggery and junk science. It has nothing to do with climate. There is no conceivable way that independent groups could have come up with the same graph.
Posted in Uncategorized
Leave a comment