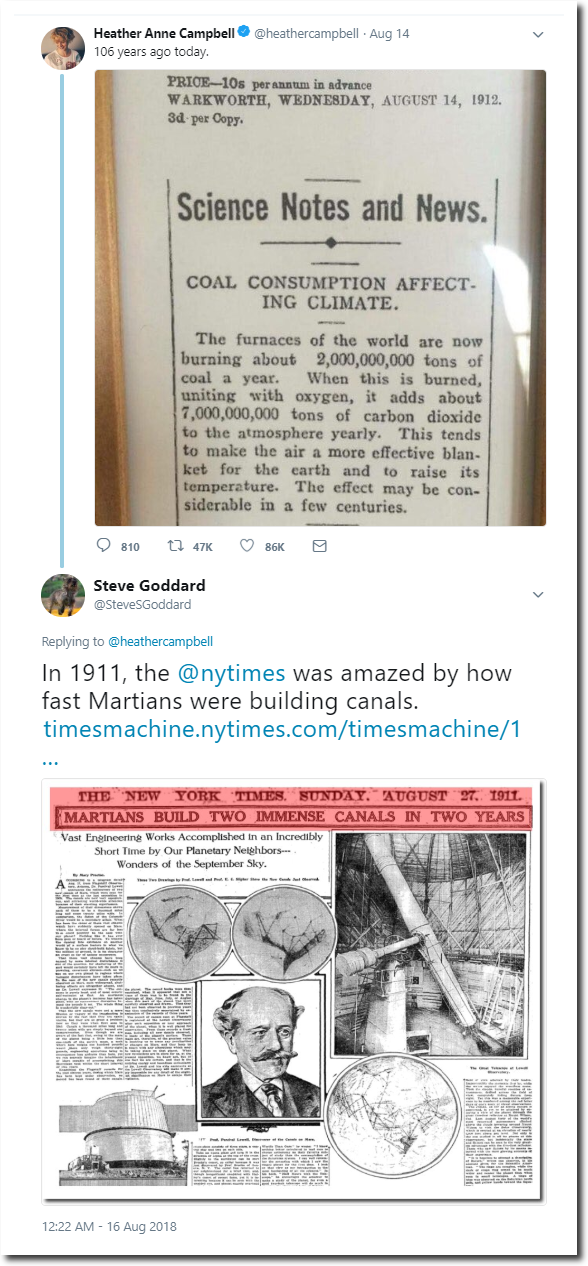
None.
In Shakespeare’s time, it was assumed that human actions affected weather
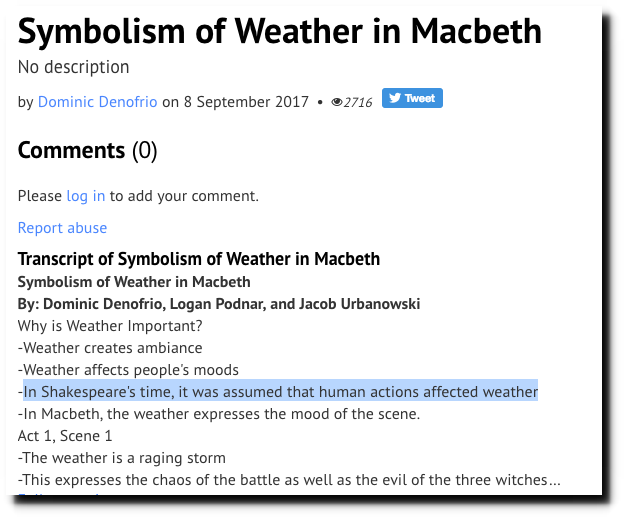
Symbolism of Weather in Macbeth by Dominic Denofrio on Prezi
None.
In Shakespeare’s time, it was assumed that human actions affected weather
Symbolism of Weather in Macbeth by Dominic Denofrio on Prezi
Ice conditions are not looking good for Reggie, James and Al.
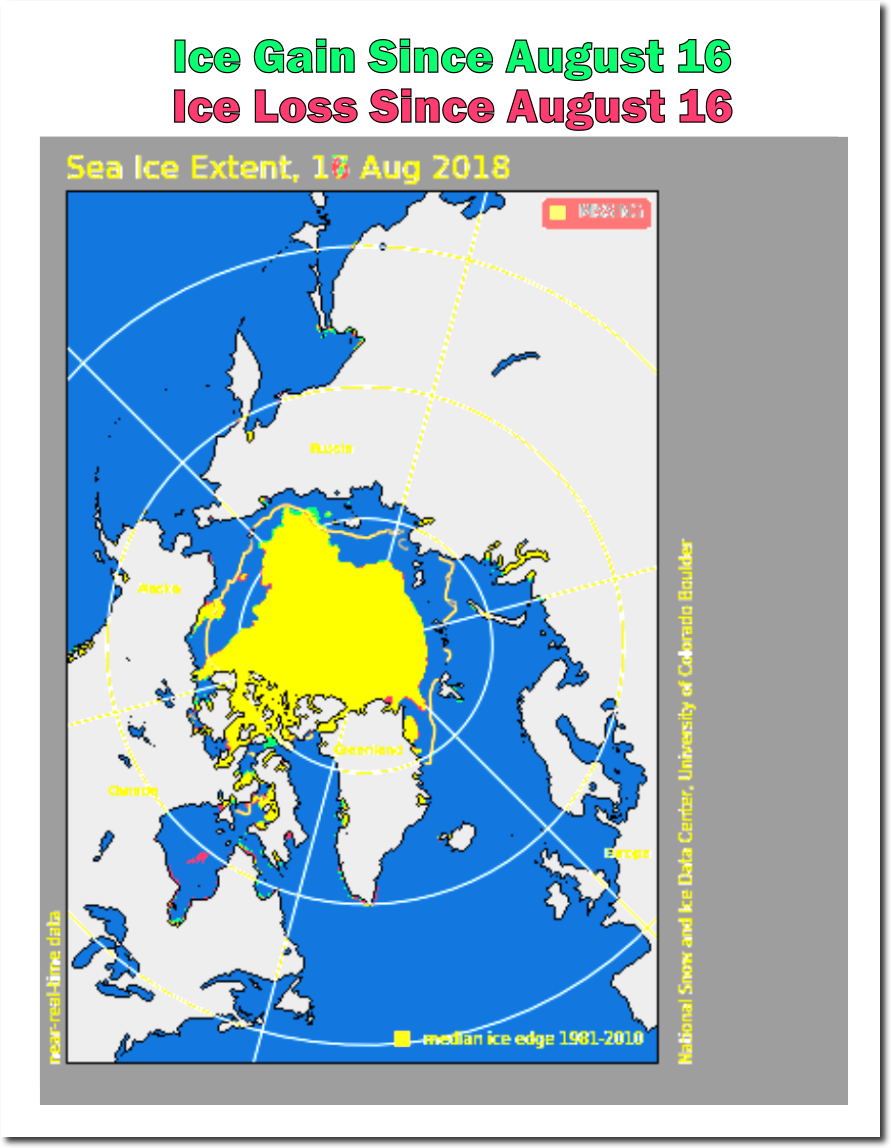
Index of /DATASETS/NOAA/G02135/north/daily/images/2018/08_Aug/
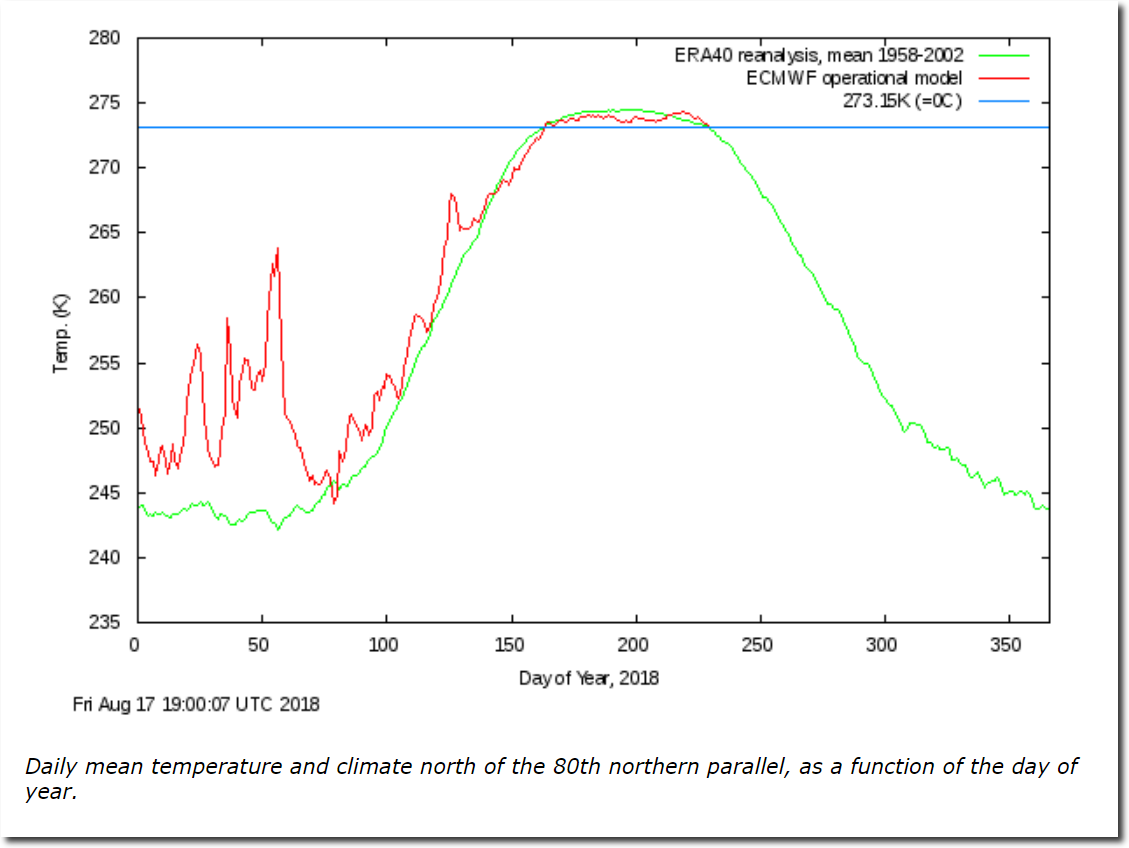
Summer is over at the North Pole.
Ocean and Ice Services | Danmarks Meteorologiske Institut
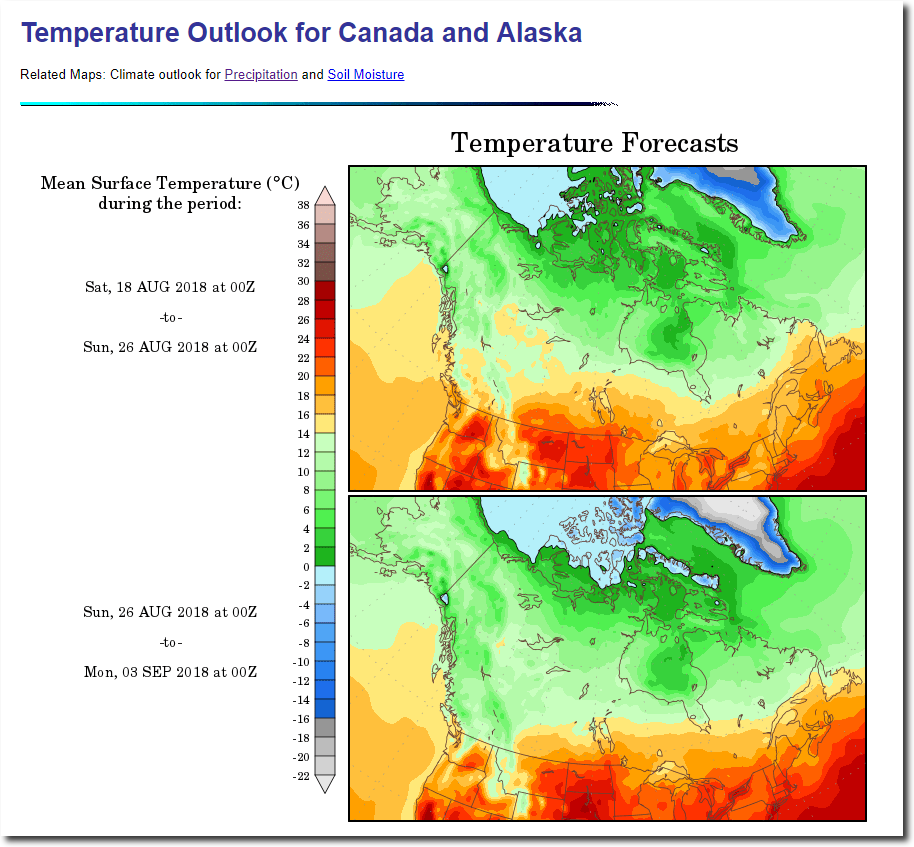
And nothing but cold in the forecast.
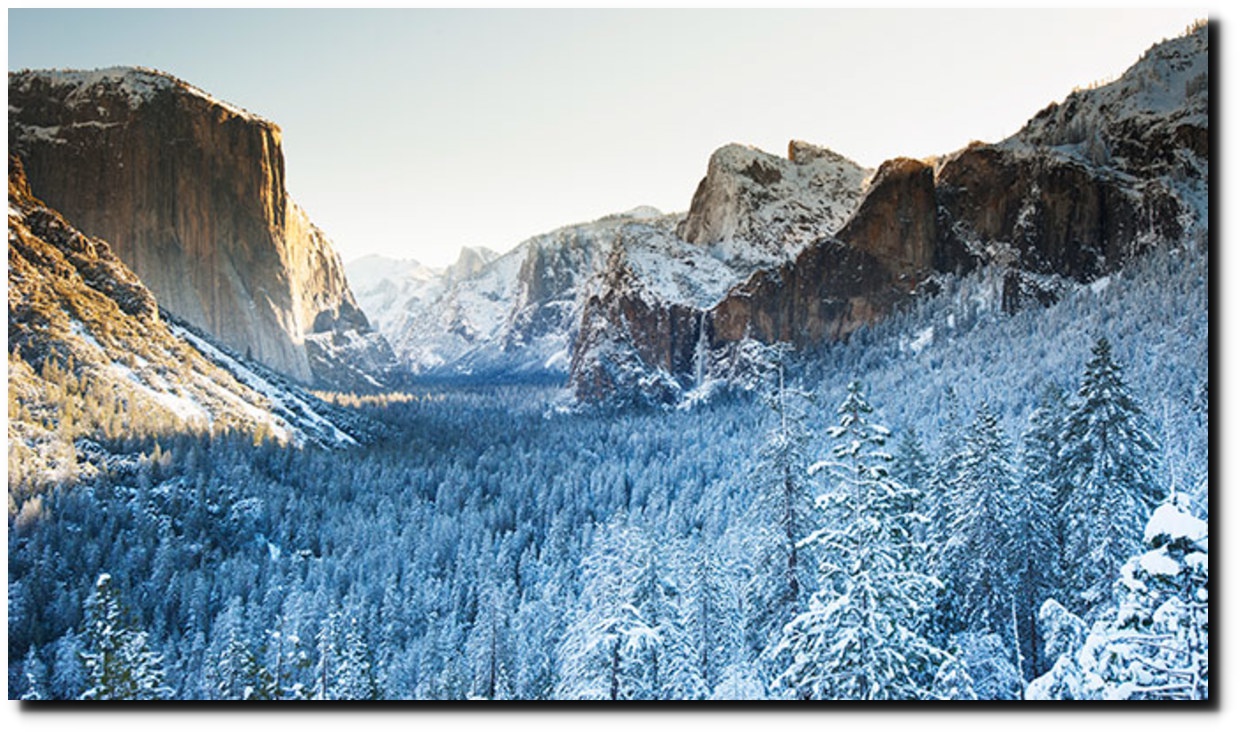
During the week of July 19-25, 1915, afternoon temperatures at Yosemite National Park headquarters were over 110 degrees every day, averaged 112 degrees, and peaked at 115 degrees on July 20.

The only other year when Yosemite reached 110 degrees was a year earlier in 1914 – and in 1913, Death Valley, CA set the world’s record temperature of 134 degrees.
California was very hot when CO2 levels were low, but that certainly doesn’t stop climate scientists from lying about the non-existent relationship between heatwaves and atmospheric CO2.
I have hesitated to discuss California temperatures until I had tools in place to analyze it properly, and I do now. NOAA shows maximum temperatures in California rising rapidly, and particularly a big jump after 2012.
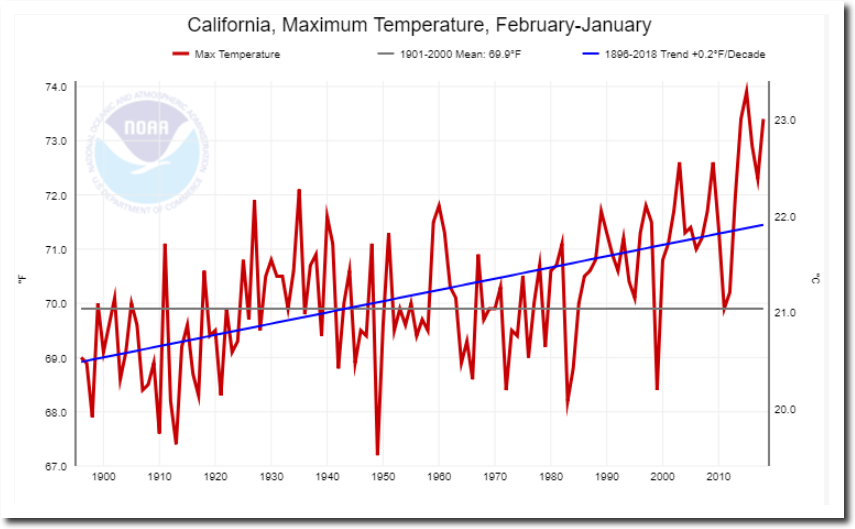
Climate at a Glance | National Centers for Environmental Information (NCEI)
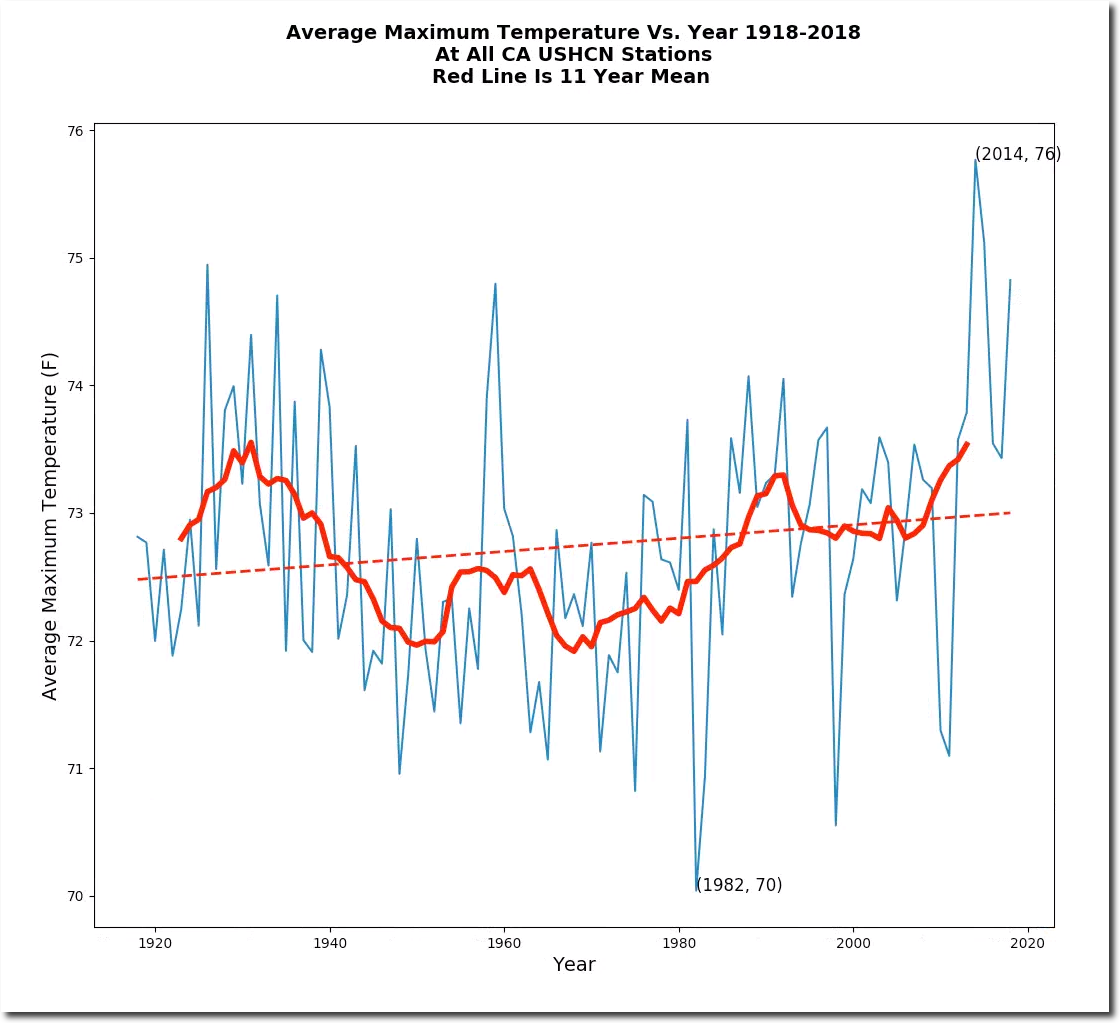
The actual average maximum thermometer data shows no net change over the past century prior to 2012, but a big jump over the past six years. (I excluded Death Valley from this analysis, because they started reporting in the 1960’s and cause a fake long term warming bias on the right side of the graph.)
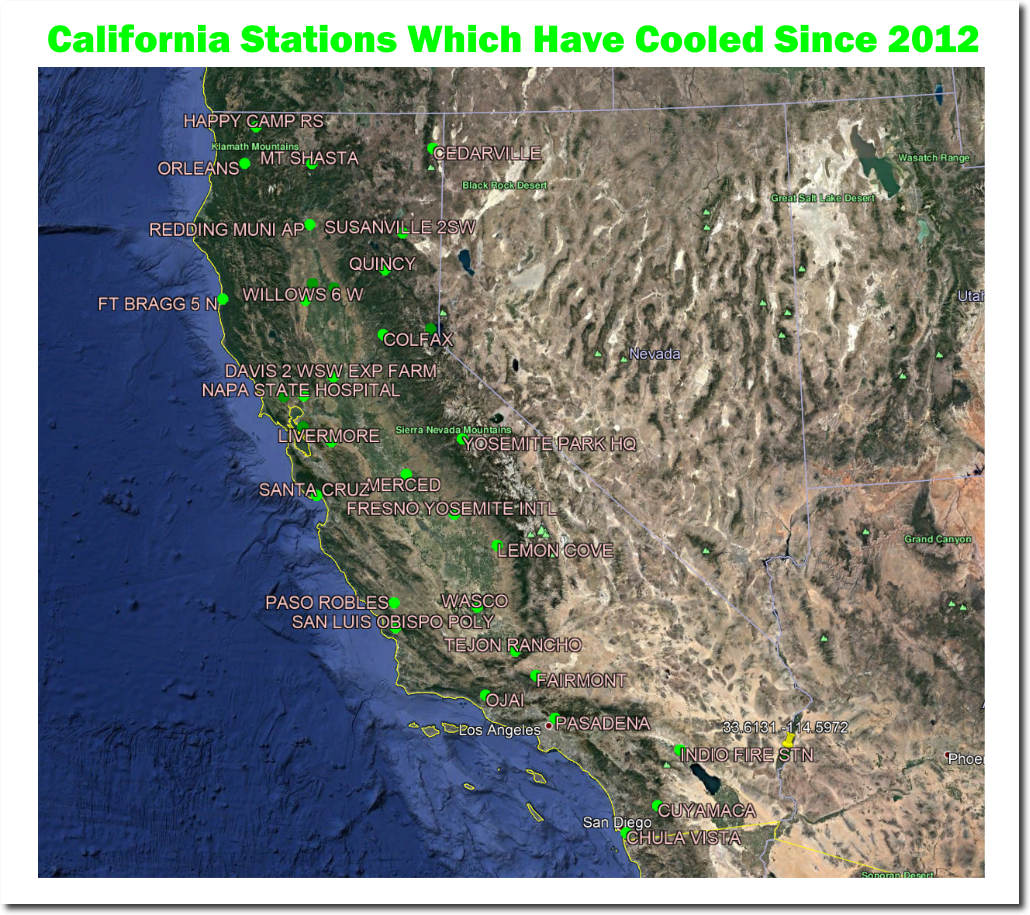
However, something is seriously wrong. There are 53 USHCN stations in California, and only nine show warming since 2012, but thirty-one stations show cooling since 2012. Whatever is causing the post-2012 spike is not real. It must be something along the lines of cooler stations not reporting as many days as the warmer stations. I haven’t figured it out yet, but am quite certain that whatever is causing the recent spike in temperature is a data artifact.
Additionally, there are quite a few California stations which show long term cooling in their afternoon temperatures.

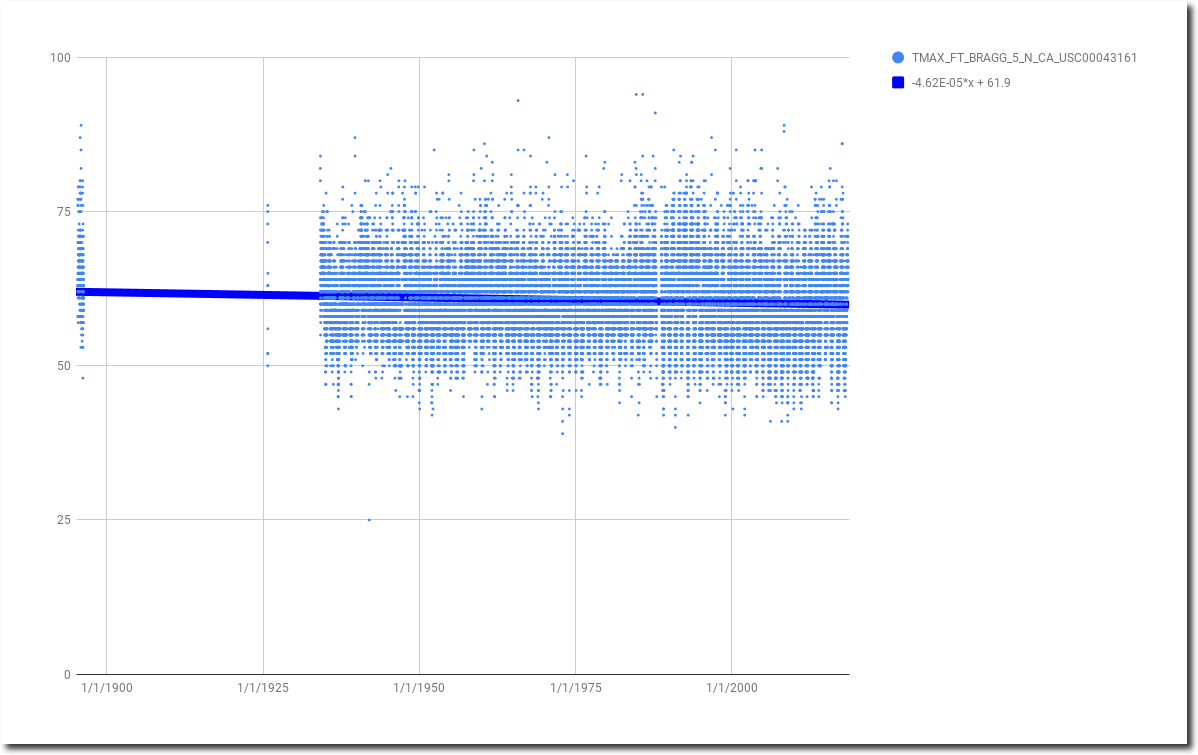

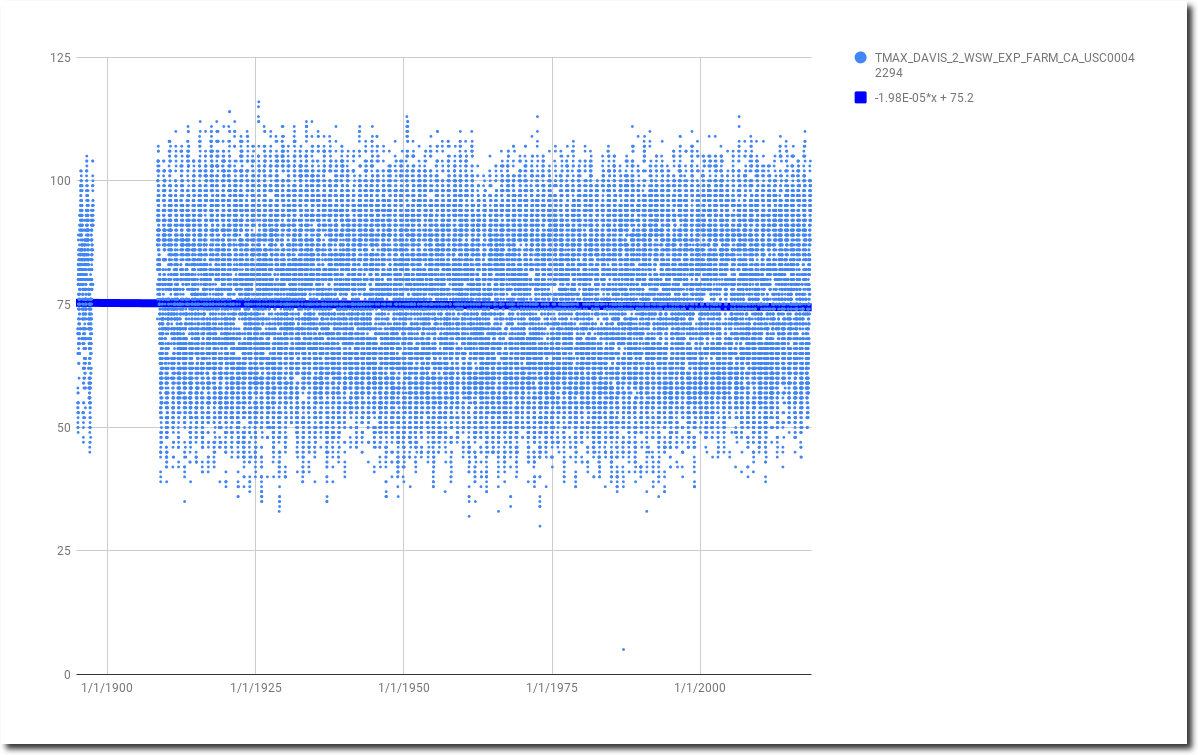
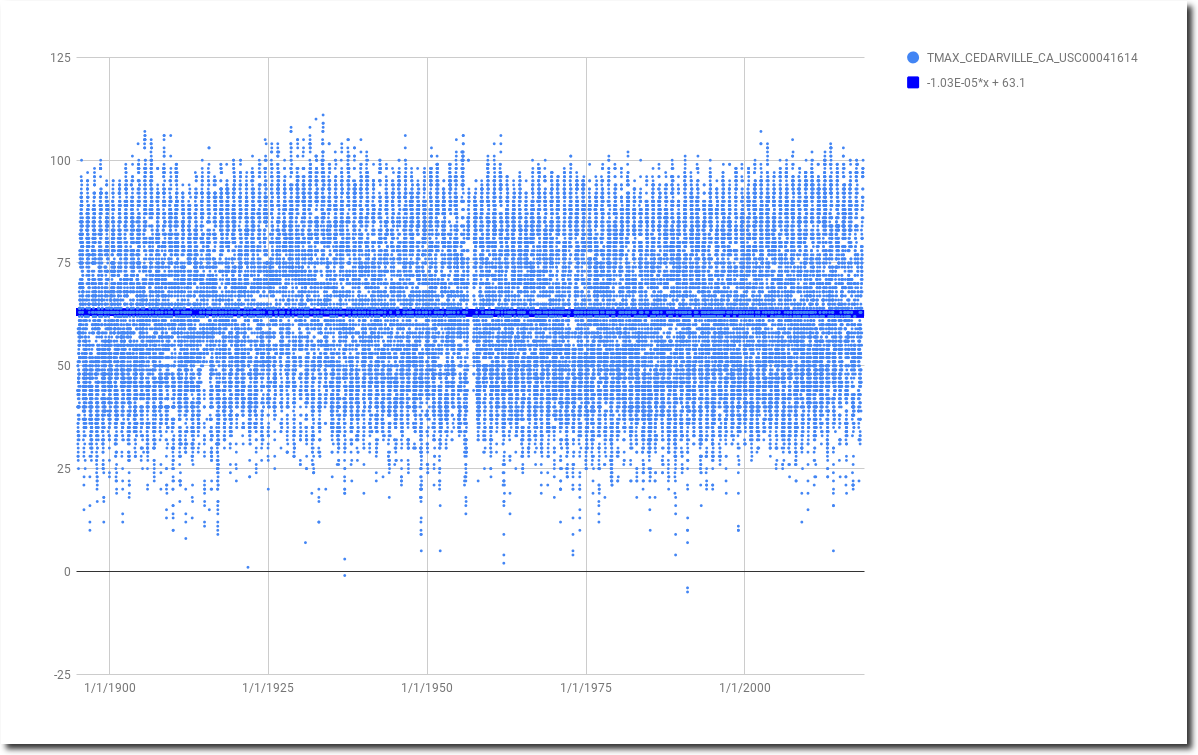
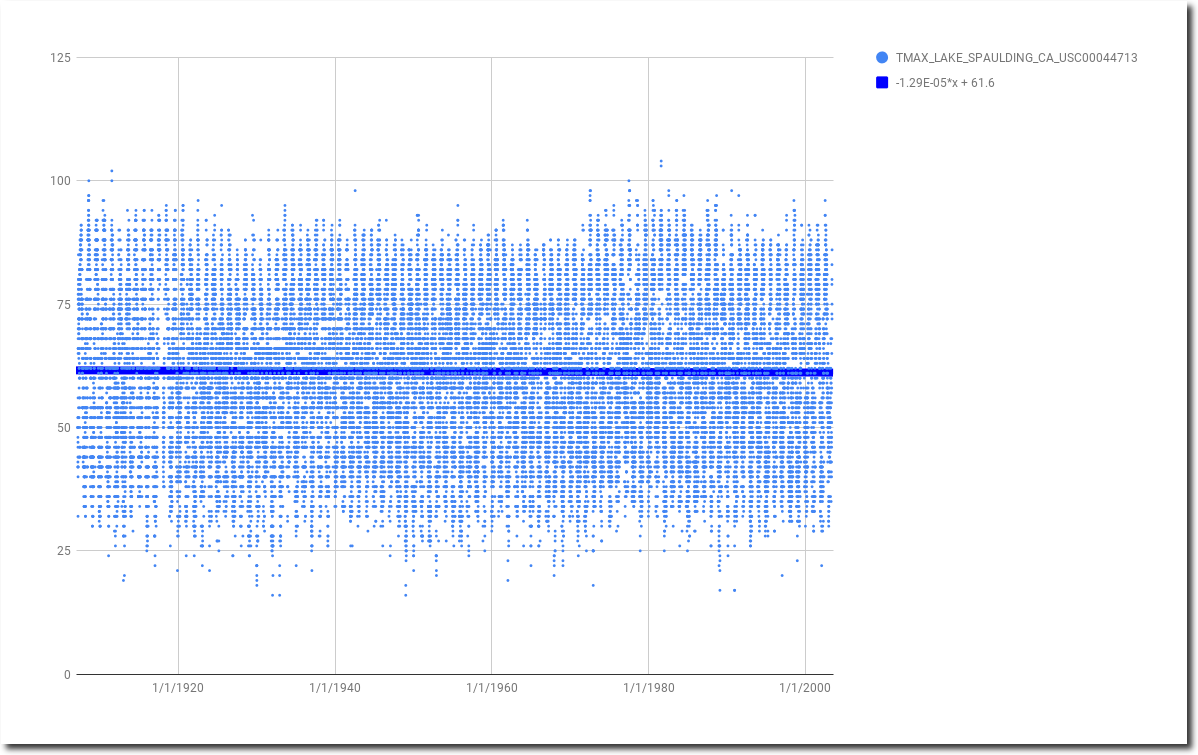
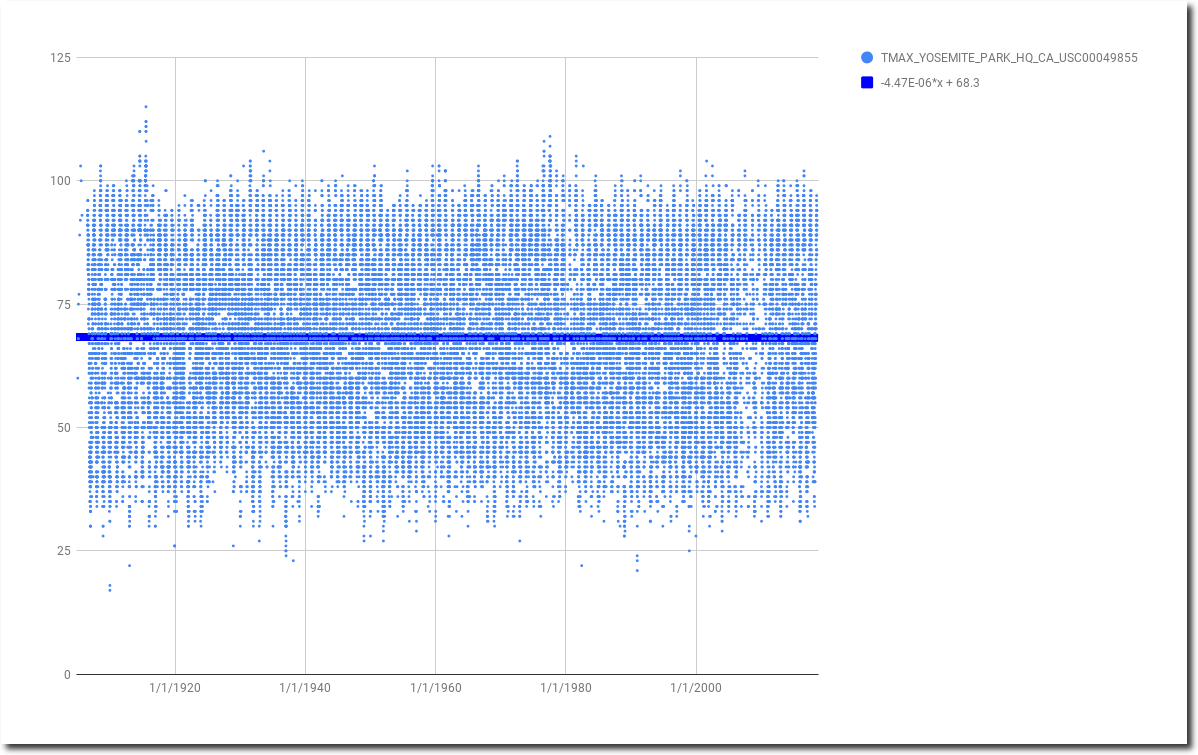
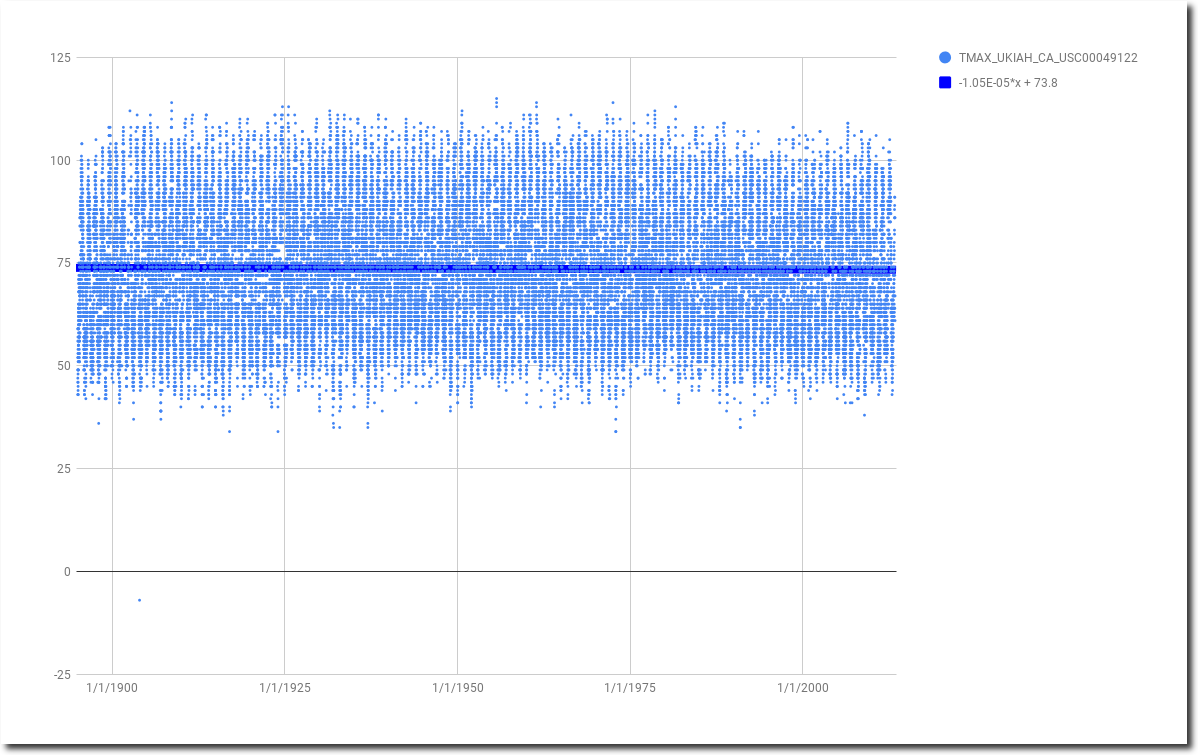
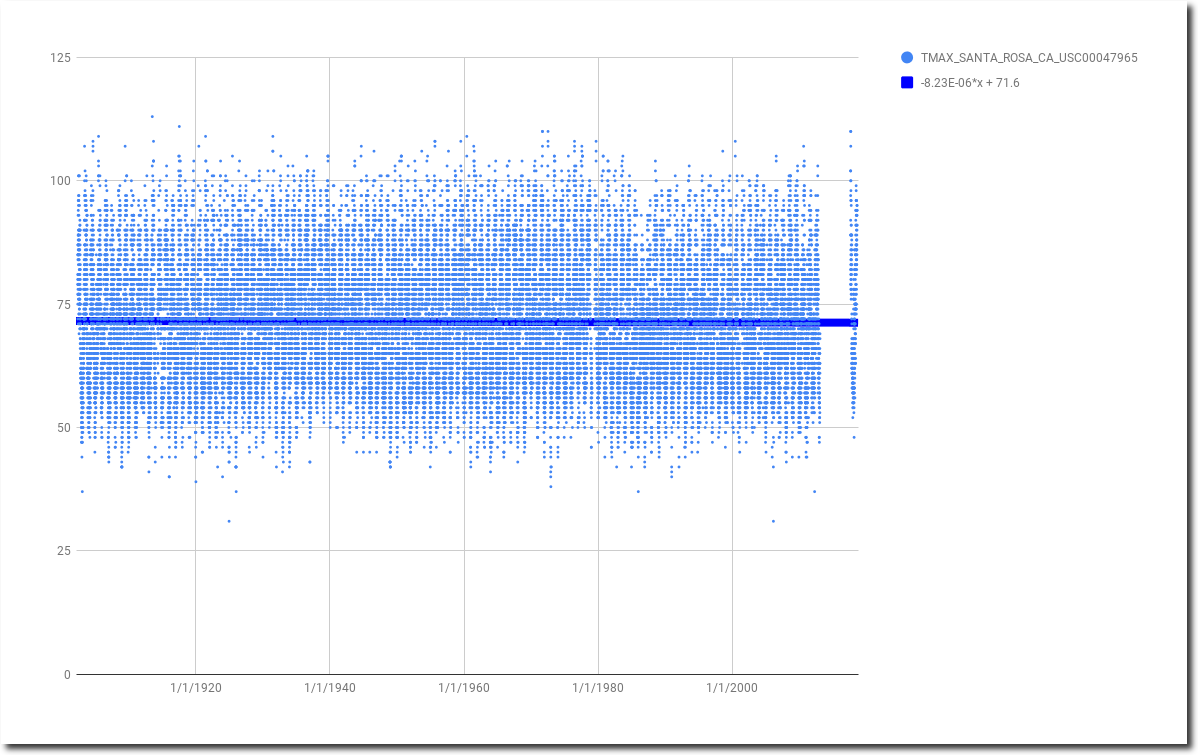
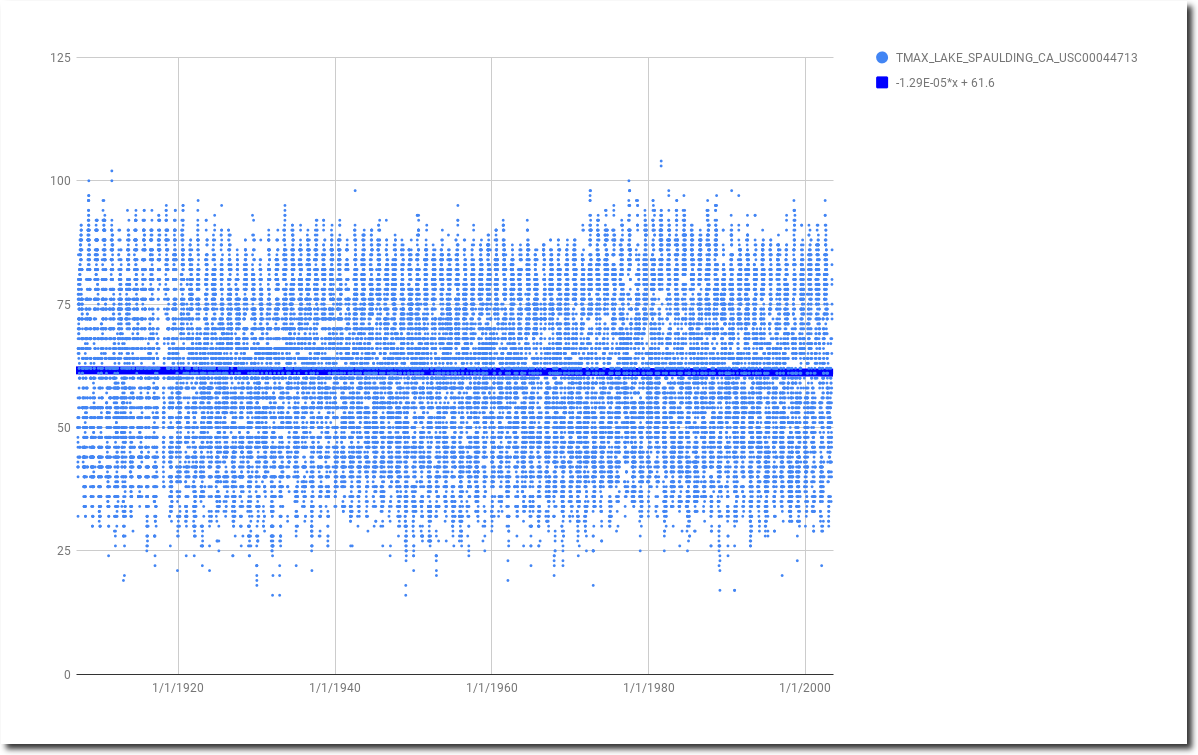
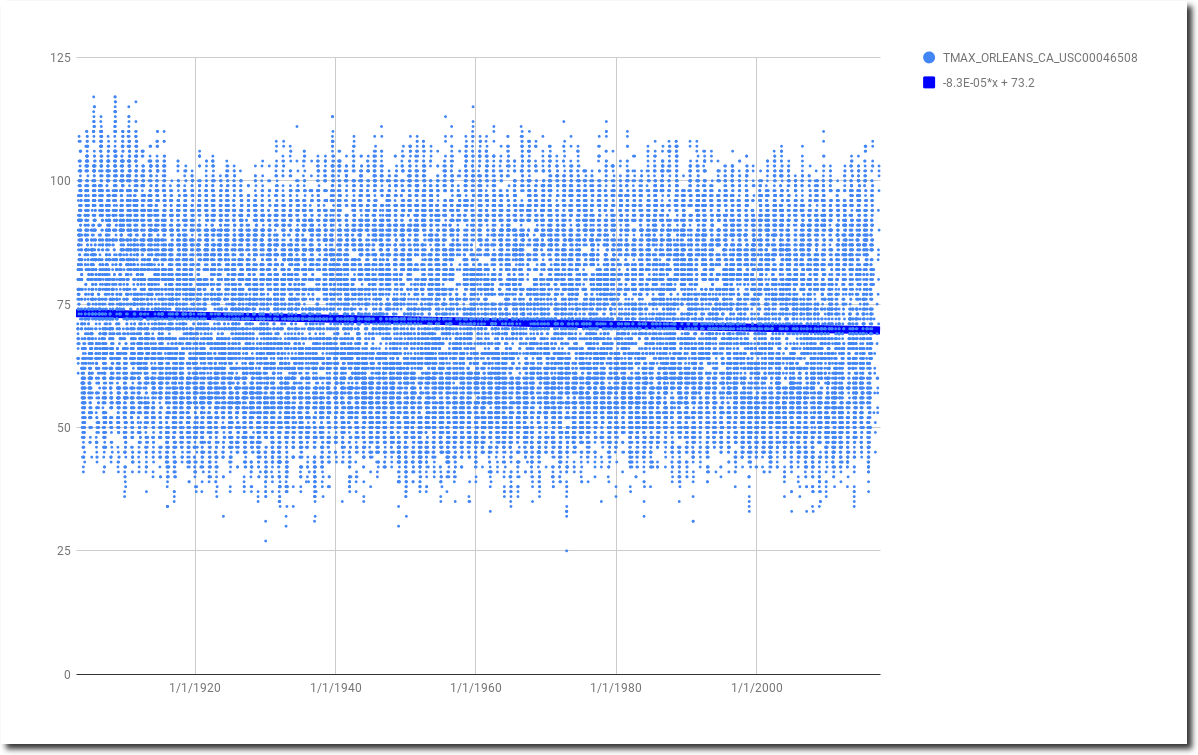

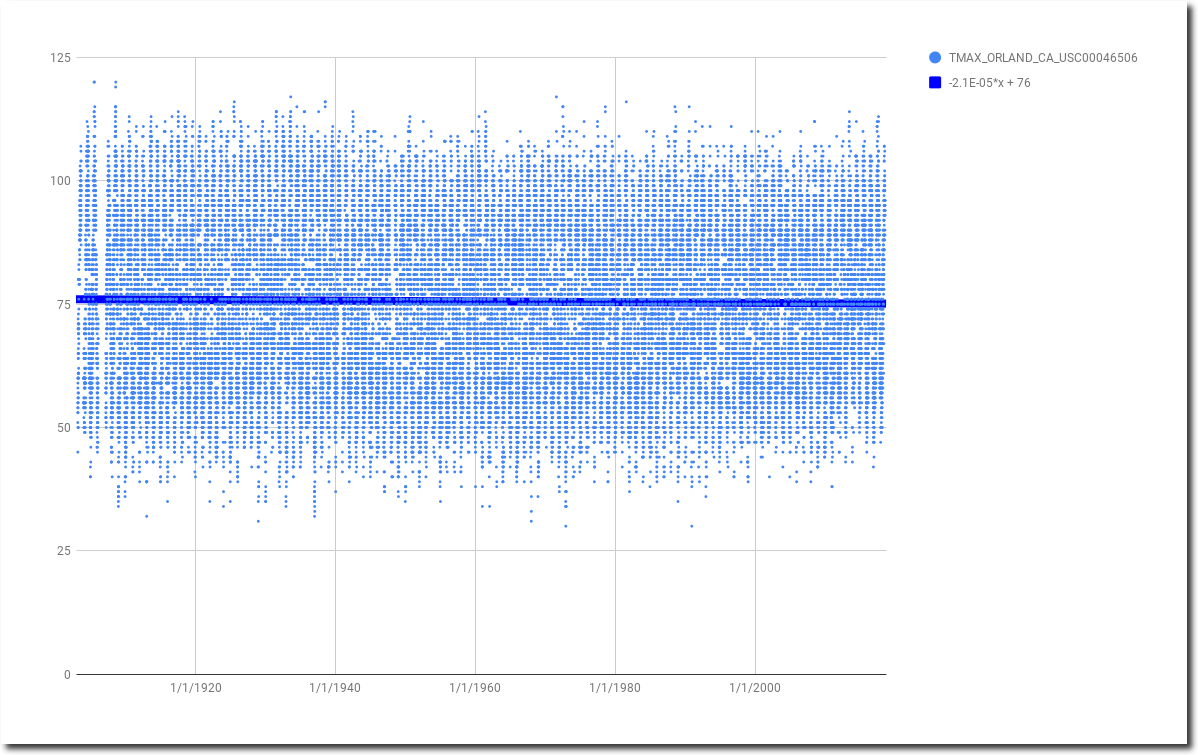

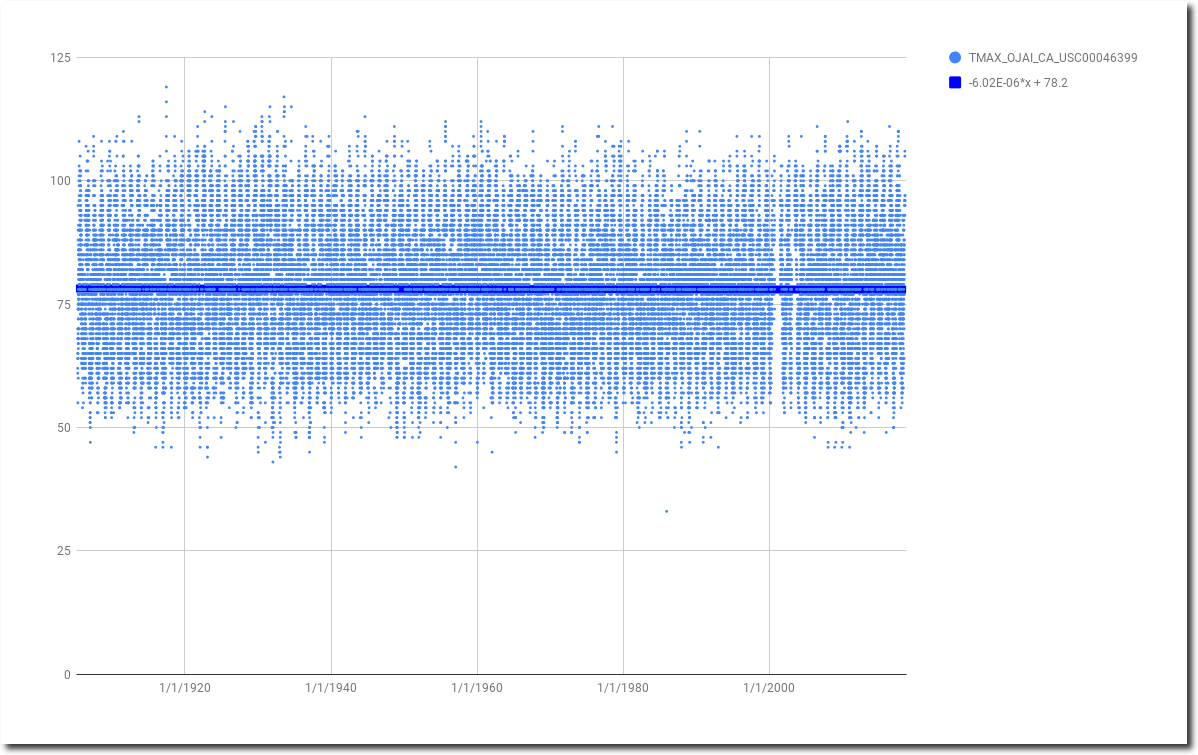
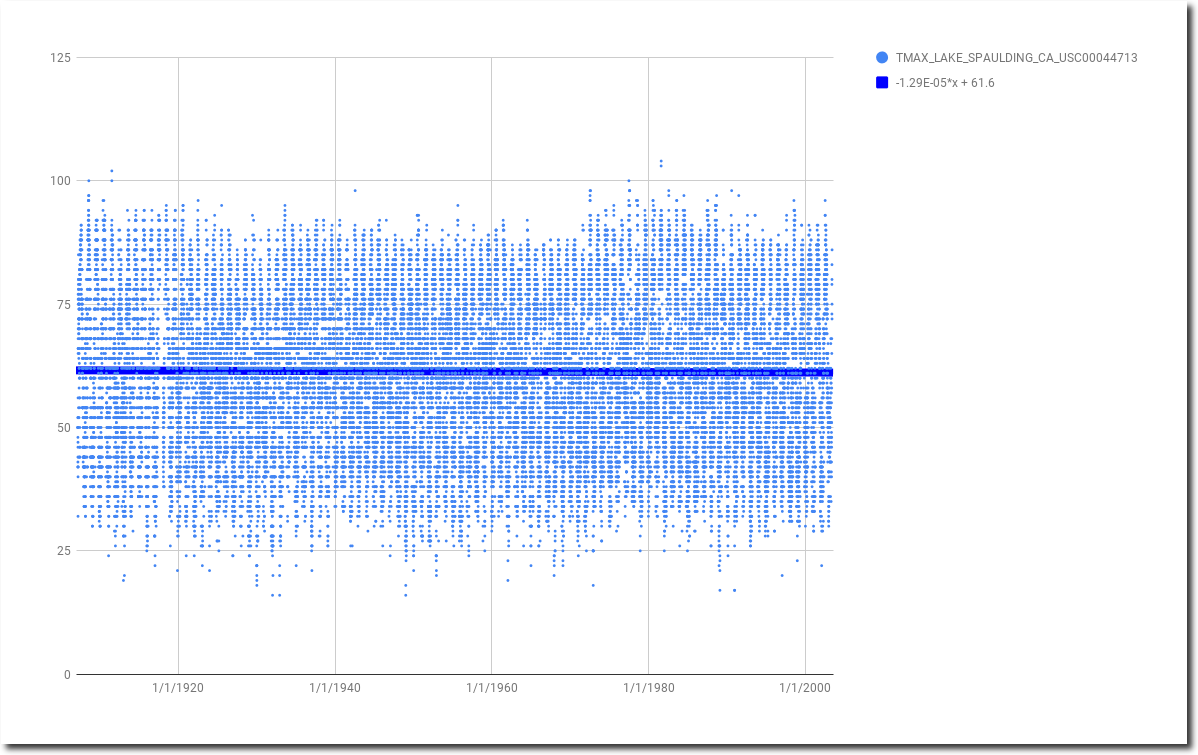
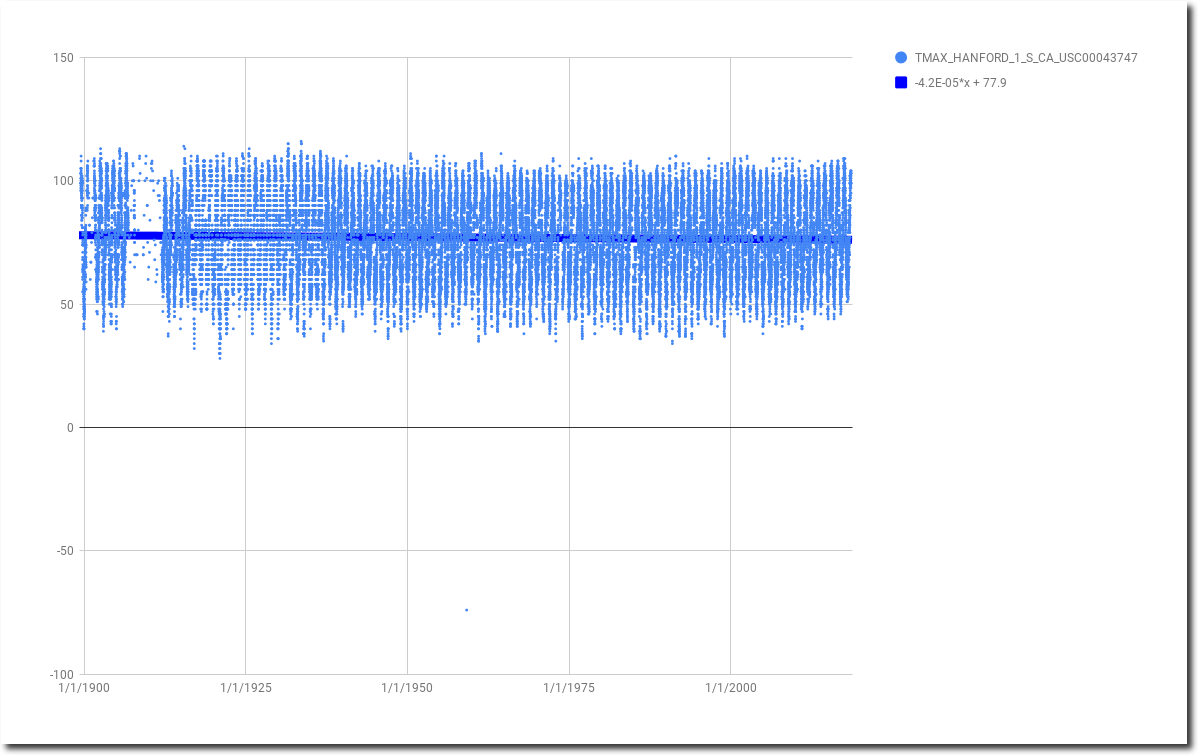
I no longer see any reason to believe California is warming.

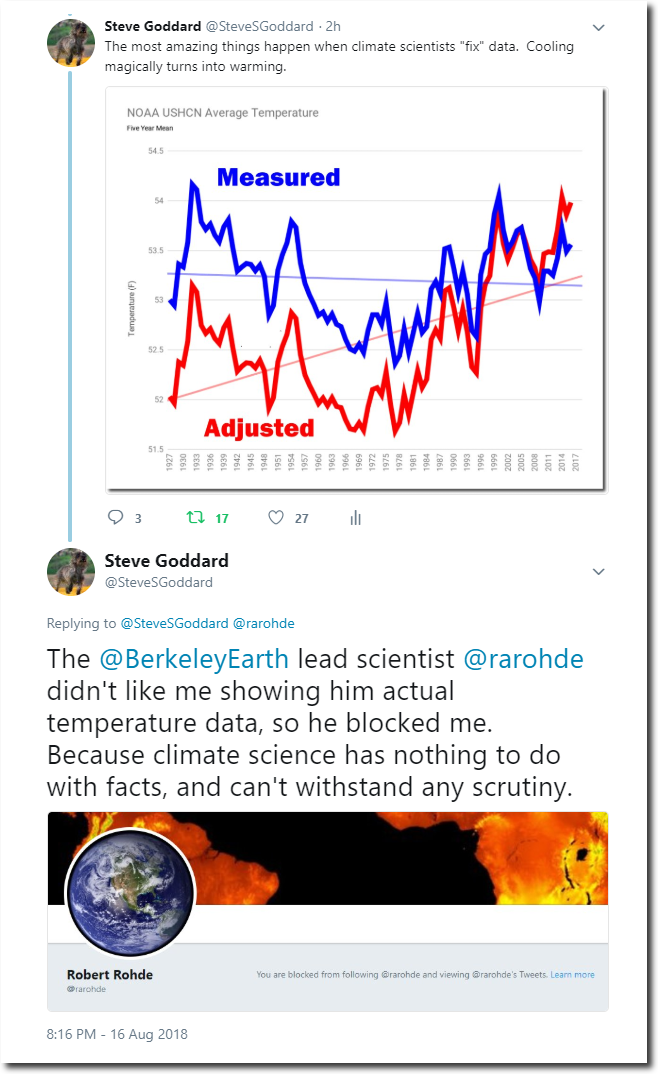
The Berkeley Earth lead “scientist” didn’t like me using actual data, so he blocked me.
Democrats are terrified by tiny CO2 molecules, straws, free speech, guns, the US Constitution, cows, Russians, and almost everything else.

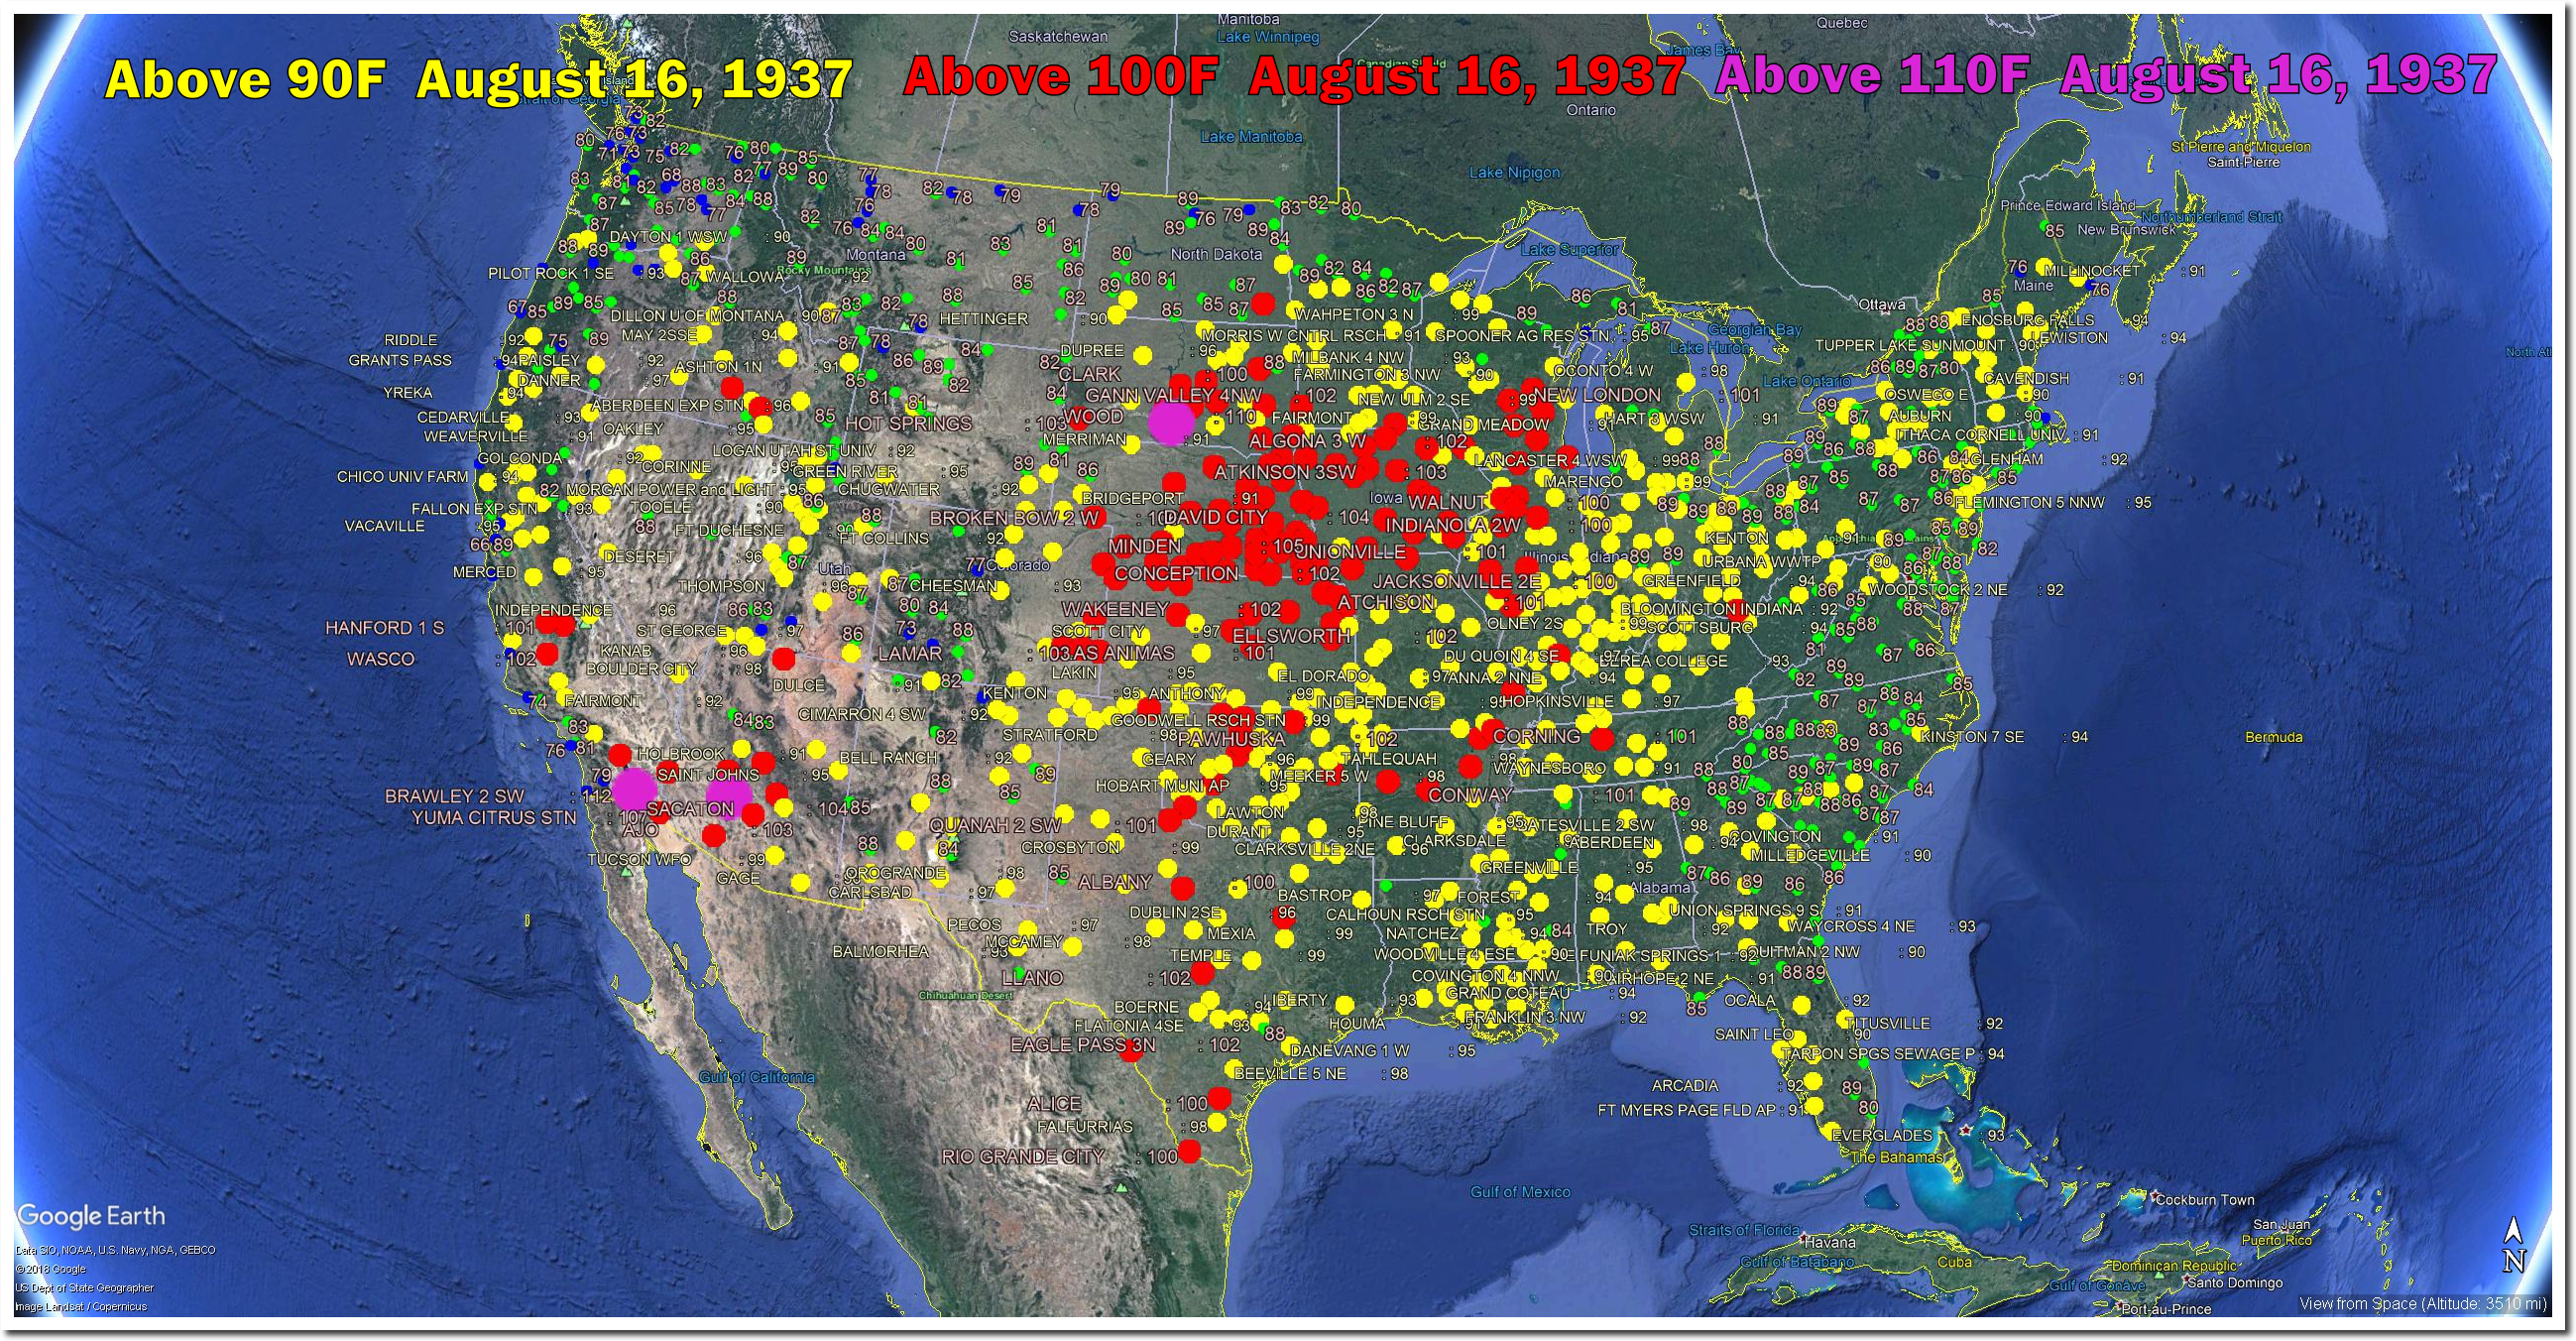
On this date in 1936, the average maximum temperature in the US was 93 degrees, and two thirds of the US was over 90 degrees. Missouri, Nebraska, Kansas and Oklahoma were all over 110 degrees.

August 16 afternoon temperatures have plummeted in the US over the past century.
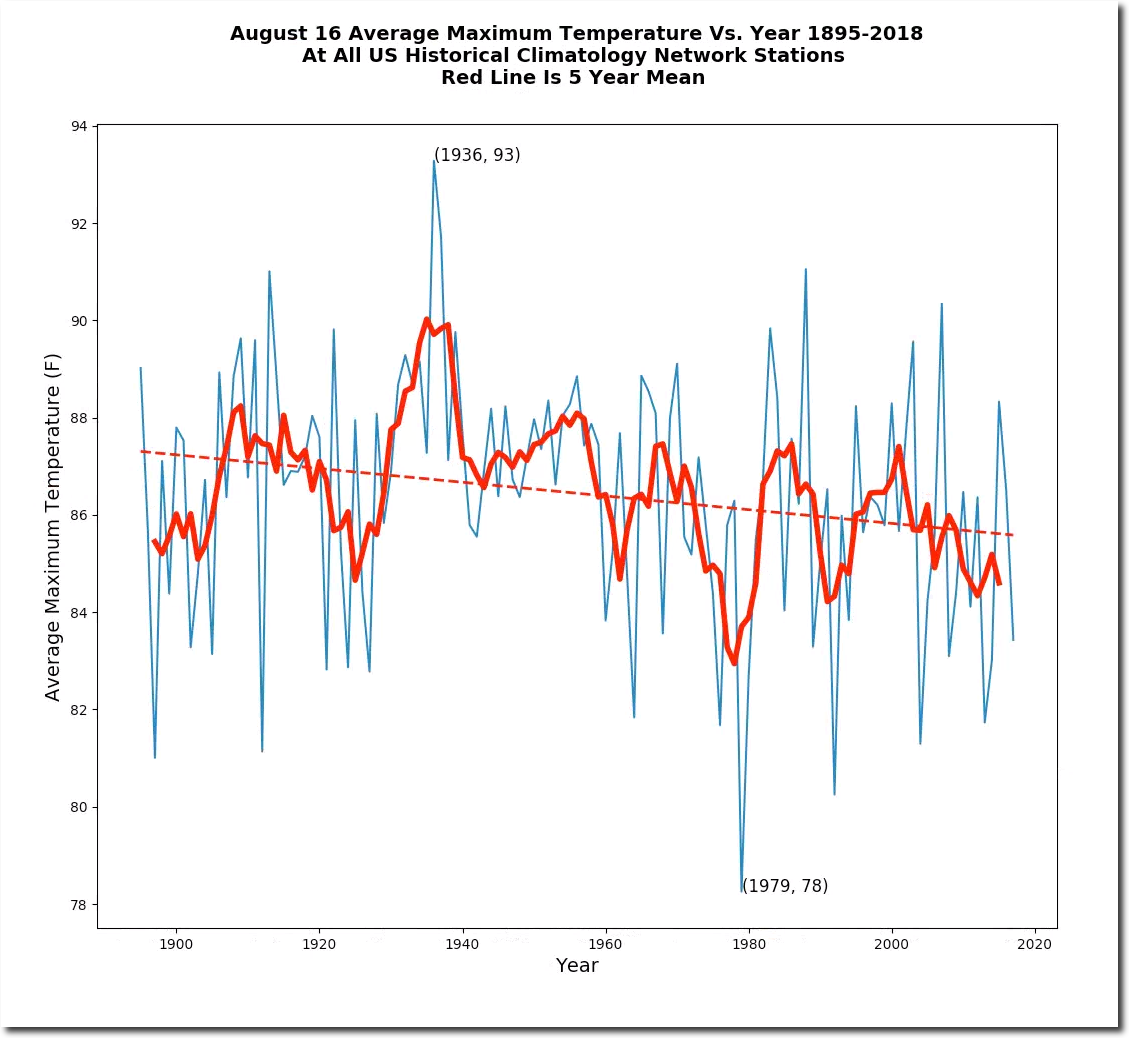
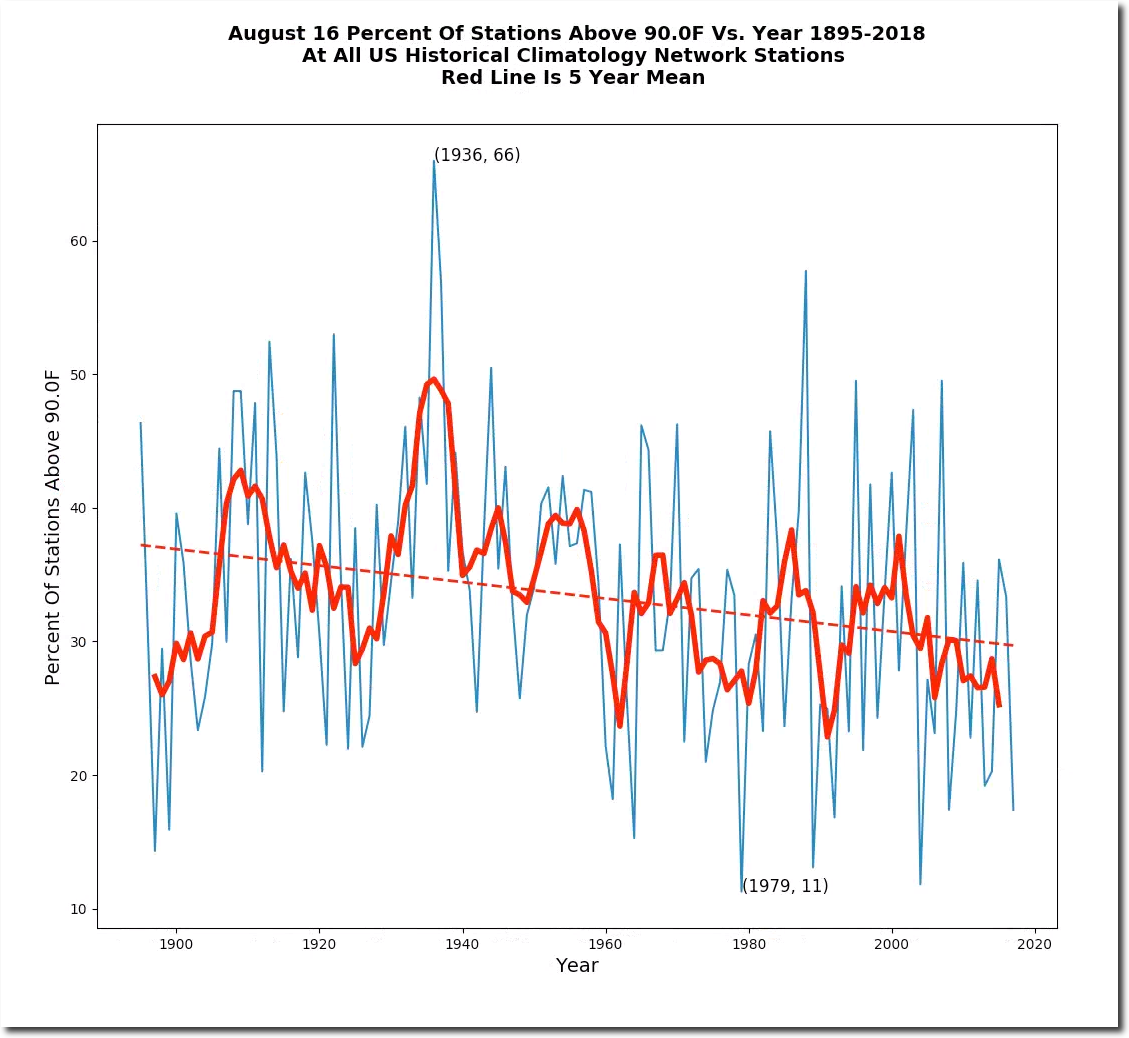
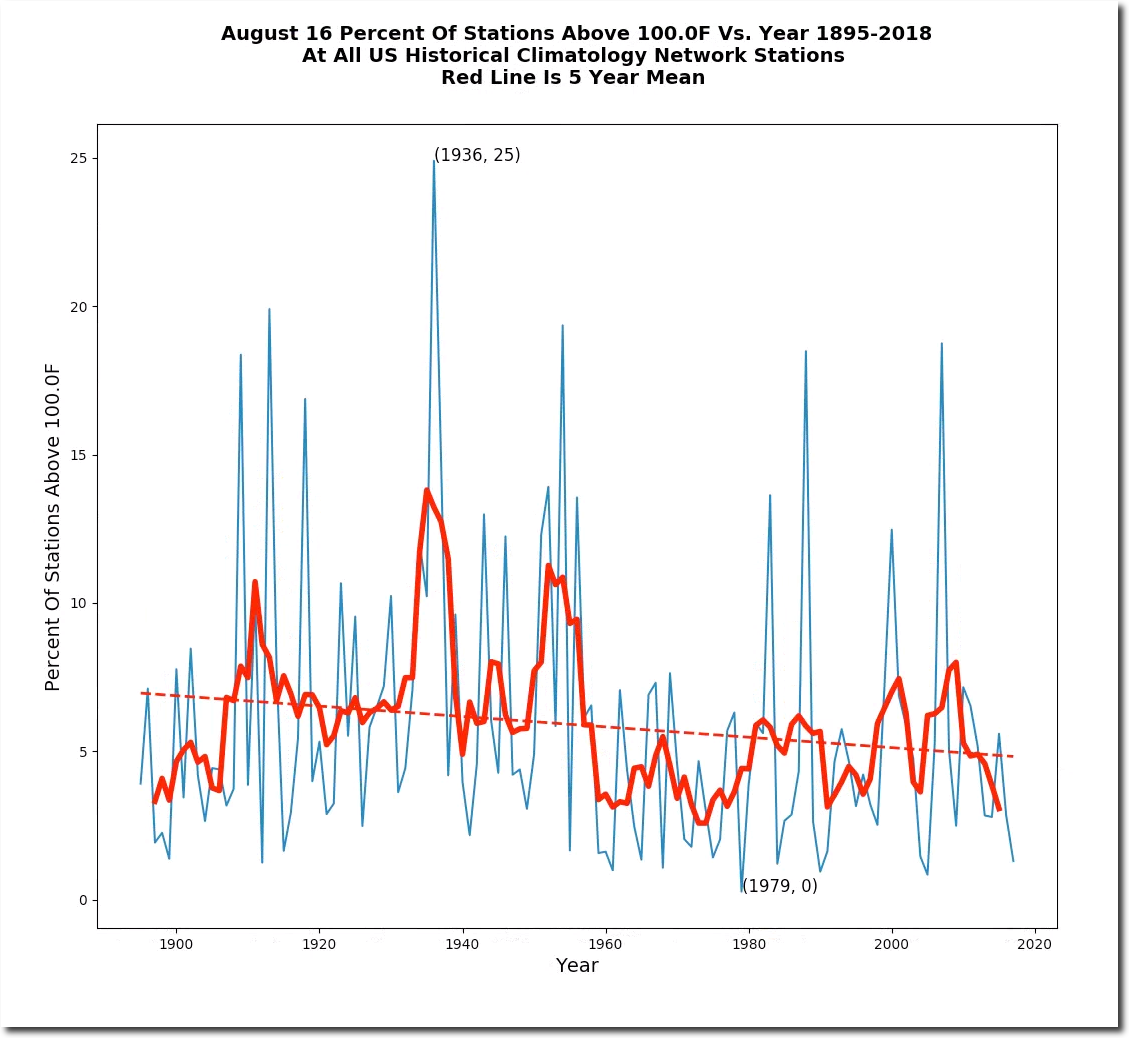
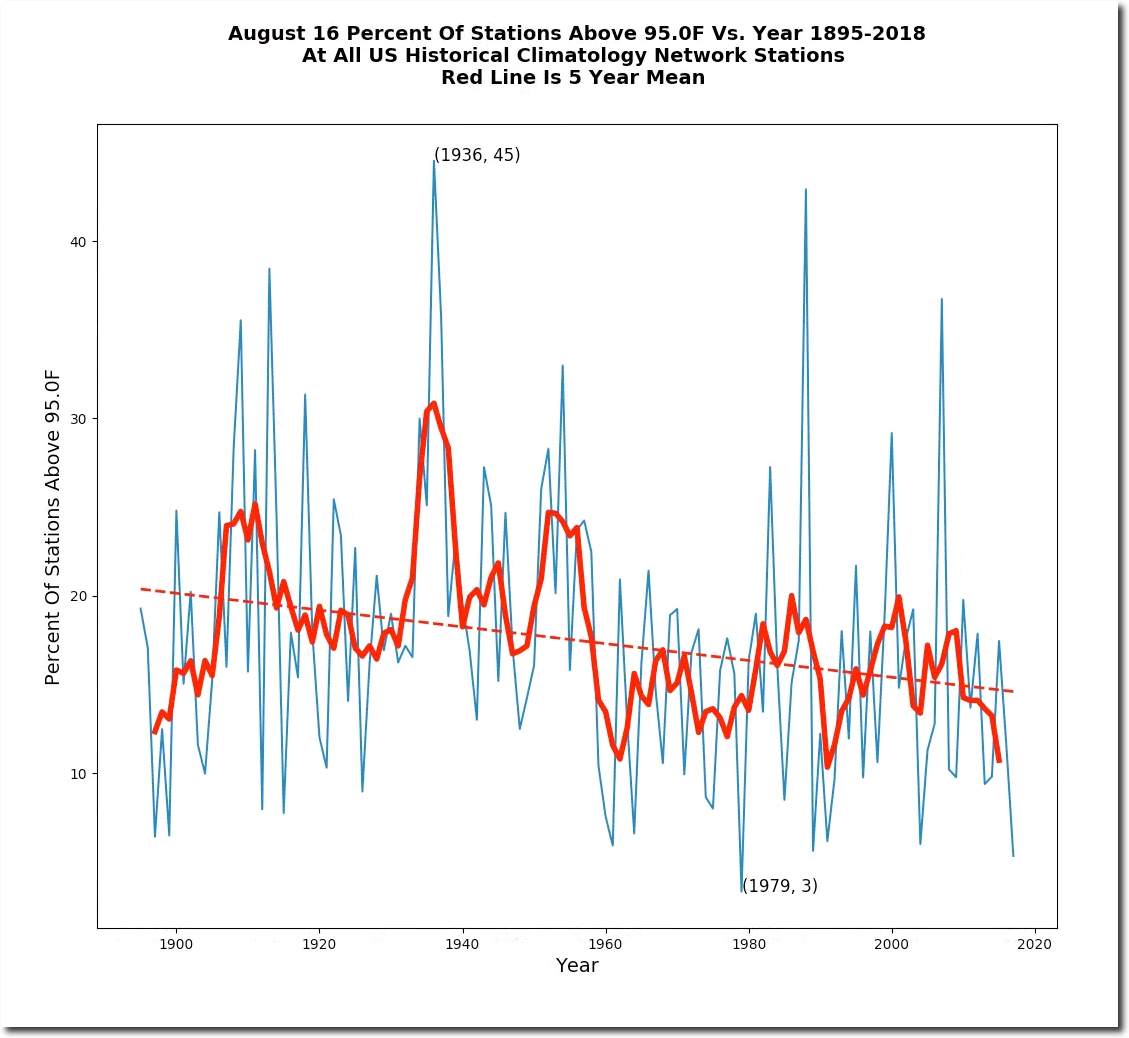
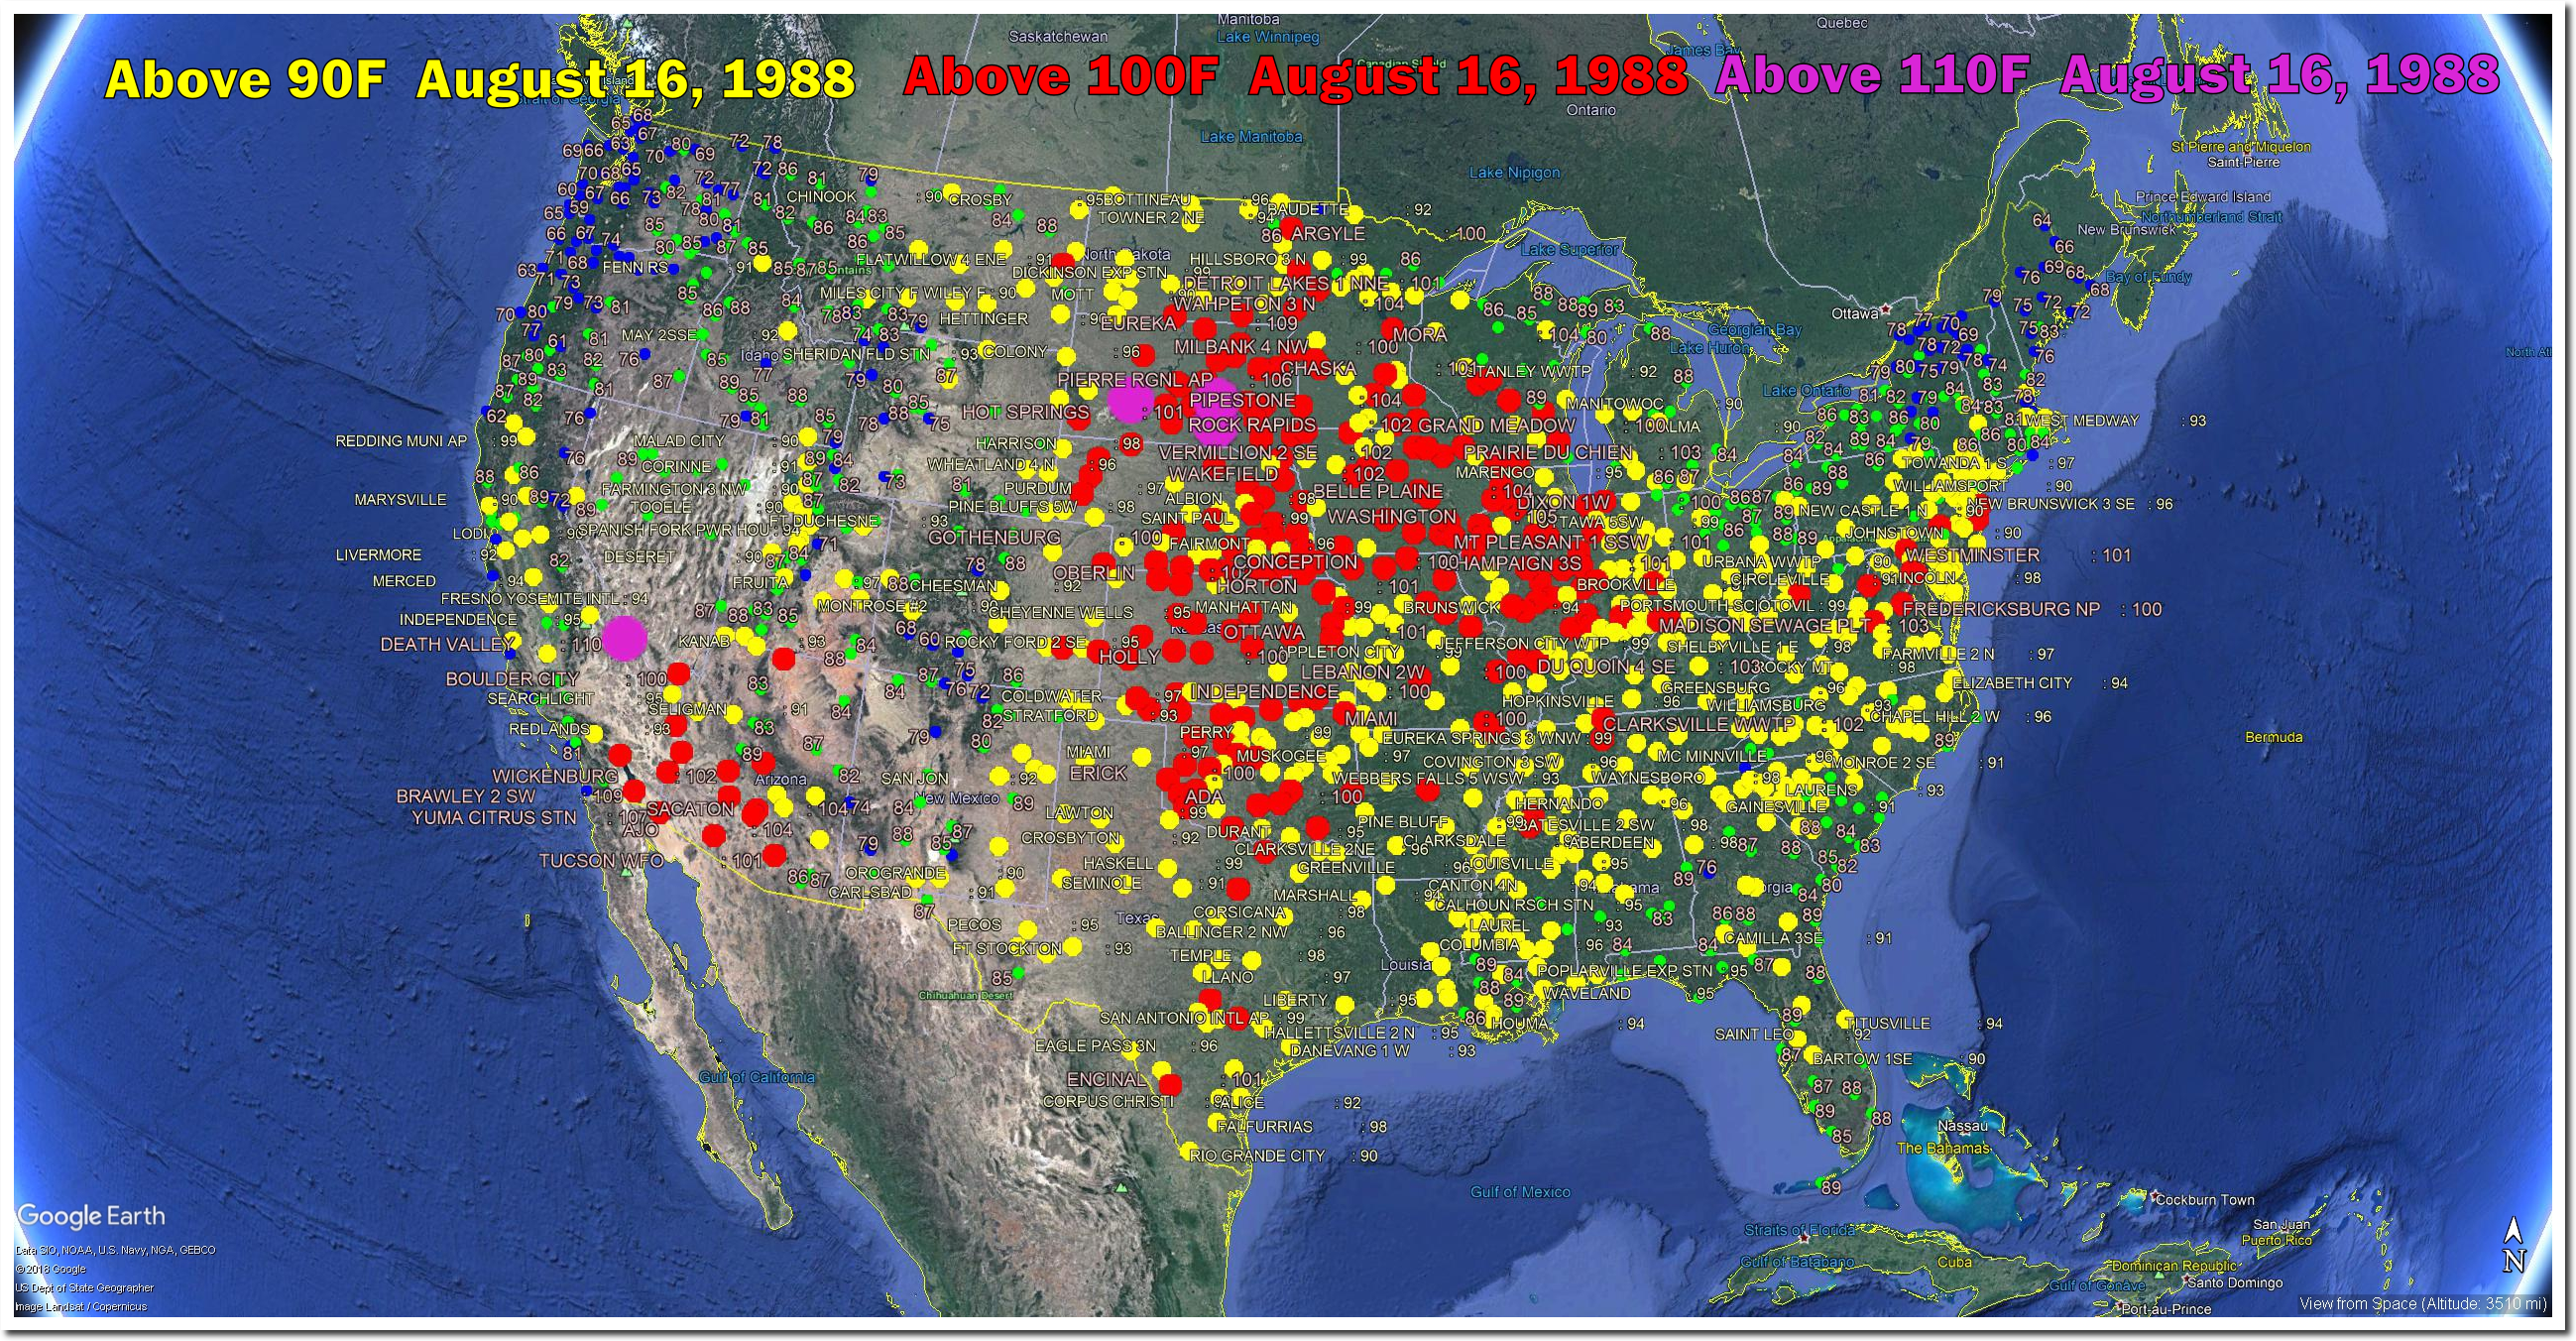
This date in 1937 and 1988 also brought tremendous heatwaves.
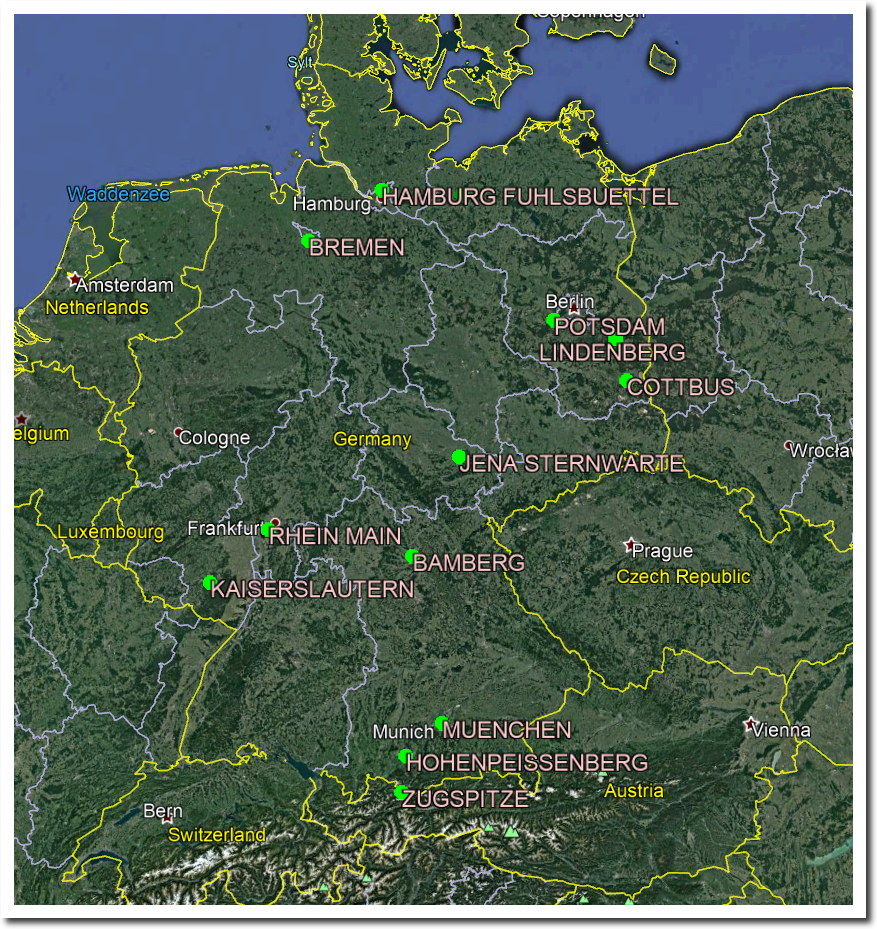
Germany is a little larger than Missouri and Arkansas combined, and has a fairly coherent long term temperature record at 13 stations.
There has been a warming trend in Germany since 1980.
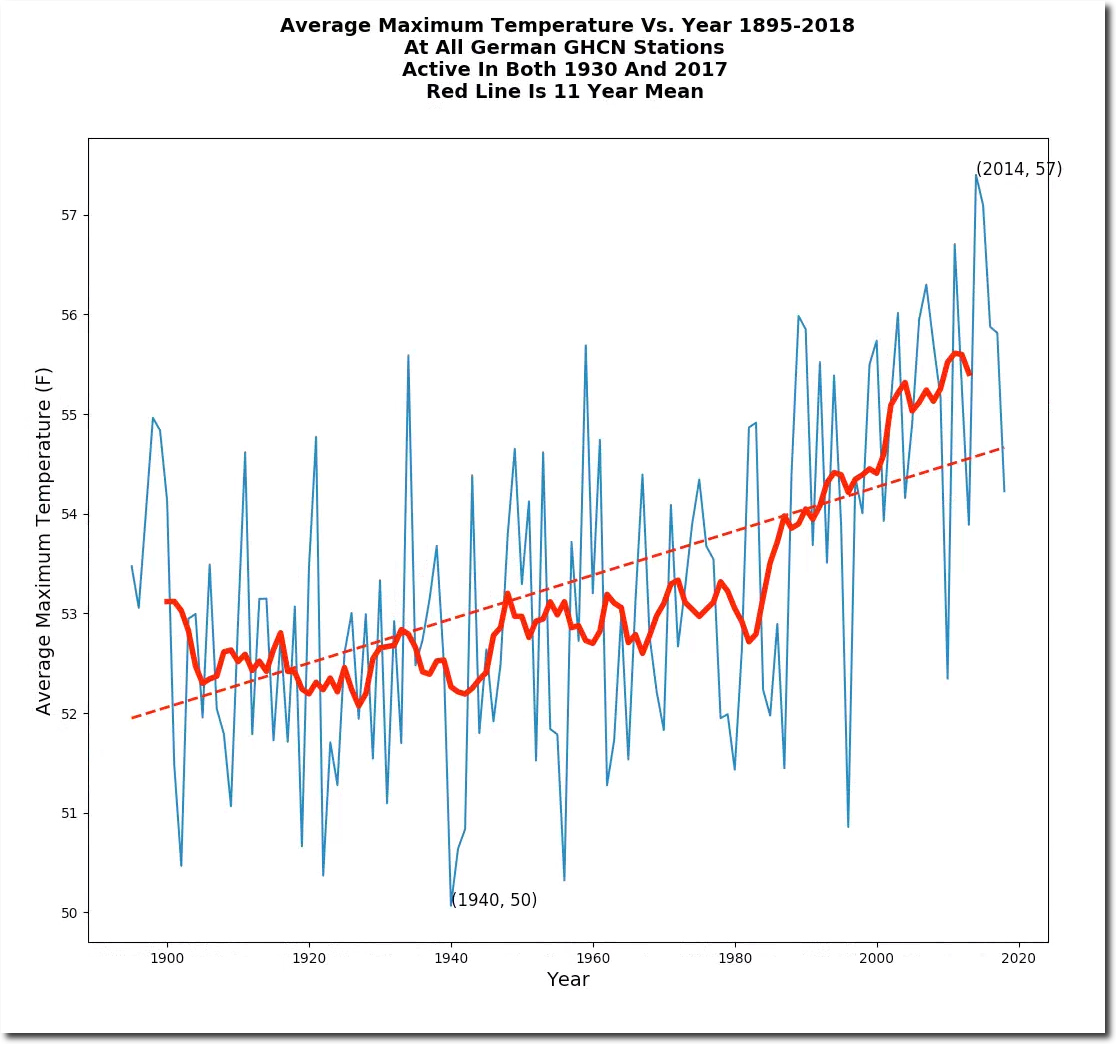
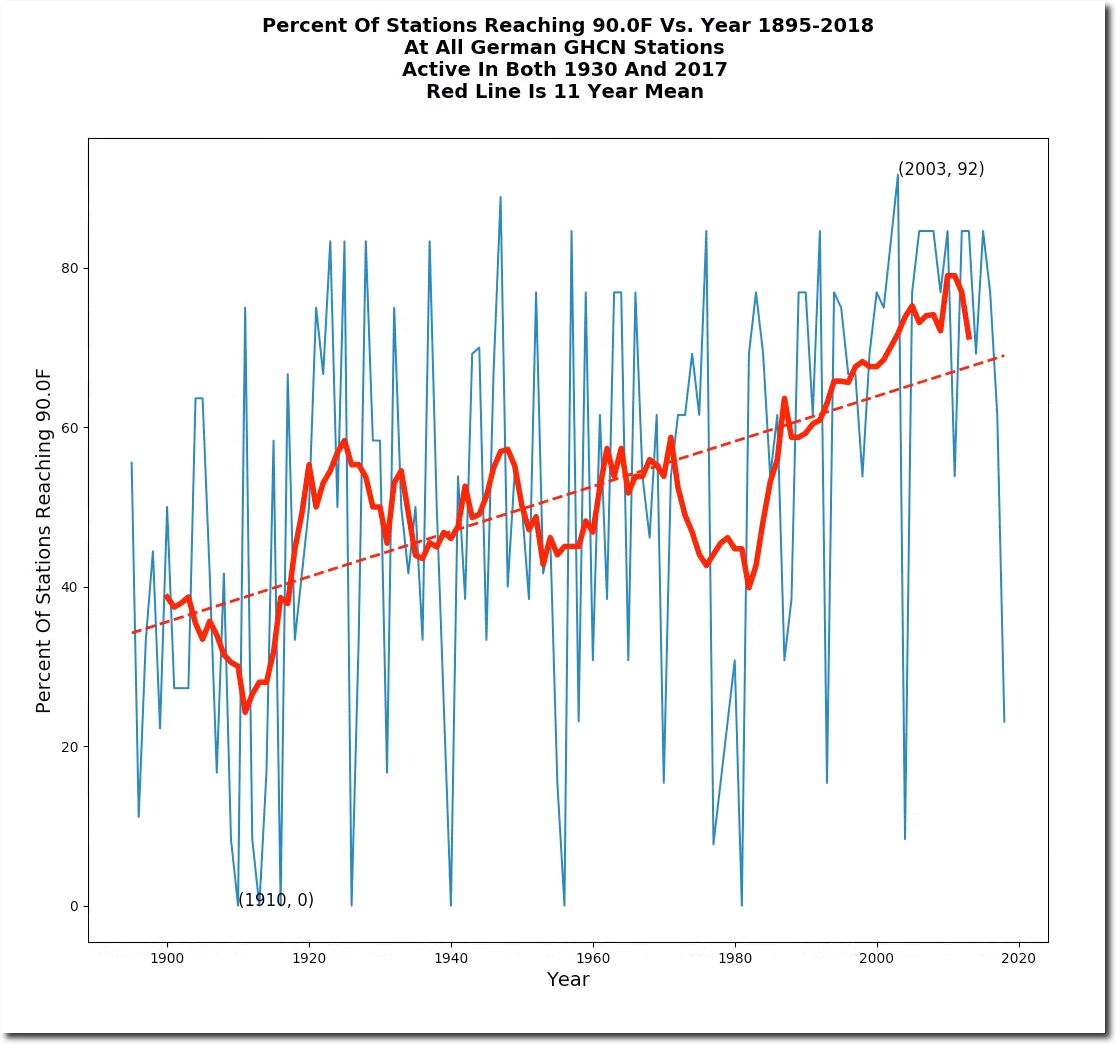
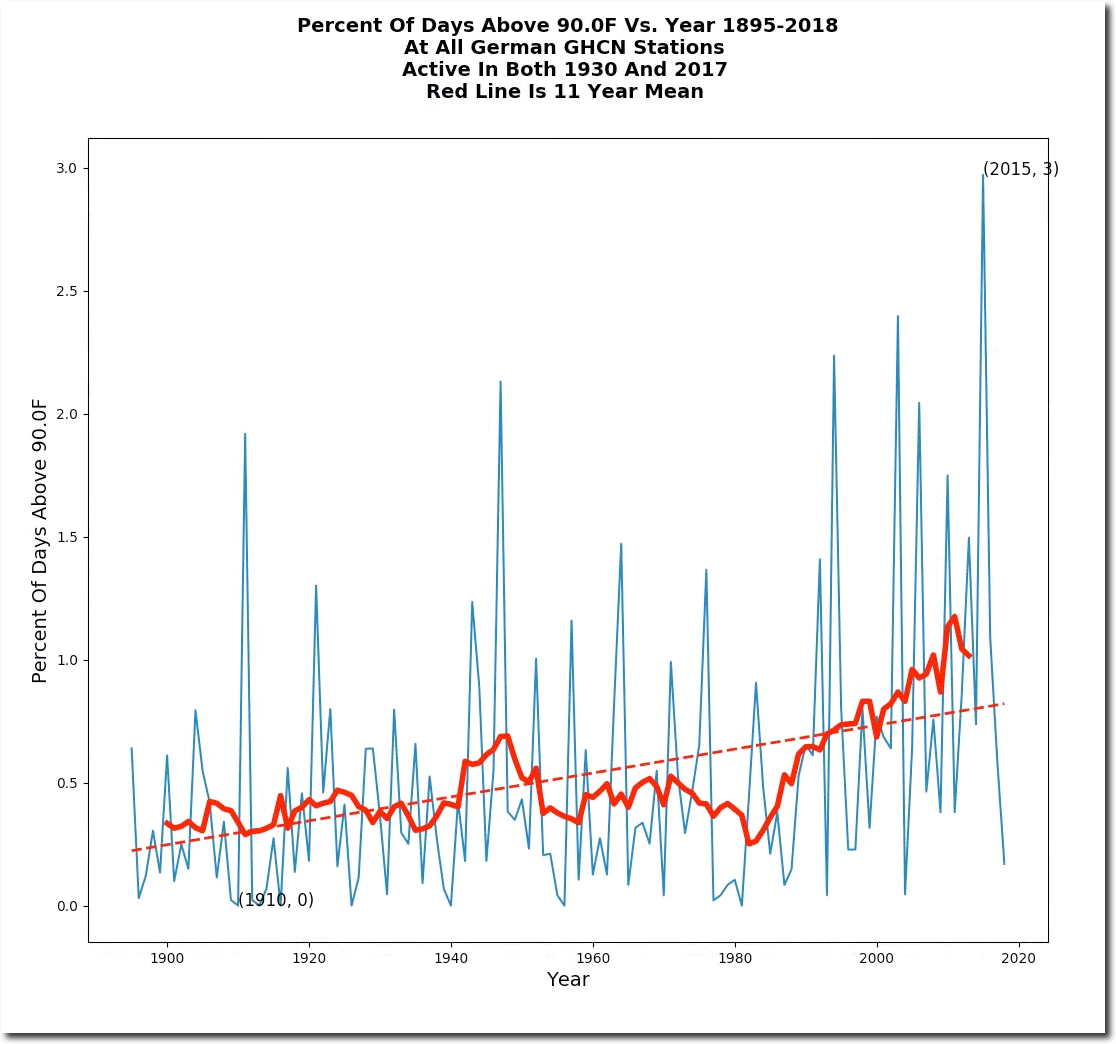
This can’t be explained by UHI, HOHENPEISSENBERG is a rural station at 3,100 feet elevation, and MUENCHEN is an urban station at 1,700 feet elevation.
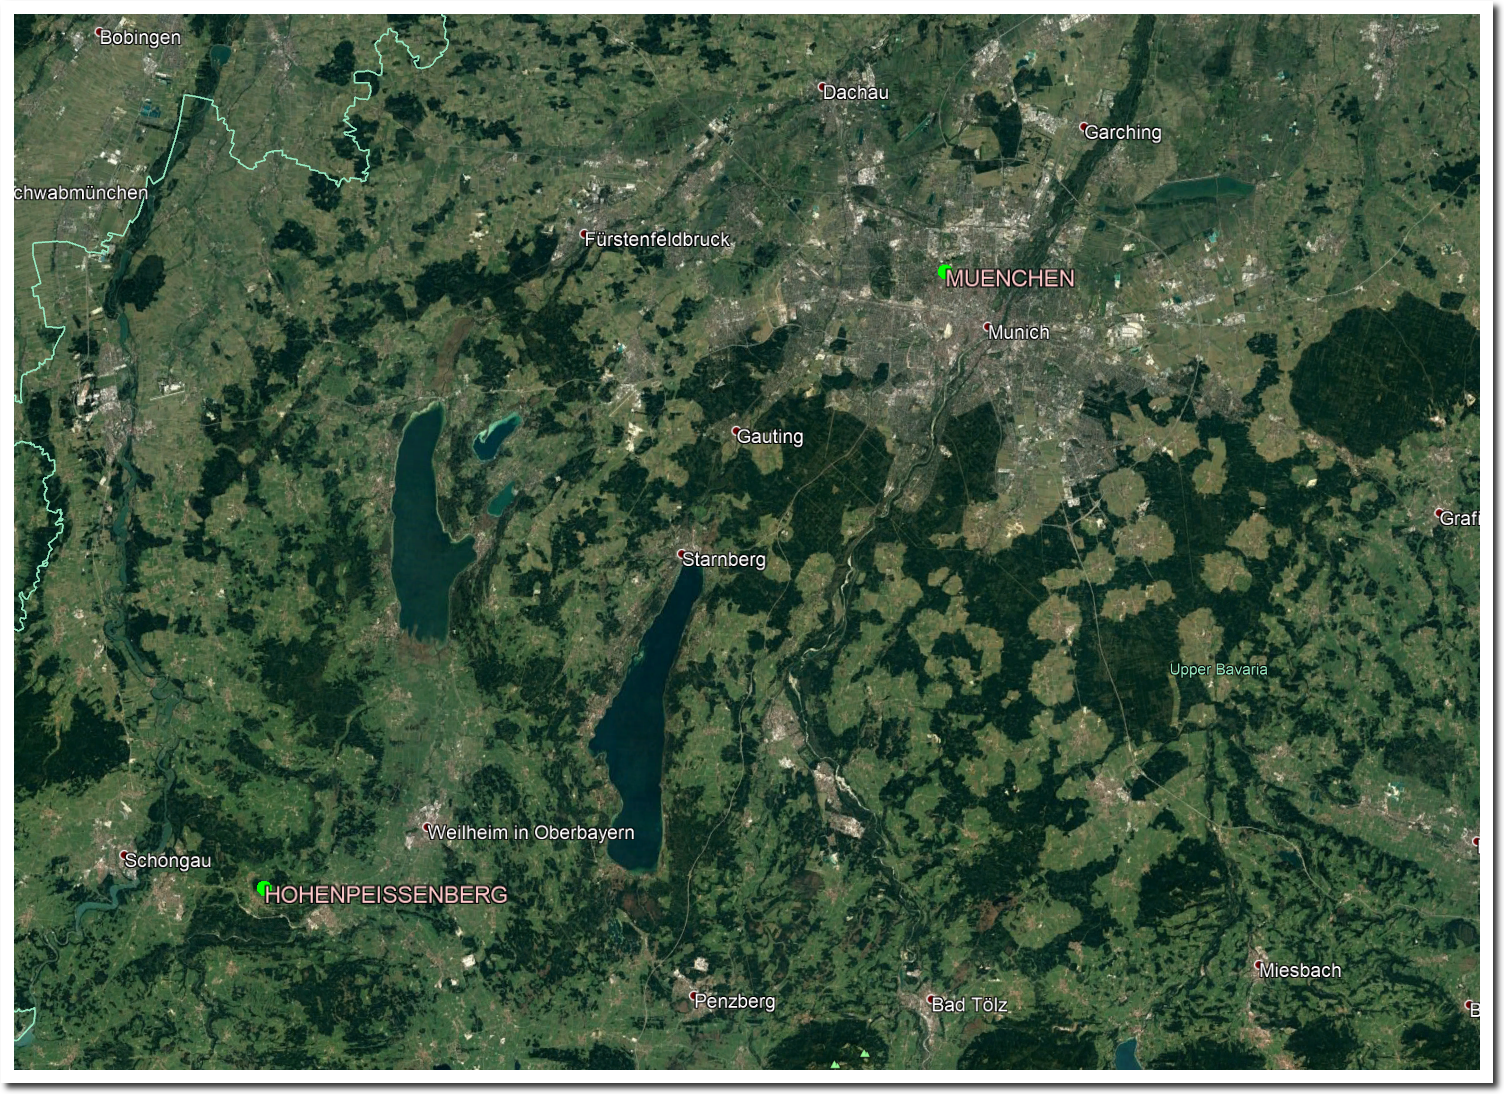
Munich is warmer, but the two stations track each other very closely.
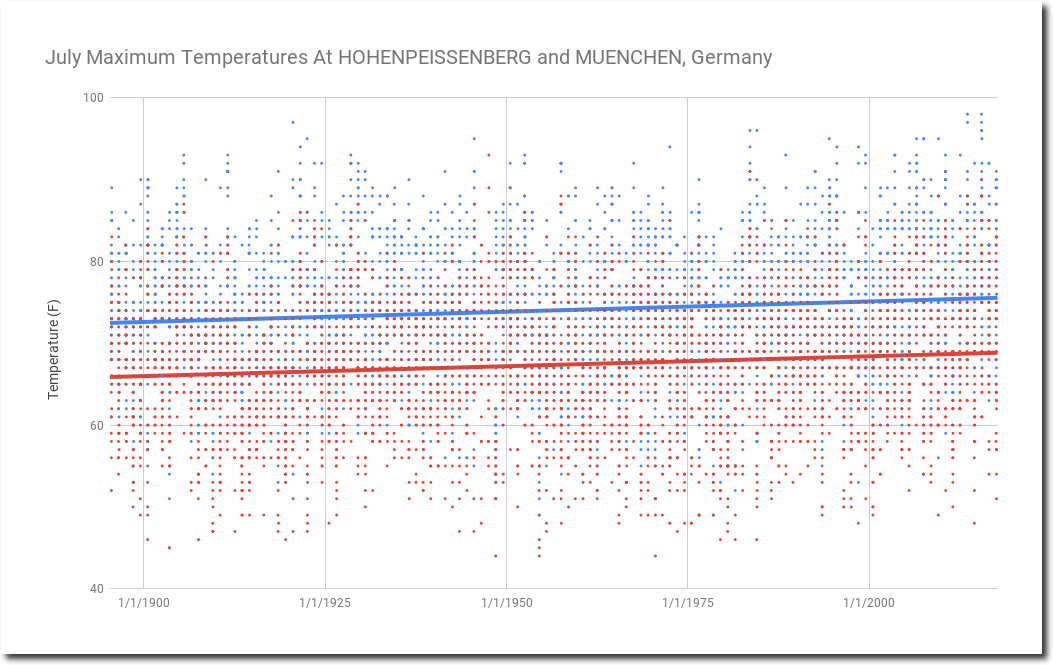
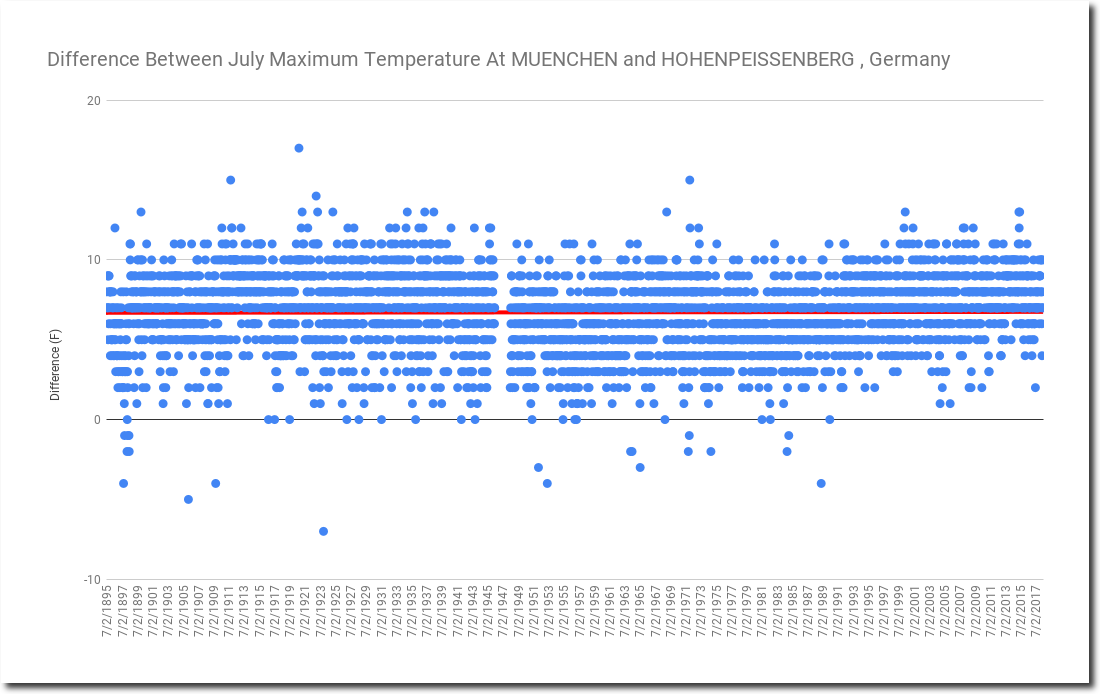
A typical July afternoon in overheated southern Germany is 71 degrees.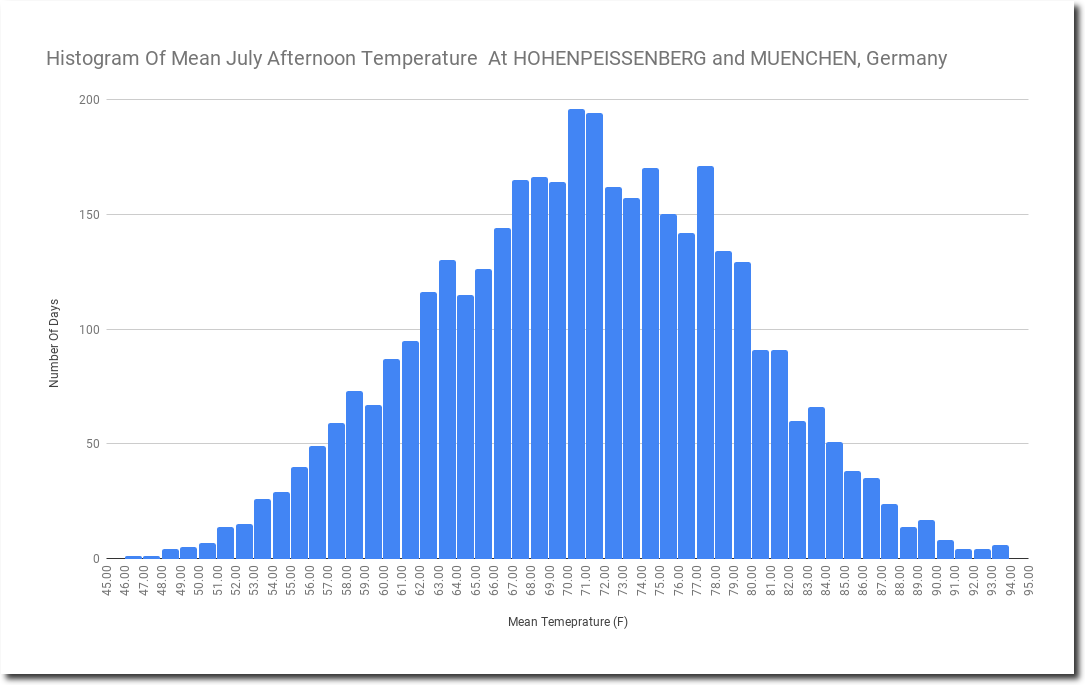
These two stations have warmed considerably since 1980, and I don’t see any reason to think the trend isn’t real.

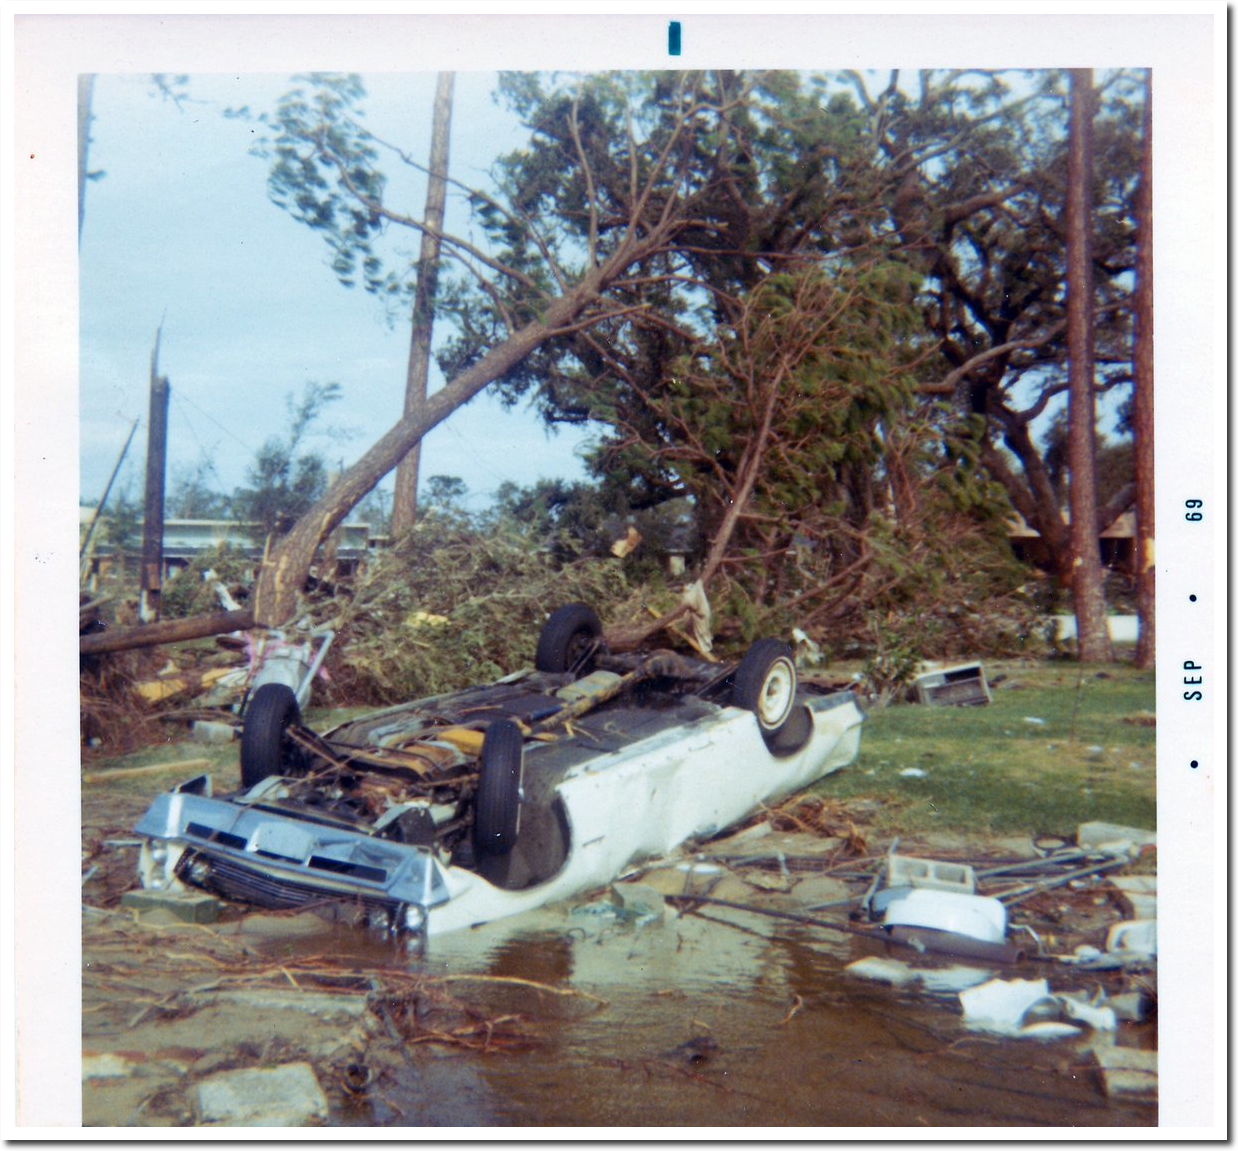
This week in 1969, Hurricane Camille hit the Gulf Coast with 200 MPH winds, about 3X the wind speed of Hurricane Sandy at landfall.
This was right at the beginning of the global cooling scare.
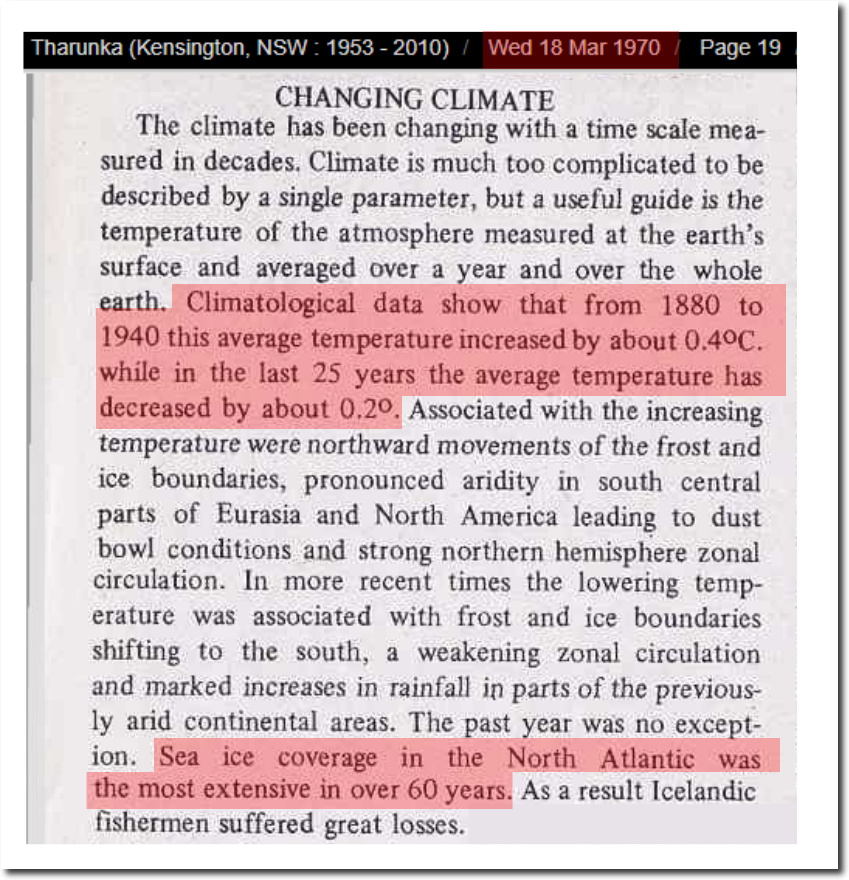
18 Mar 1970 – FURNACE OR ICE AGE? – Trove
MAMADOXIE on twitter sent these pictures over.