










Disrupting the Borg is expensive and time consuming!
Google Search
-
Recent Posts
- On The Road Again
- Vandalism At The Reflecting Pool
- Fifty Years Ago Today
- Truth Or Consequences
- US Climate Trend Maps
- Declining Spring Snow Cover In Northern New Mexico
- You Can’t Fool Mother Nature
- Cattle And The Climate
- One Atomic Bomb Per Hour
- New Video : Analyzing Oil And Gas
- Is Antarctica Melting?
- High Speed Analysis And Visualization
- El Nino To The Rescue?
- Fake News Update
- Growth Of Antarctic Sea Ice
- 65 Years Of Progress!
- El Nino To The Rescue?
- Worst March Drought On Record
- ChartGL Process Control Demo
- The Biggest Money Laundering Scam
- Drought In The Headwaters Of Lake Powell
- Unrealistic Expectations Of Water Availability
- Did Bill Gates Do This?
- Worst March Drought On Record In The US
- The Real Hockey Stick Graph
Recent Comments
- Bob G on On The Road Again
- Gordon Vigurs on On The Road Again
- Bob G on On The Road Again
- Gordon Vigurs on On The Road Again
- Bob G on On The Road Again
- Bob G on Vandalism At The Reflecting Pool
More New Mexicans
Posted in Uncategorized
Leave a comment
More Spectacular Climate Nonsense From The Capital Weather Gang
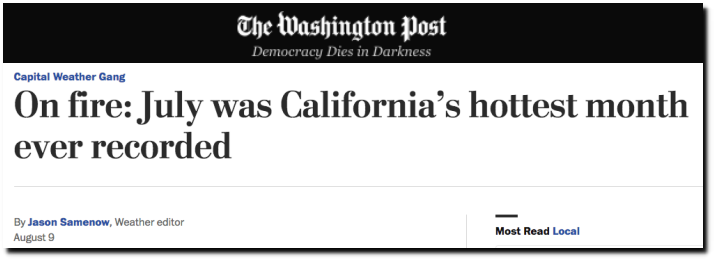
The Washington Post Capital Weather Gang are constantly working to outdo themselves in the fake news climate hysteria department. Their latest claim is that July was California’s hottest month ever recorded.
On fire: July was California’s hottest month ever recorded – The Washington Post
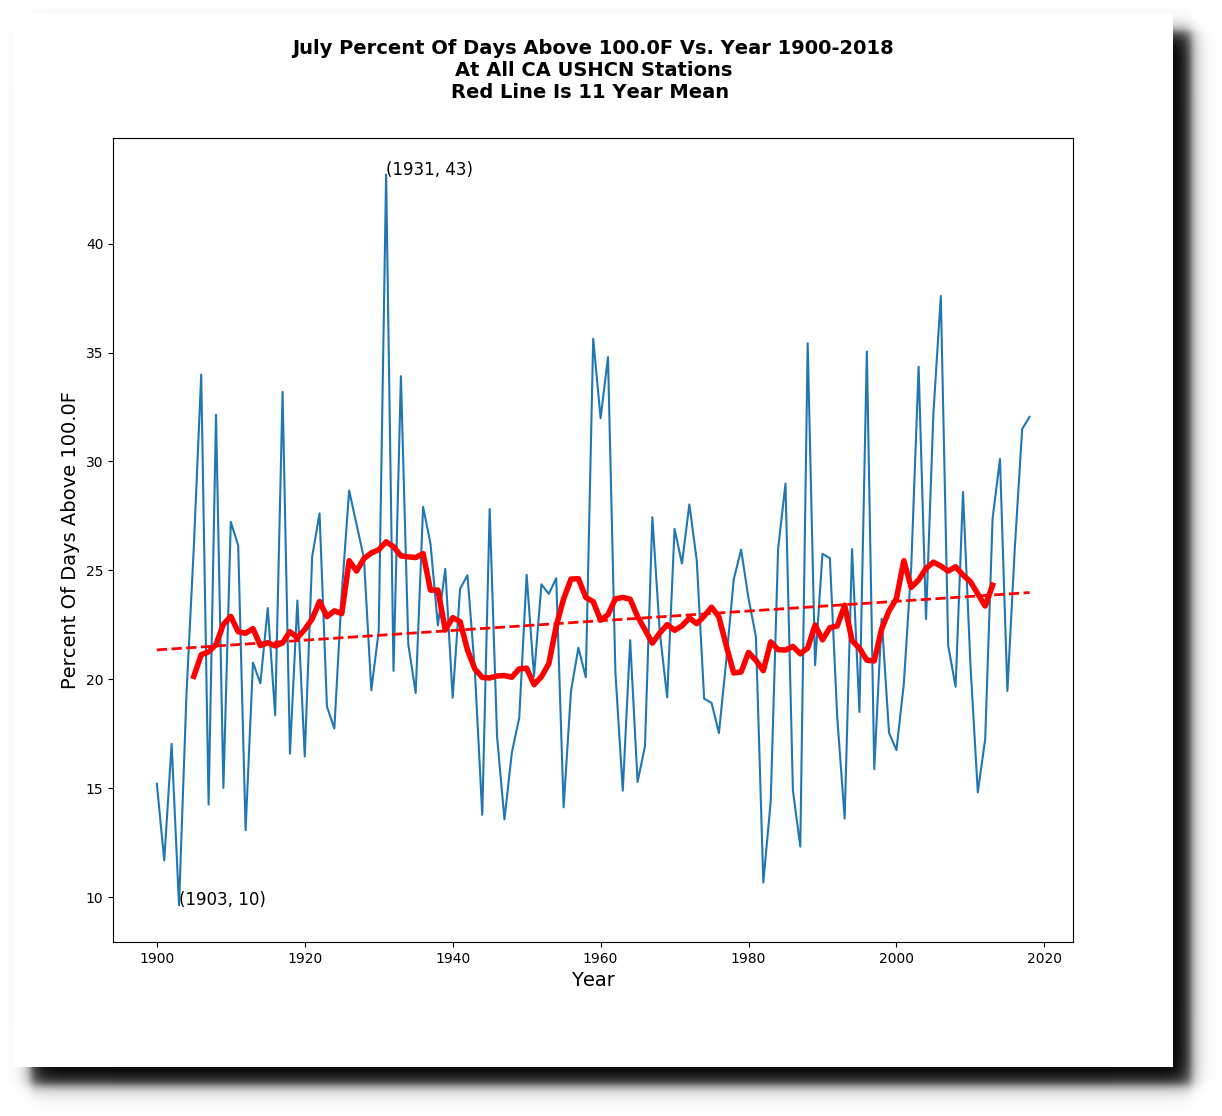
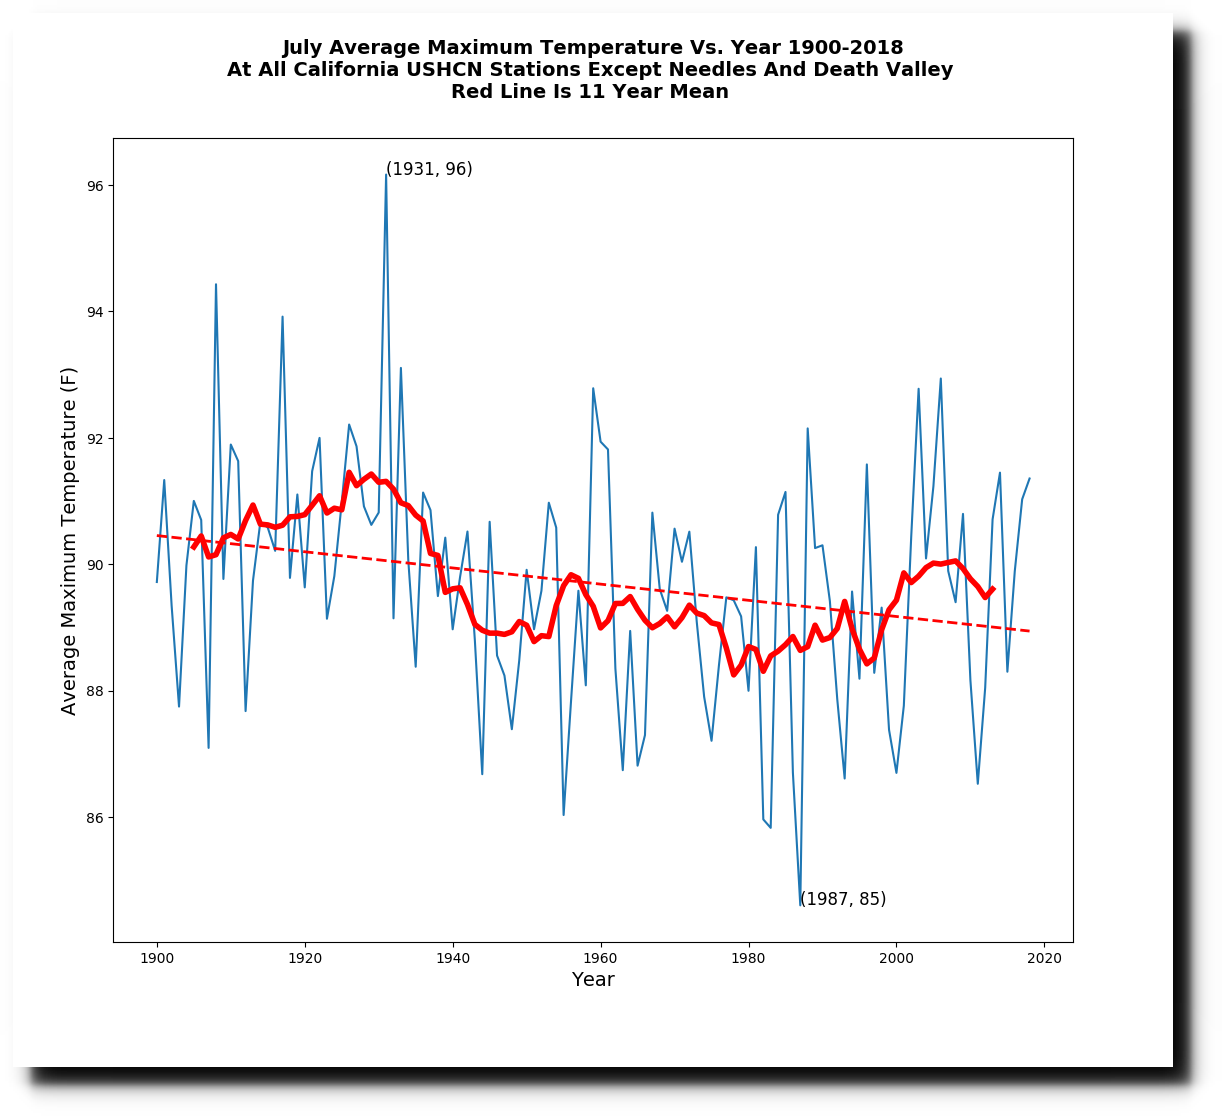
Average maximum temperatures in California this July weren’t in the top ten, and were four degrees cooler than 1931.
The frequency of hot days wasn’t in the top ten either.
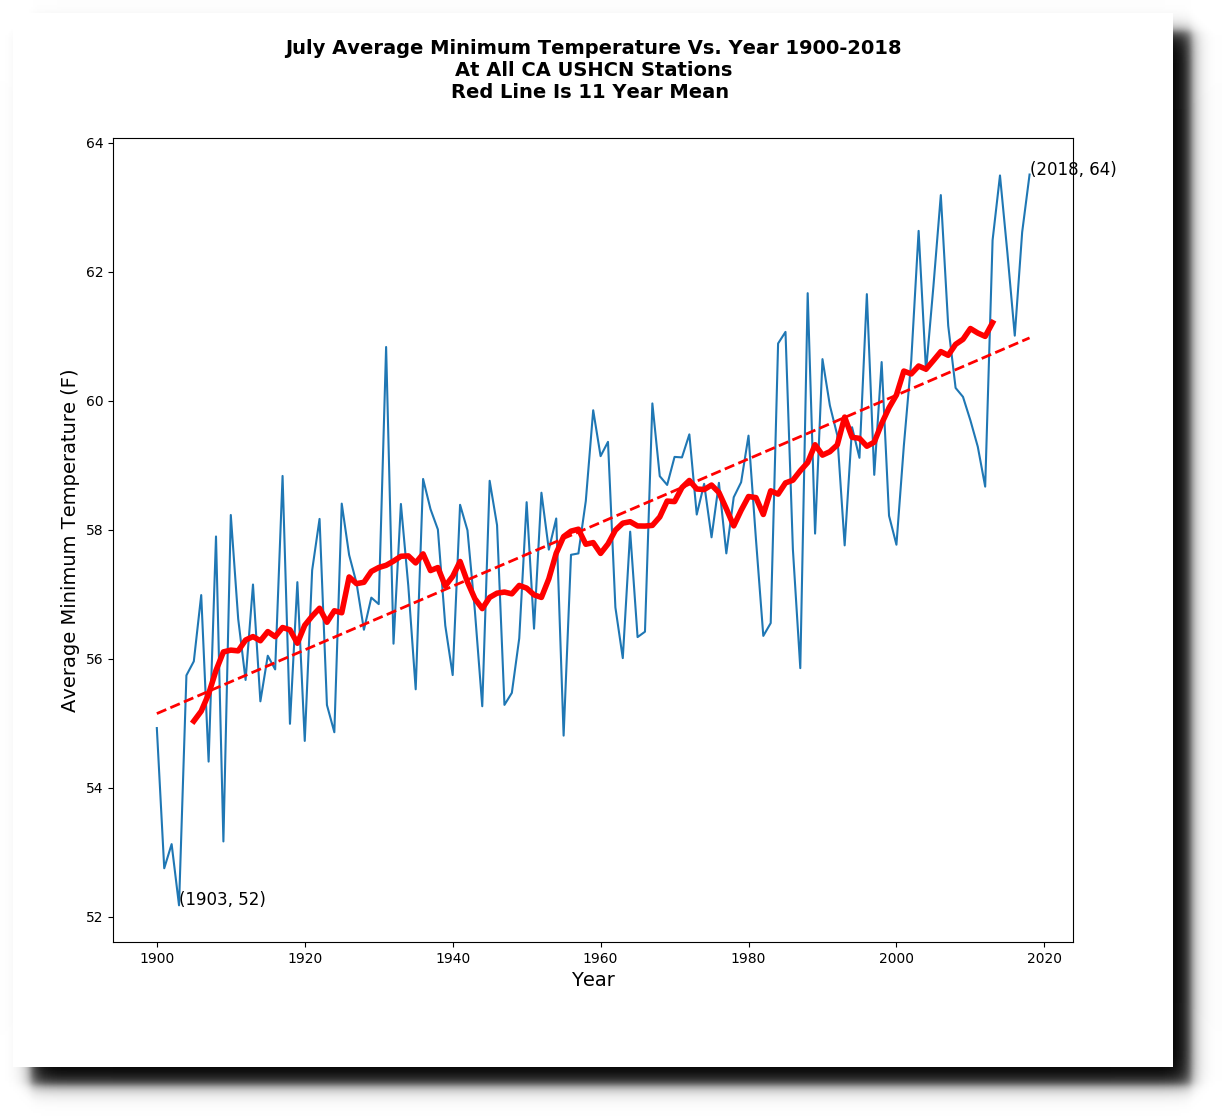
Minimum temperatures were the least cold, but most people don’t consider 64 degrees to be “hot.” However, the warmth in minimum temperatures is most likely due to urban heat island effects around the thermometers, rather than climate.
But the junk science is worse than it seems. California’s two hottest stations do not have any data prior to 1940 in the GHCN database, so they need to be removed to do a fair comparison vs. 1931. When Needles and Death Valley are removed, California July temperatures are dropping sharply and this year was not much above average. July 2018 was five degrees cooler than 1931.

This sort of nonsense is standard practice for the Capital Weather Gang, who claimed the Arctic was “super hot” on a day when temperatures made it up to 0C for a few hours in a small region near the North Pole.
Posted in Uncategorized
Leave a comment
Death Valley To Reach The Boiling Point Next Spring
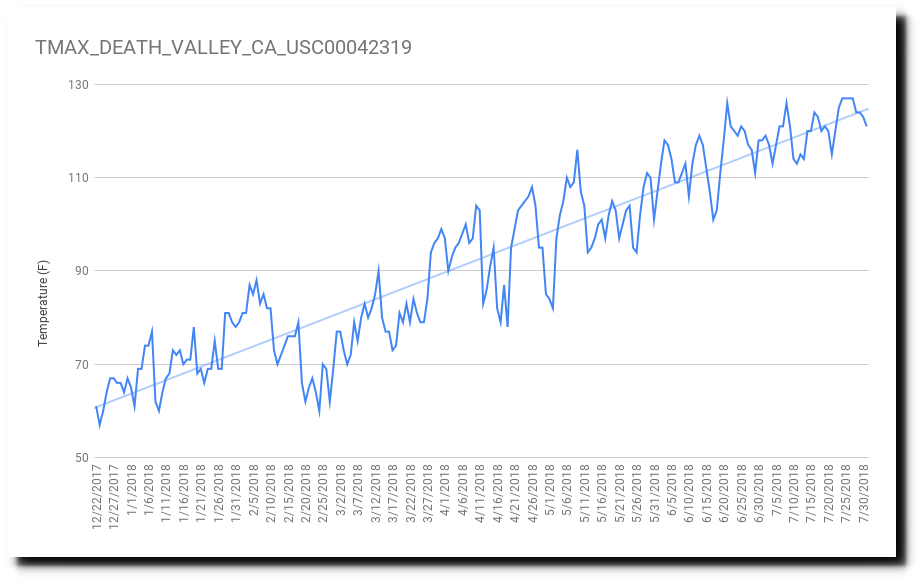
From December 22, 2017 to July 30, 2018, Death Valley, CA warmed at a rate of 102 degrees per year. Using the universally accepted climate science linear extrapolation, Death Valley should reach the boiling point of water* during late May of next year.
- Important disclaimer : Being below sea level, Death Valley water boils at a higher temperature than 100C. This pushes the boiling point date back a week or two.
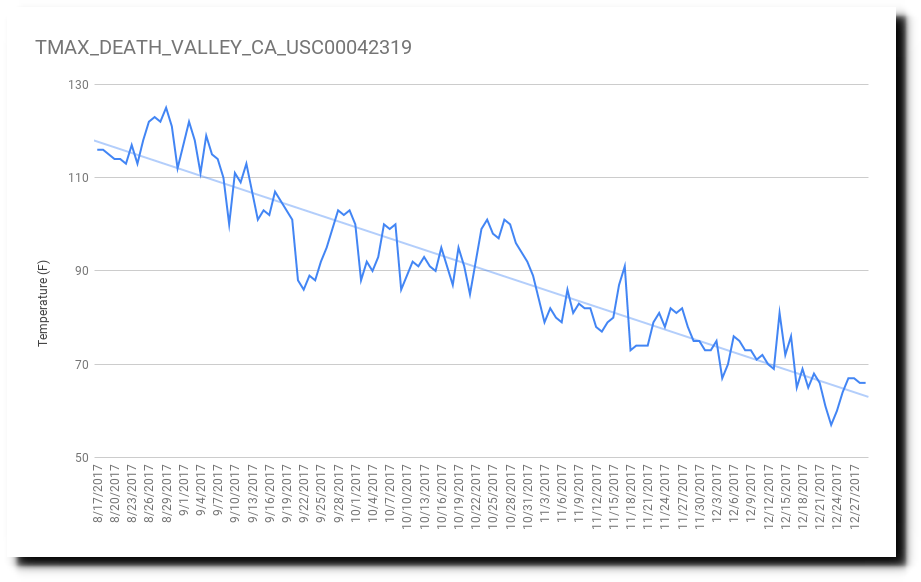
Having said that, it should also be noted that Death Valley cooled at a rate of 145 degrees per year from August 27 to December 30 last year. This is undoubtedly one of the many benefits of California carbon taxes.
Posted in Uncategorized
Leave a comment
In Climate Science, No Correlation Is Causation
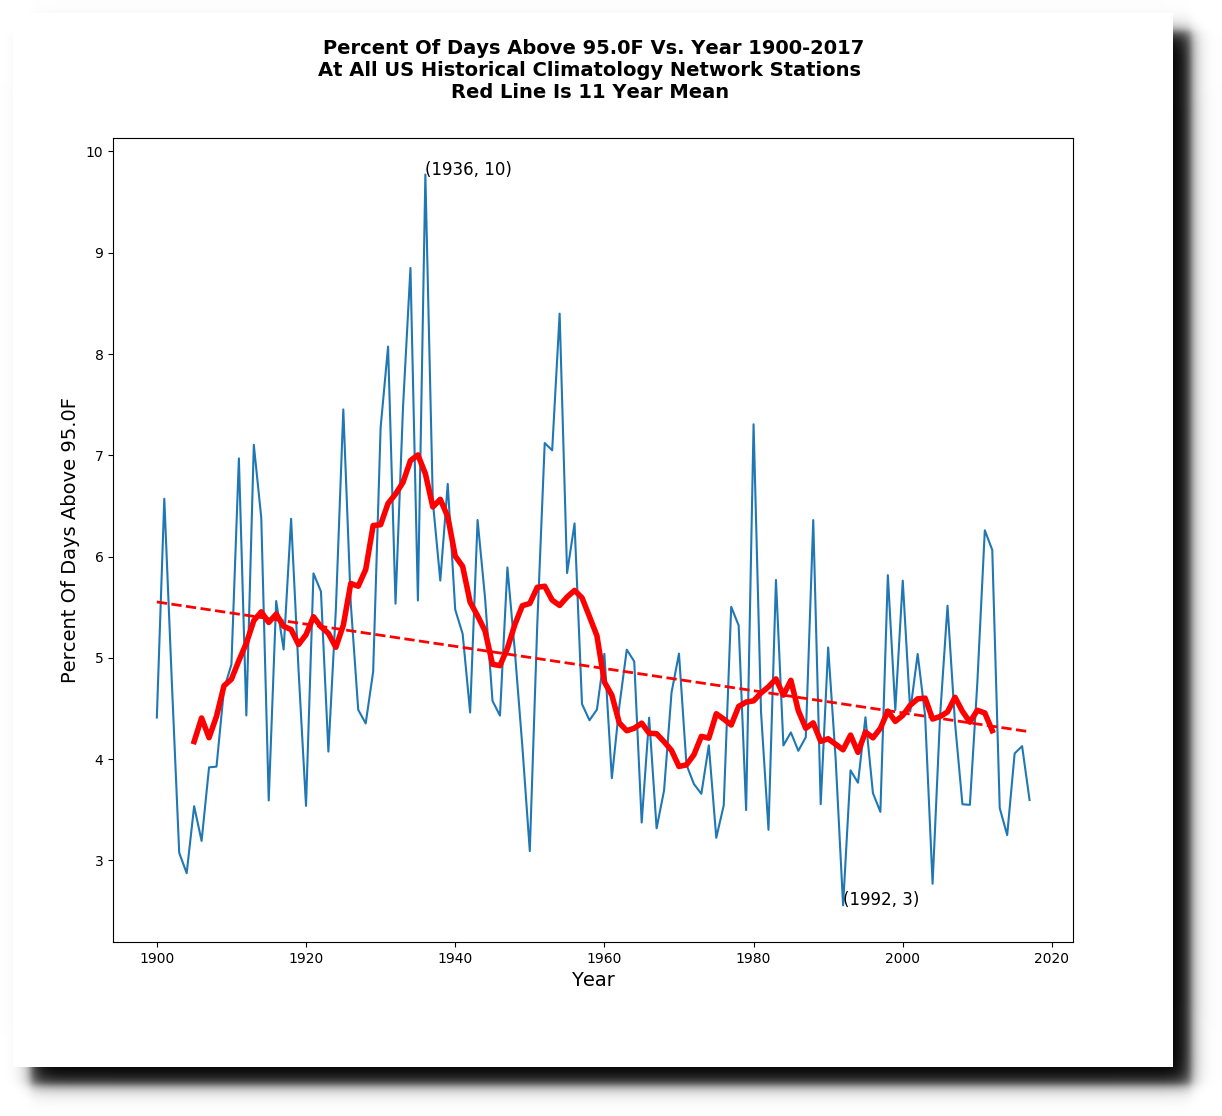
In the US, the frequency of 95F (35C) days has dropped sharply since the 1930’s.
There is some correlation between the frequency of 95 degree days, and the average annual maximum temperature.
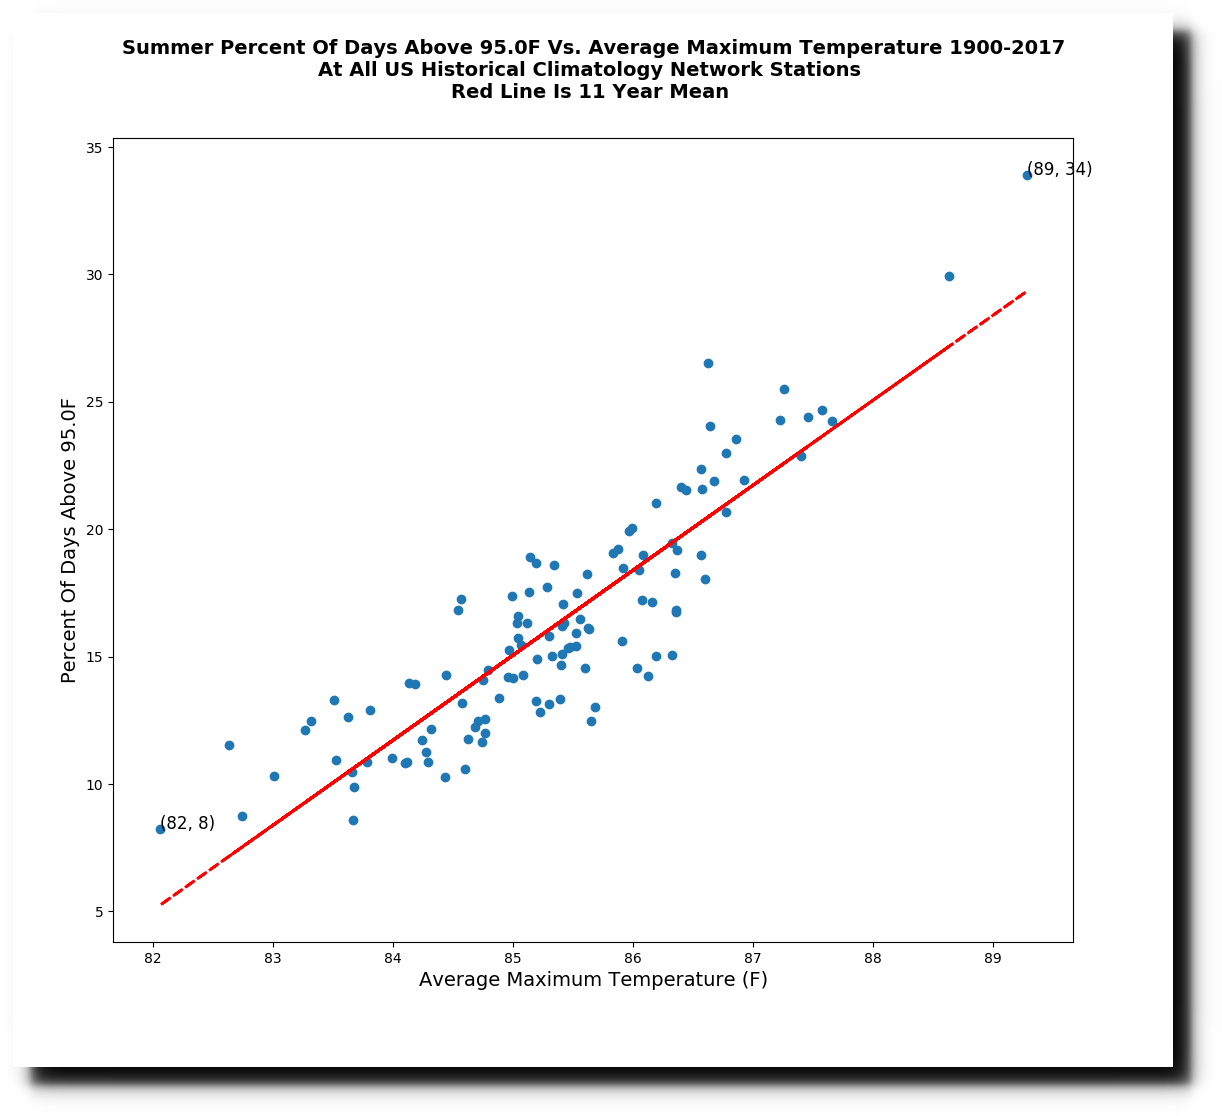
There is good correlation between the frequency of hot days and the average summer maximum temperature.
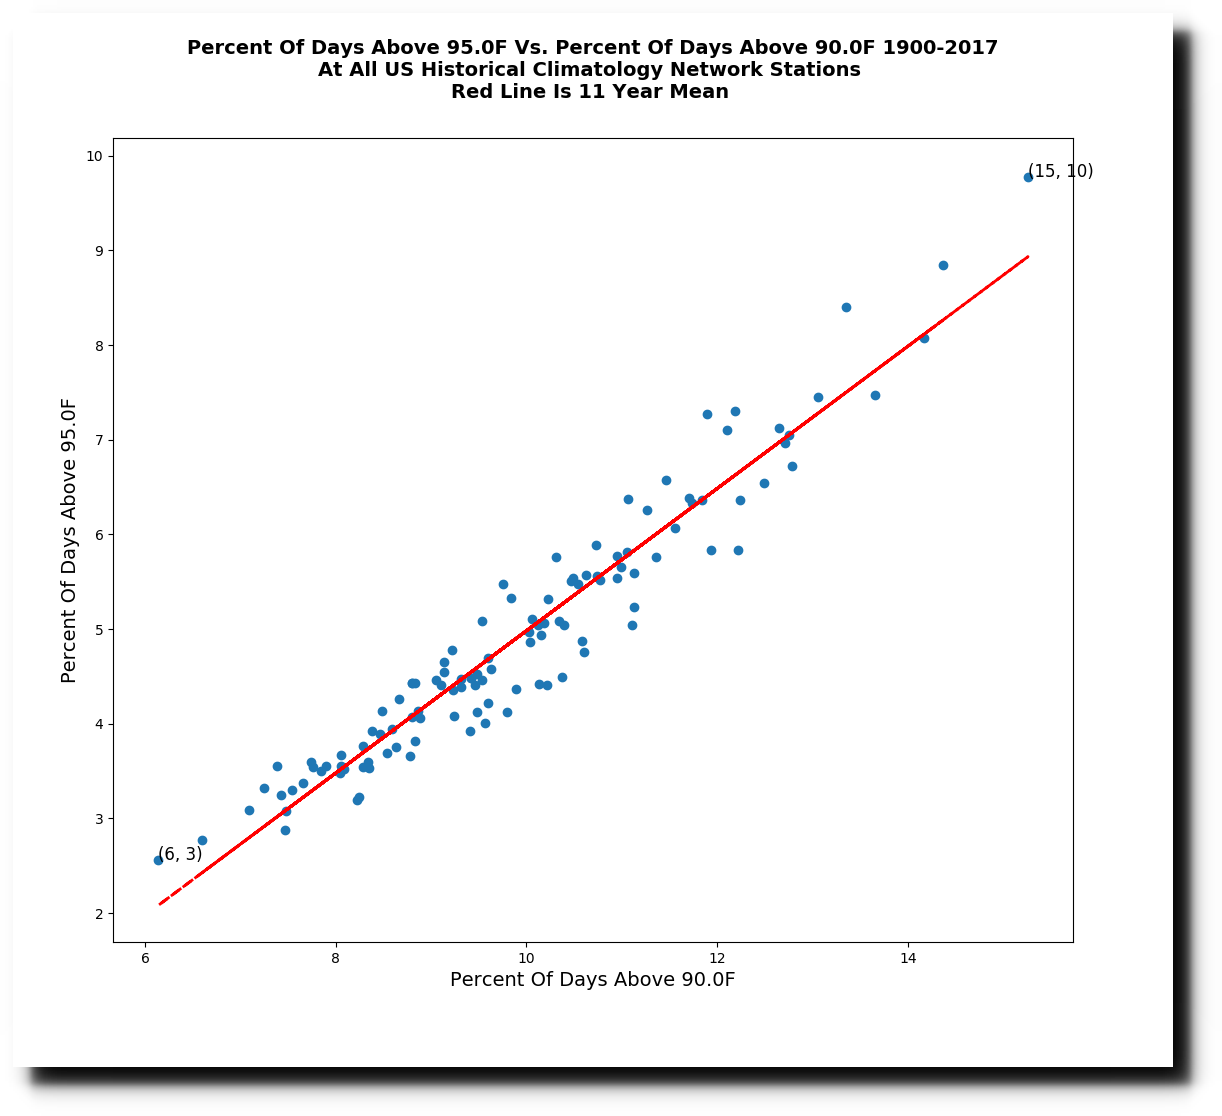
Not surprisingly, the frequency of 95 degree days correlates very well with the frequency of 90 degrees days.
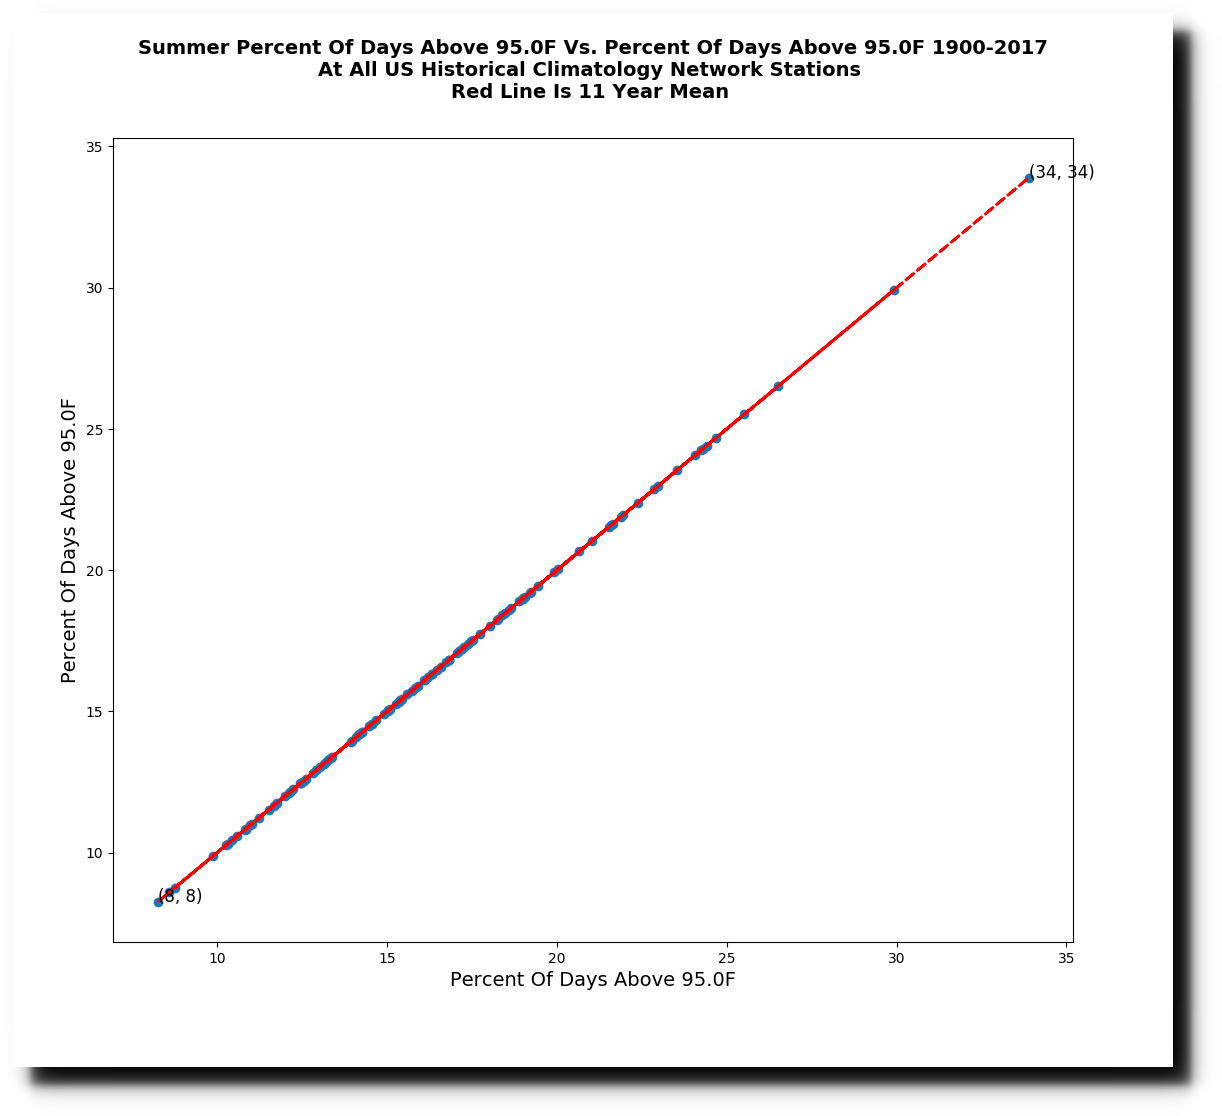
There is perfect correlation between the frequency of 95 degree days, and the frequency of 95 degree days.
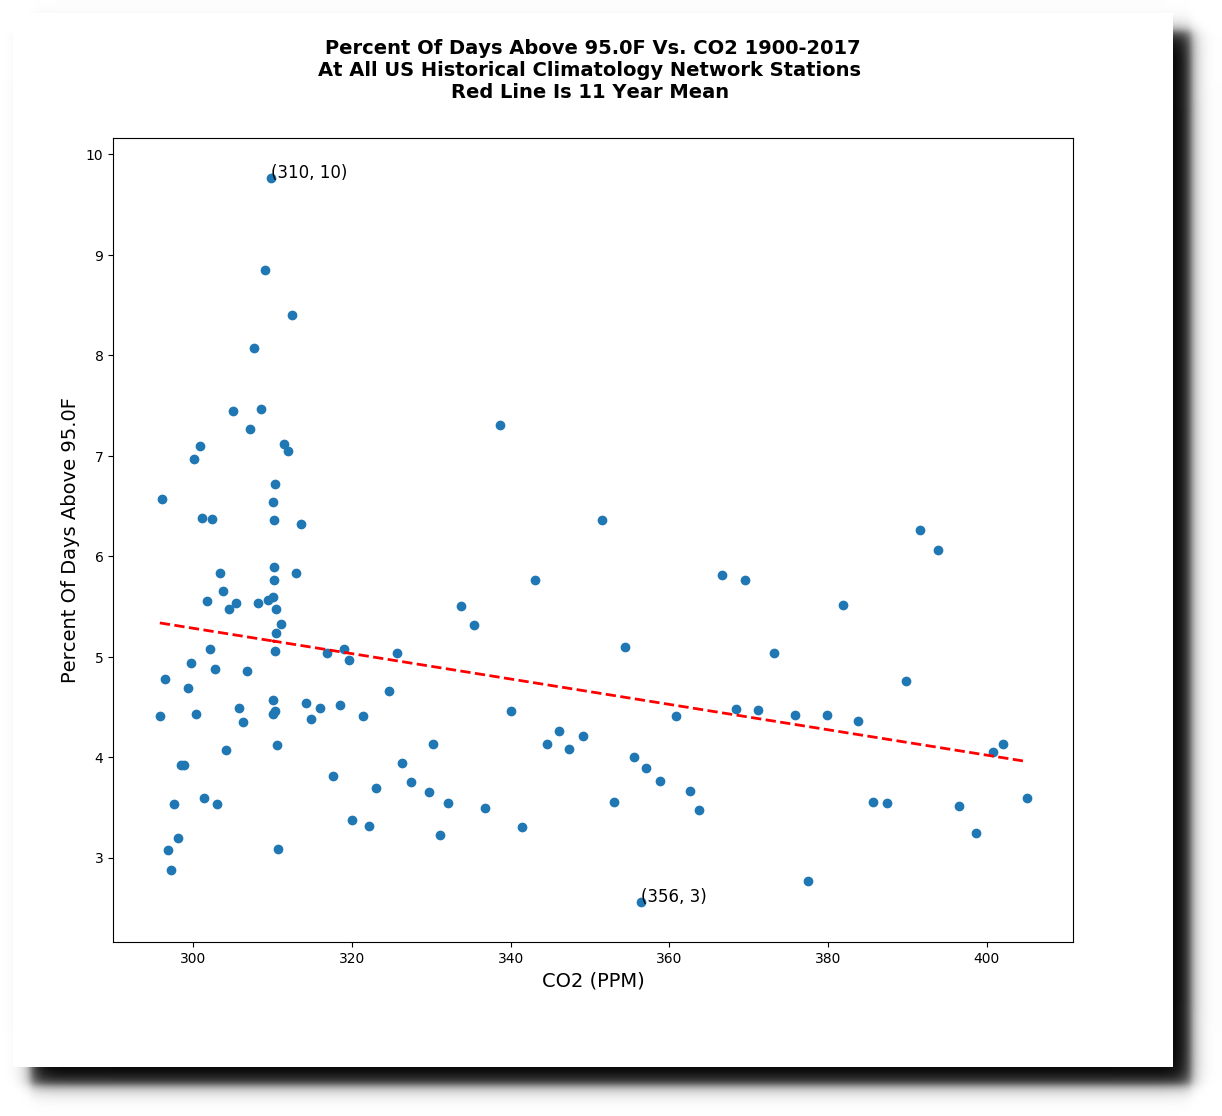
However, there is no correlation between the frequency of hot days and atmospheric CO2. If anything, there is anti-correlation.
So which one do climate scientists latch on to? The only relationship which shows anti-correlation. Climate science is a 100% fact-free venture, and the biggest clown show on Earth.
Posted in Uncategorized
Leave a comment
New Ice-Free Arctic Forecast
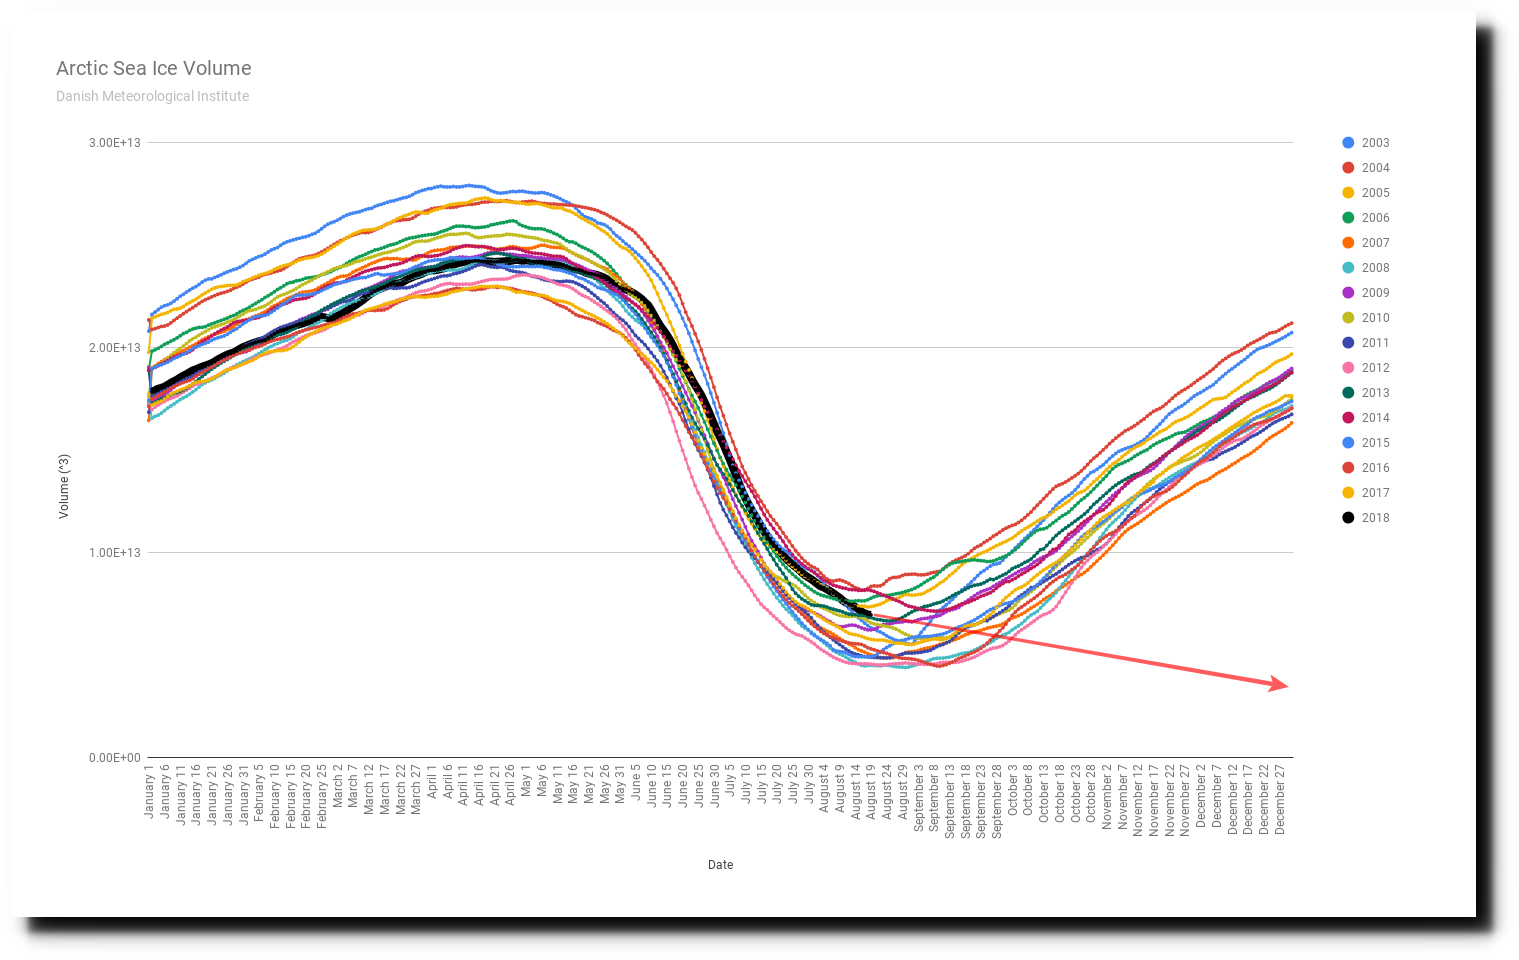
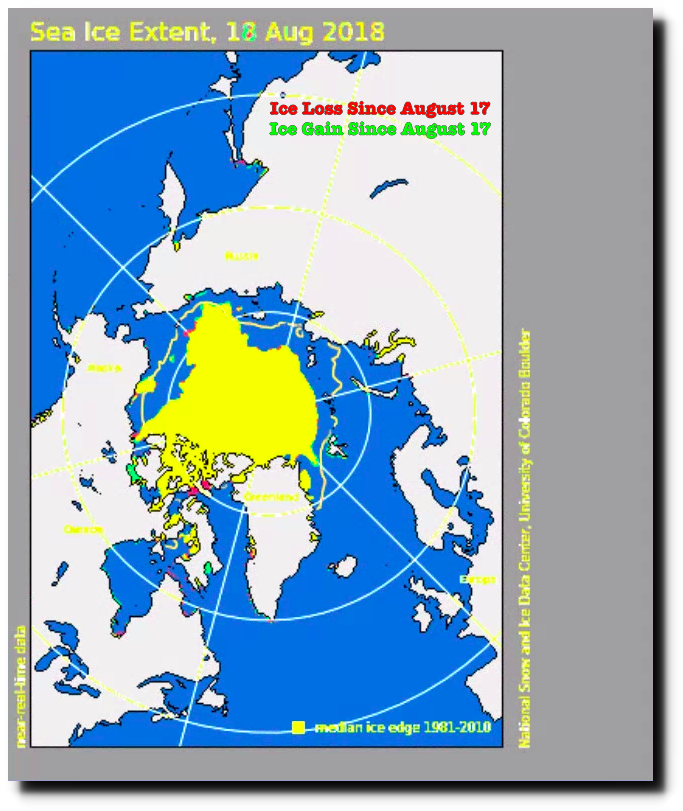
Arctic sea ice melt dropped to its lowest level since May 12 yesterday, and now the Arctic won’t be ice-free until July 20 of next year, 12:01 am.
For the third day in a row, there has been almost no change in Arctic sea ice extent.
Index of /DATASETS/NOAA/G02135/north/daily/images/2018/08_Aug/
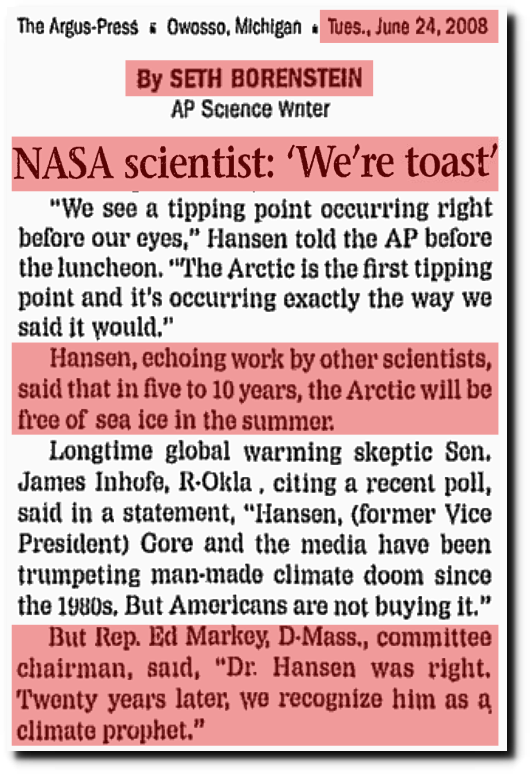
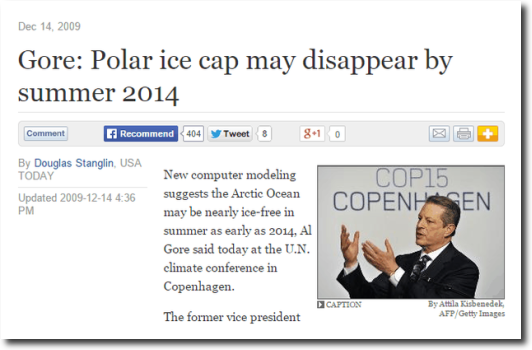
I’m sad to report that the prophets have failed. The Arctic will not be ice-free in 2014 or 2018 as they promised.
Posted in Uncategorized
Leave a comment
California’s Fake Temperature Record
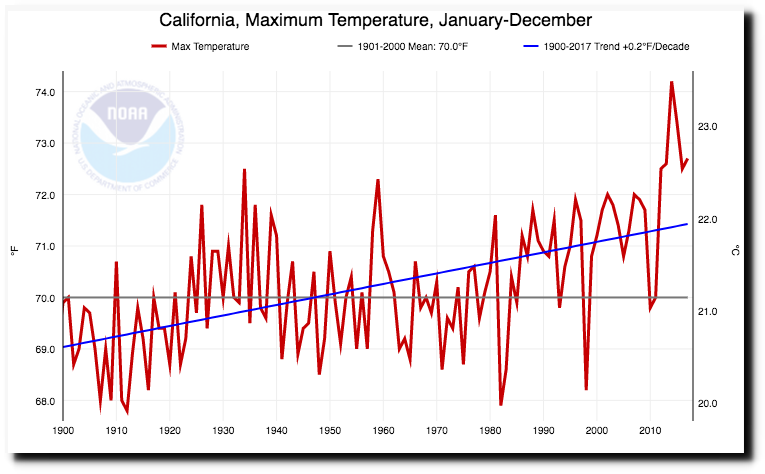
Using my new tool set, I am homing in on what is wrong with the California temperature record.
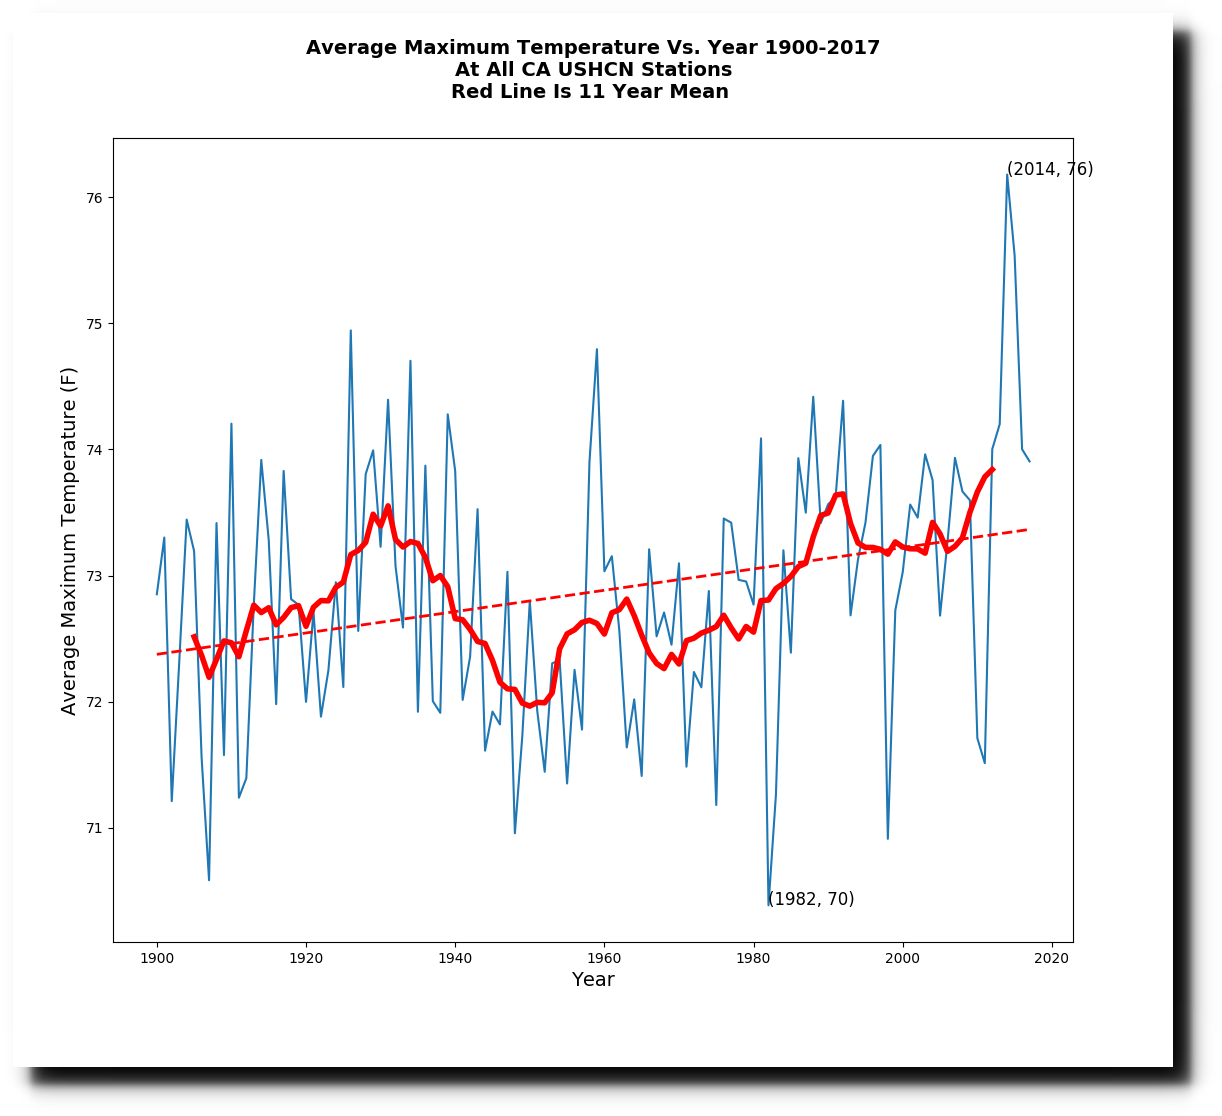
The first problem is just their usual data tampering, which doubles the slope. This is what the raw data looks like.
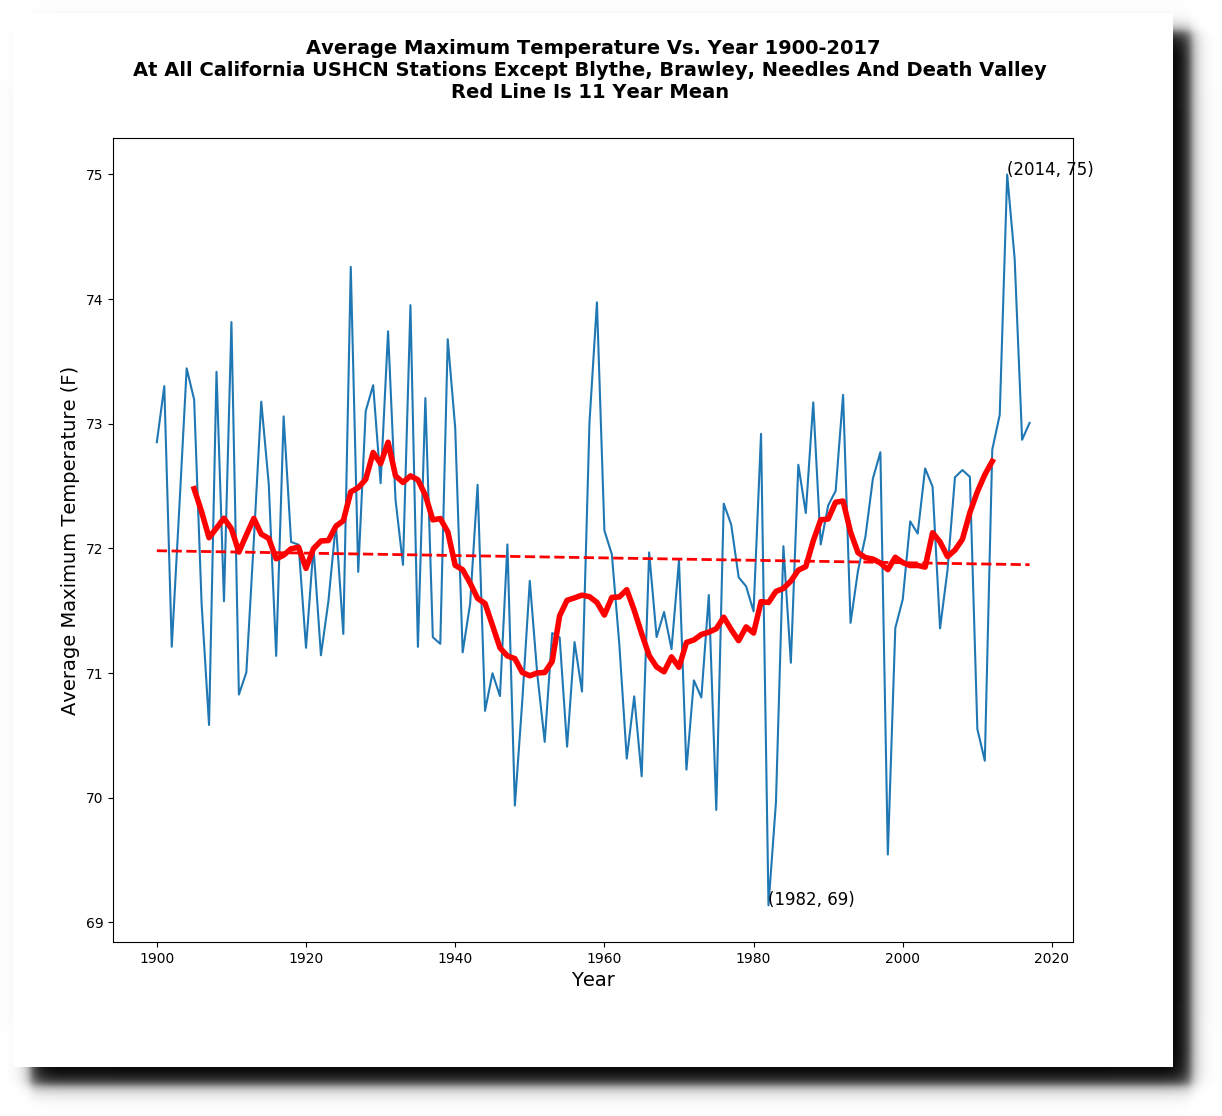
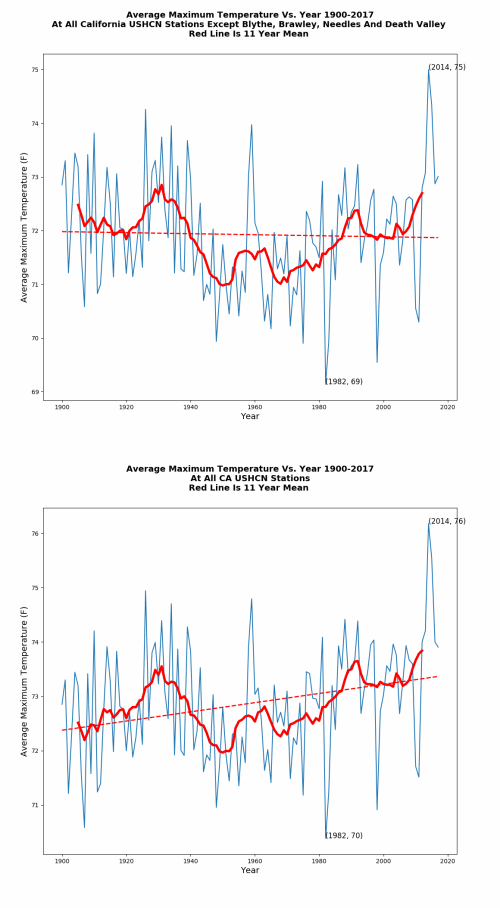
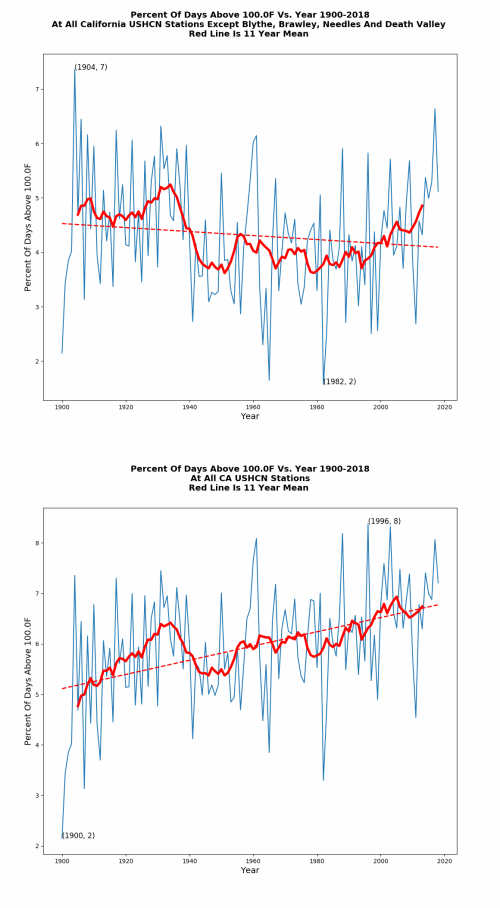
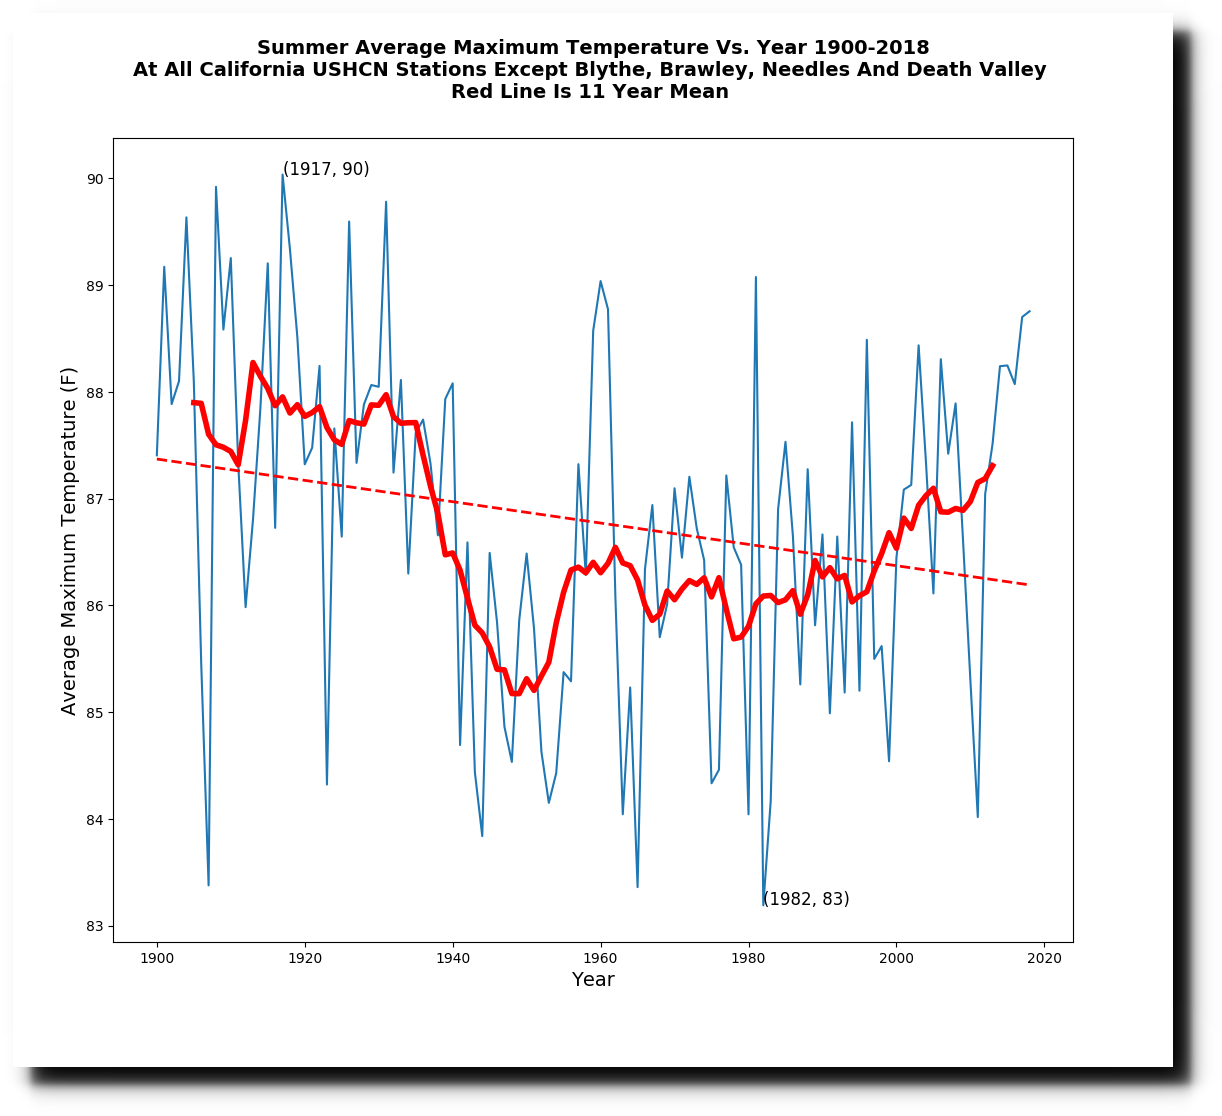
But the real dirty trick is that they successively added four hot stations over time, which pushed the temperature up on the right side of the graph. Brawley was added in 1910, Blythe was added in 1913, Needles was added in 1940, and Death Valley was added in 1961. If those stations are removed, then California maximum temperatures show no trend.
The animations below show how the successive additions of those four stations completely changed the California temperature graphs, and perverted science.
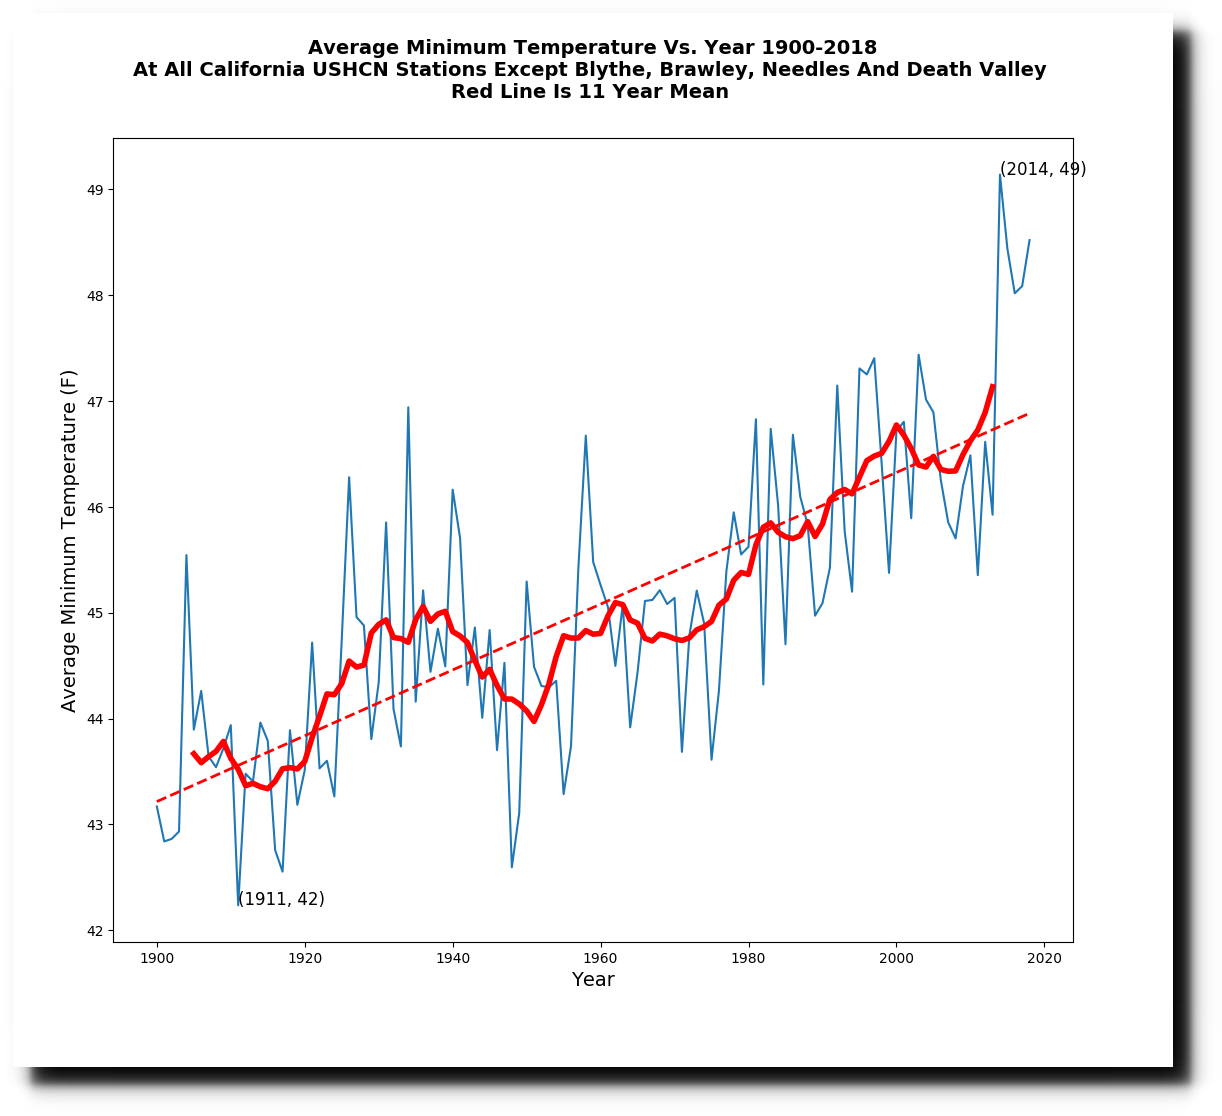
Minimum temperatures have increased, and I suspect this is primarily due to Urban Heat Island effects. I will be looking at this more soon.
The spike in 2014 was due to the El Nino, and primarily affected winter temperatures. Without the four hot stations corrupting the trend, California summers have cooled sharply since the 1920’s.
Posted in Uncategorized
Leave a comment
New Ice-Free Arctic Date
Like the day before, there was almost no change in Arctic sea ice extent yesterday.
Index of /DATASETS/NOAA/G02135/north/daily/images/2018/08_Aug/
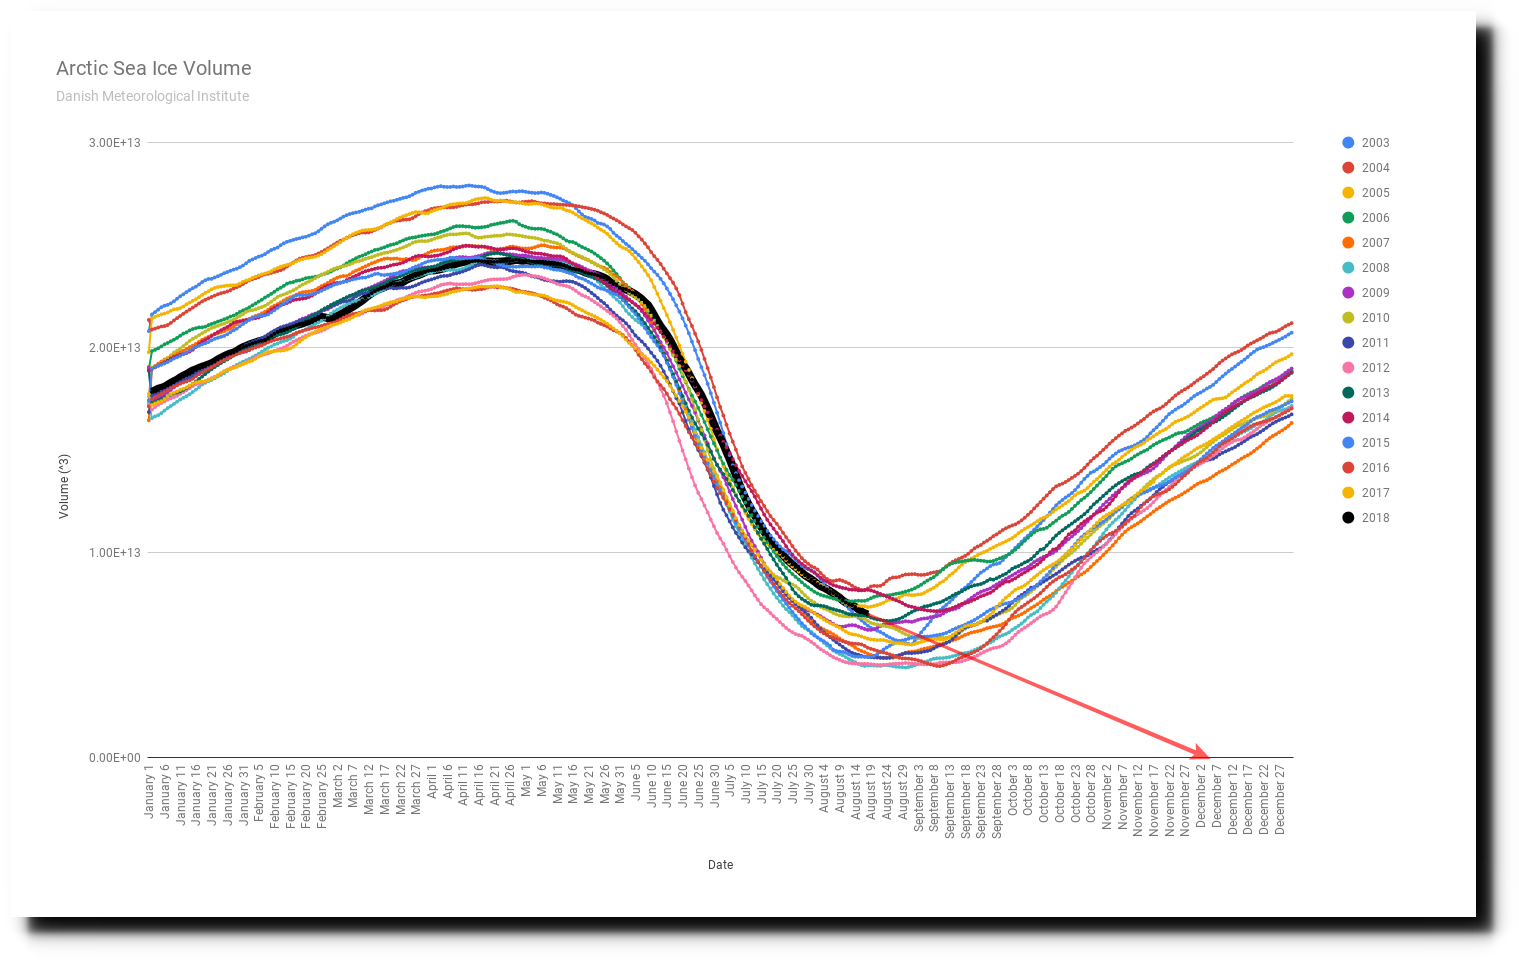
Nevertheless, at current volume melt rates, the Arctic will be ice-free on December 7, 2018 at 3:41 PM.
Posted in Uncategorized
Leave a comment


