Truth In Labeling At The New York Times : “NOT REAL NEWS”

Arctic sea ice thickness has been increasing for the past twelve years, and is up 44% since 2012. I calculated this by dividing DMI volume by MASIE extent.  (The MASIE records only go back to 2006.).

The Arctic Basin is covered with thick ice.

FullSize_CICE_combine_thick_SM_EN_20180629.png (1337×1113)

This is a change from ten years ago, when much of the Arctic was covered with thin ice.

FullSize_CICE_combine_thick_SM_EN_20080629.png (1337×1113)

According to this New York Times article from 1958, Central Arctic ice thickness is about the same as it was 60 years ago.

The Changing Face of the Arctic; The Changing Face of the Arctic – The New York Times

Yesterday, the fake news New York Times and Mark Serreze quite predictably conflated Arctic sea ice thickness with extent, and declared their Arctic melting scam to still be alive.  Apparently no one at the New York Times actually reads the New York Times.

NOT REAL NEWS: Map Does Not Debunk Global Warming – The New York Times

That is the same Mark Serreze who predicted the North Pole would be ice-free ten years ago, and declared the Arctic to be screaming.

North Pole could be ice free in 2008 | New Scientist

Star-News – Google News Archive Search

My forecast that NSIDC would rapidly ramp up the junk science and BS, is coming true however.

Posted in Uncategorized | Leave a comment

Drudge Continues Pimping Heatwave Fake News

Drudge is linking to articles claiming record heat in the East and the Midwest. As always, fake news. June 30 heat has dropped off sharply since the peak in 1901, with almost all of the coolest years coming after Hansen’s 1988 testimony to Congress.

New York isn’t forecast to have any 100 degree days this week, but this week in 1901 temperatures in New York were over 100 degrees on several days, and hundreds of people were dying on the streets. On June 29, 1936 – Indiana was 111 degrees – the first of many days over 110 degrees that summer.

Later in July 1901, the heatwave expanded to Europe

THE HEAT WAVE IN EUROPE.; Numerous Deaths in London — Effects of Drought Serious — No Signs of a Change in England.

And continued into August.

UNPRECEDENTED HEAT IN ITALY.; Vineyards Shriveled Up — People Forced to Sleep in the Open Air.

Climate alarmism depends on a lack of knowledge of history, combined with a press corps willing to print fake news. Cold and rainy in Boulder right now, and the greenest I have ever seen it at the end of June.

Posted in Uncategorized | Leave a comment

Basic Physics For Climate Dummies

Temperature in the Venusian troposphere increases linearly with altitude. At an altitude of 50km in the Venusian atmosphere, the temperature is about the same as at Earth’s surface.

At an altitude of 50km in the Venusian atmosphere, the pressure is also about the same as the earth’s surface.

http://www.datasync.com/~rsf1/vel/1918vpt.htm

What this demonstrates is that planetary temperature correlates with atmospheric pressure, not atmospheric composition. Venus’ atmosphere has 95% CO2, Earth’s atmosphere has 0.04% CO2.  Incredible that an entire field of (junk) science could be based on such a fundamental misunderstanding of basic physics.

The surface of Venus receives very little sunlight, and receives no sunlight for months at a time. yet the temperature never drops. How could anyone be stupid enough to believe the high temperatures are due to the “greenhouse effect?”

Posted in Uncategorized | Leave a comment

2010 Blog Post On Venus

I wrote this post in 2010.

Hyperventilating on Venus | Watts Up With That?

Here was Lubos’ response.

I had to independently agree with the broad and important conclusion – after some checks and self-corrections – and I will try to convince you about the conclusion. This conclusion does mean that people like Carl Sagan, James Hansen, and others who have been using Venus as the model for the Earth’s greenhouse effect were wrong even morally.

The Reference Frame: Hyperventilating on Venus

Posted in Uncategorized | Leave a comment

Hansen’s 350 PPM Tipping Point

NASA’s James Hansen originally warned that 350 PPM CO2 was the tipping point, and that we would all burn up and drown unless CO2 was reduced to those levels.

Hansen (et al) must read: Get back to 350 ppm or risk an ice-free planet – ThinkProgress

TargetCO2_20080407.pdf

Data shows the exact opposite.  All of Cleveland’s hottest days occurred below 350 PPM, with the hottest day occurring the week of Hansen’s 1988 Congressional testimony. Since that summer in 1988, Cleveland hasn’t had any really hot days.

Highest temperatures in Cleveland history | cleveland.com

The Arctic warmed ten degrees from 1900 to 1947, with CO2 below 310 PPM. It is 100% certain that Arctic warming has nothing to CO2 levels.

If the Antarctic ice regions and the major Greenland icecap should reduce at the rate of the present melting, he said, the oceanic surfaces would rise to catastrophic proportions.

  • May 31, 1947

31 May 1947 – The Arctic is melting says scientist – Trove

Arctic warming prior to the 1940’s troubled Hansen, so he simply erased it.

May 2018 Measured Vs. Adjusted

Global warming appeals to the left because :

  1. It blames humans
  2. The solution is more government control
  3. The solution is more taxes
  4. The solution is less personal freedom
  5. The solution is wealth redistribution

It has nothing to do with science.

Posted in Uncategorized | Leave a comment

An Average June In The US

Mean temperatures in June have been a little above average since 1895

Maximum temperatures have been a little below average.

The frequency of hot days has been about average.

I started at ASU in 1974, the peak year of the ice age scare.  Phoenix had nineteen consecutive days above 110 degrees during June and early July, their all-time record heat wave. And we had no A/C in the fraternity house, just swamp coolers.

Posted in Uncategorized | Leave a comment

NOAA Hacks Drudge’s Brain

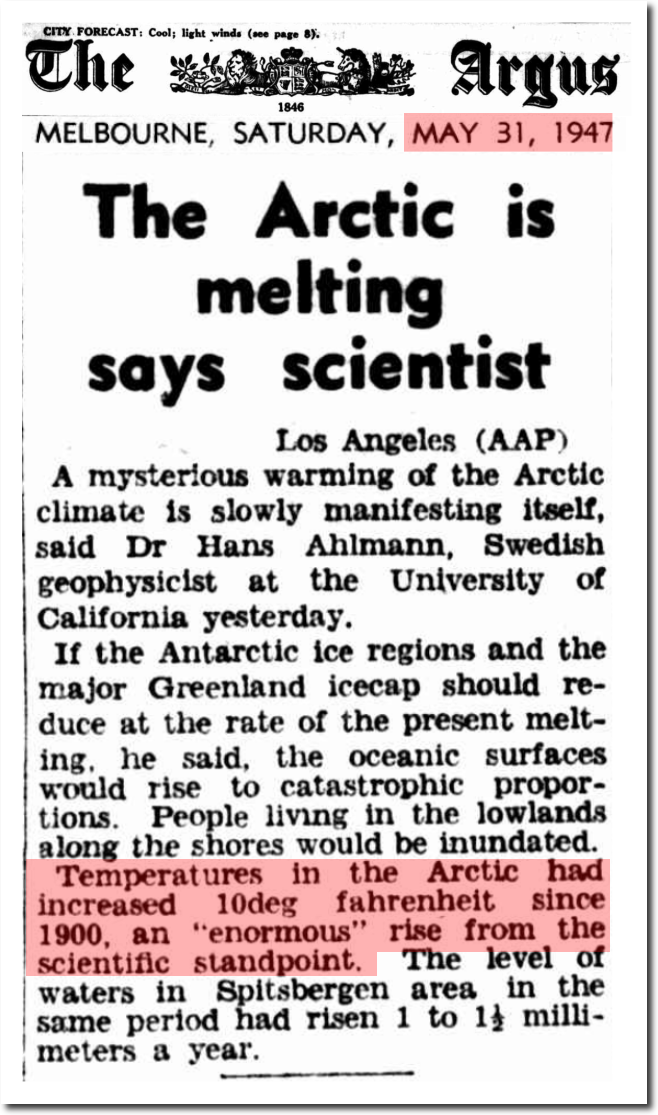
Drudge is again losing the plot about global warming.

He linked to this article, which used fake NOAA data to make June 2016 the hottest on record.

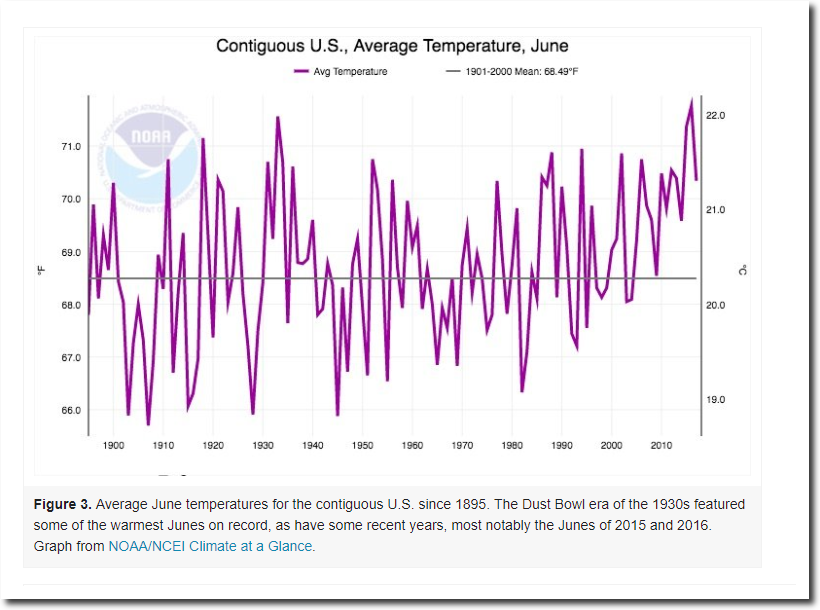
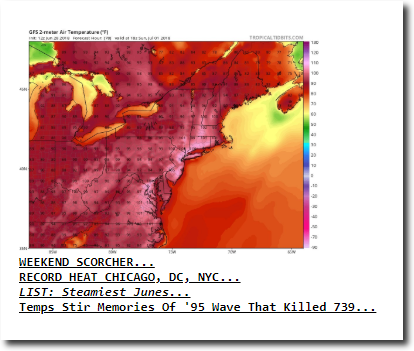
Record June Heat Waves in the U.S. by Christopher C. Burt | Category 6 | Weather Underground

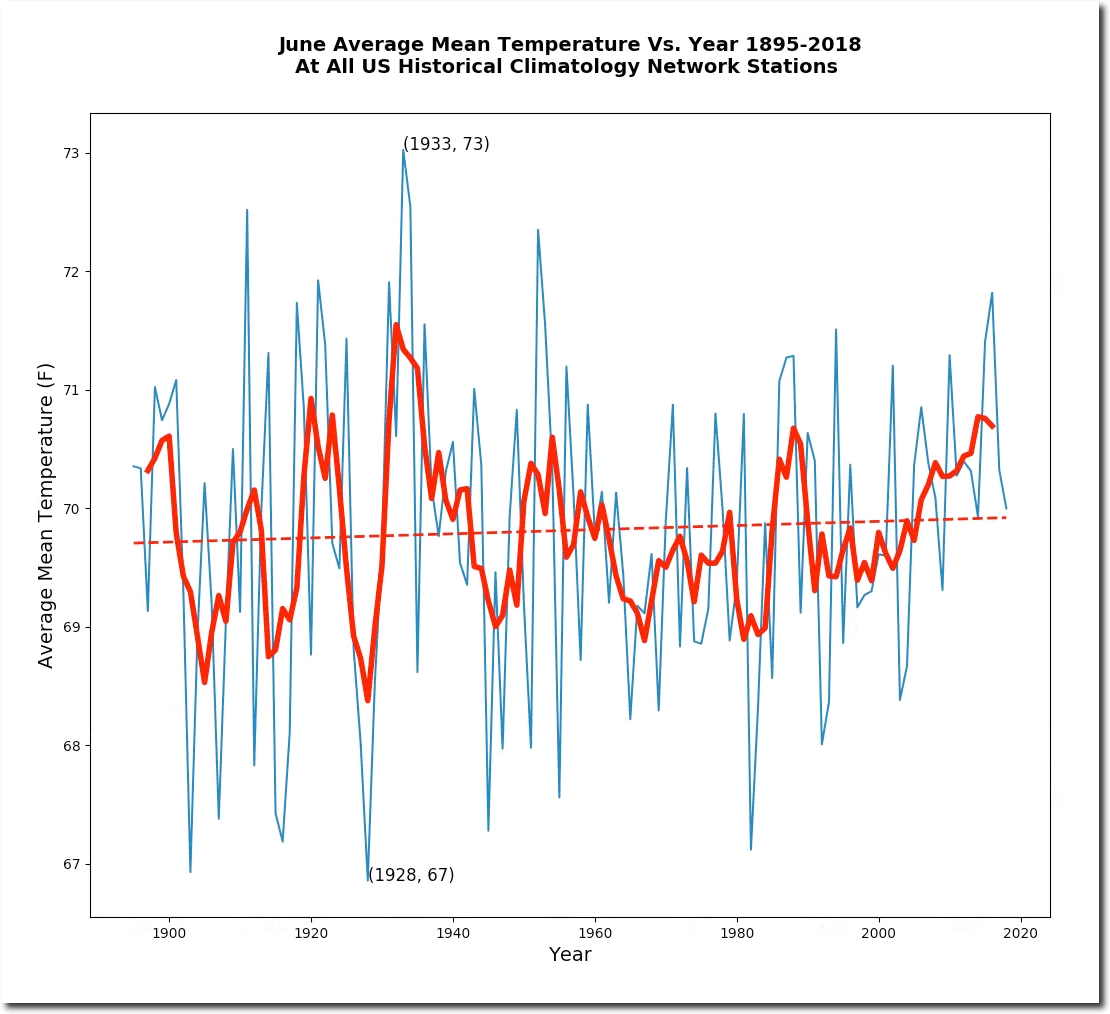
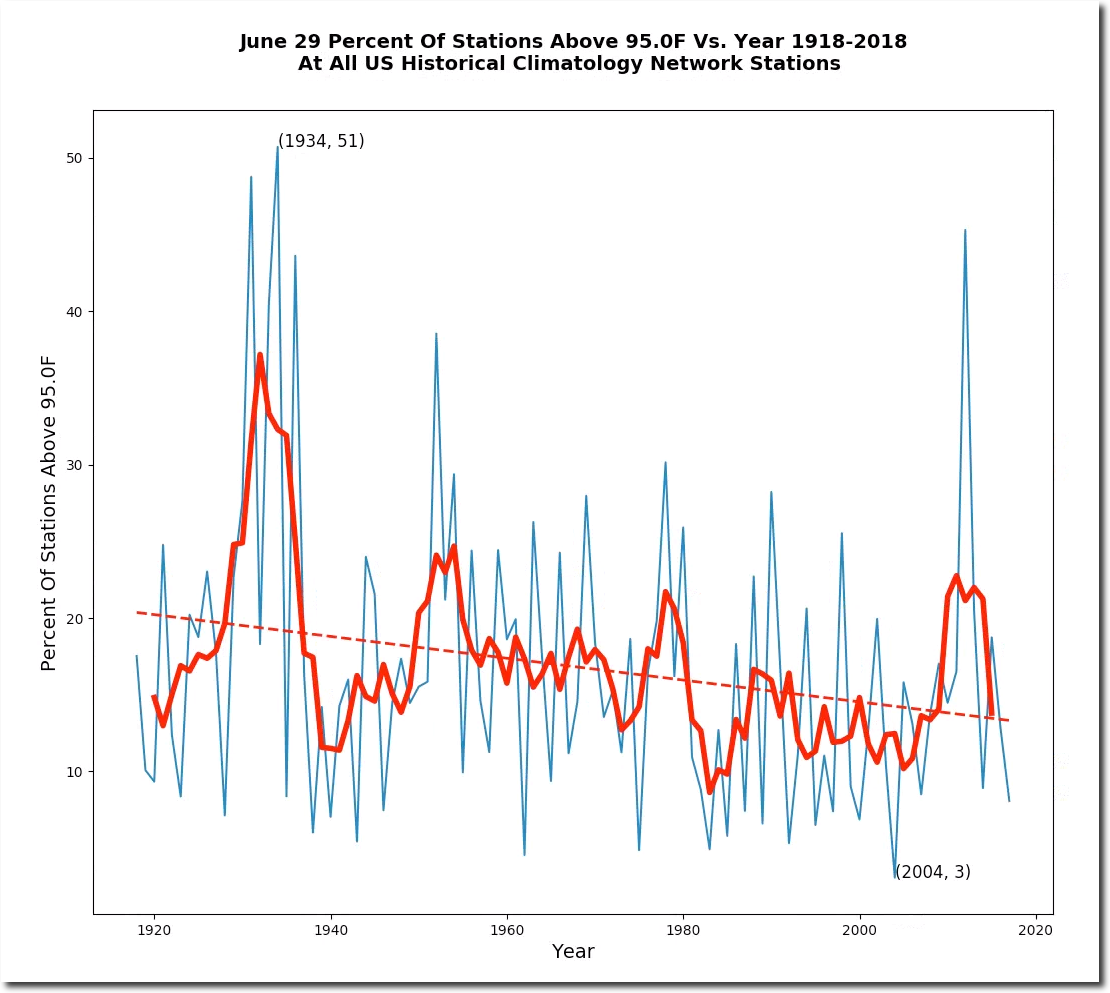
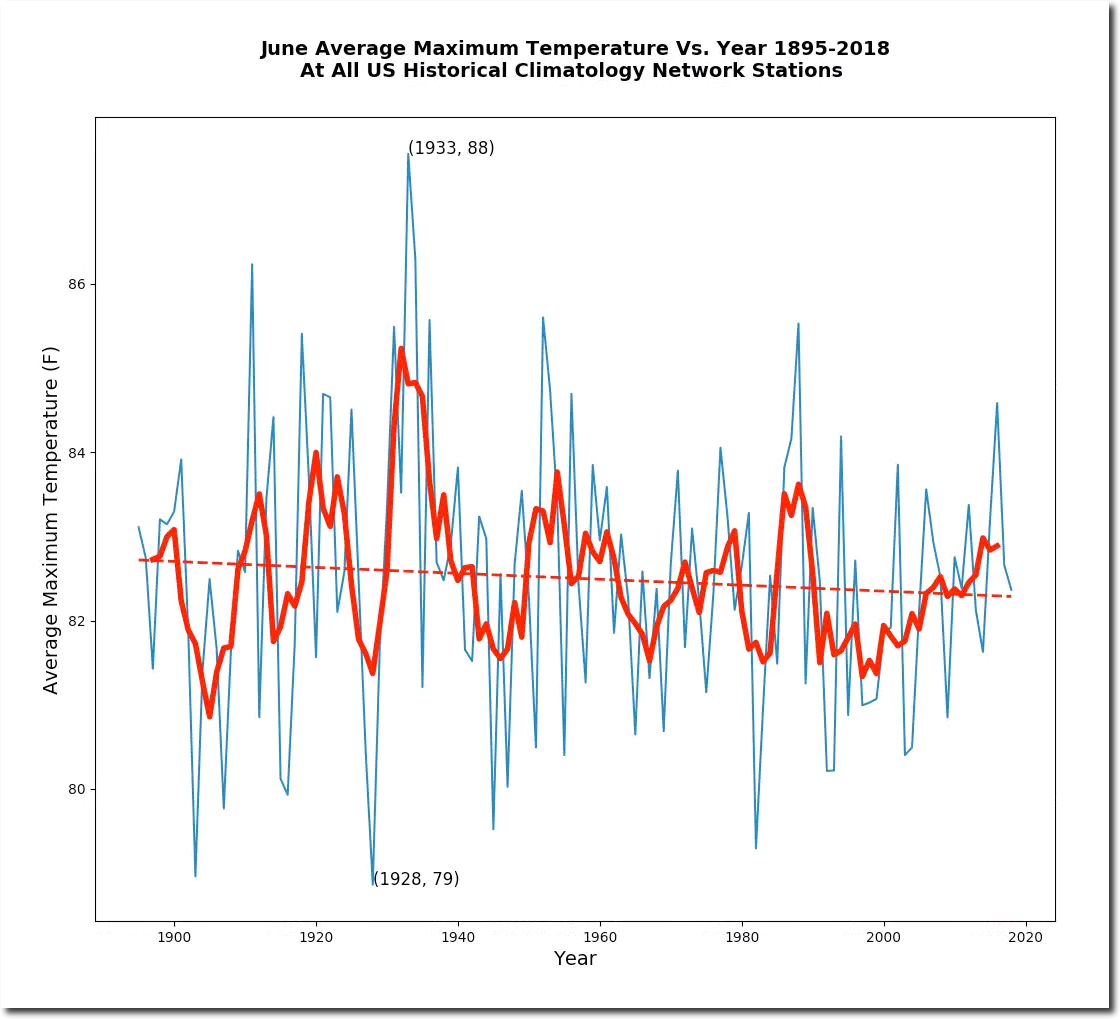
Before data tampering, NOAA data shows many Junes hotter than 2016 – the hottest being 1933.

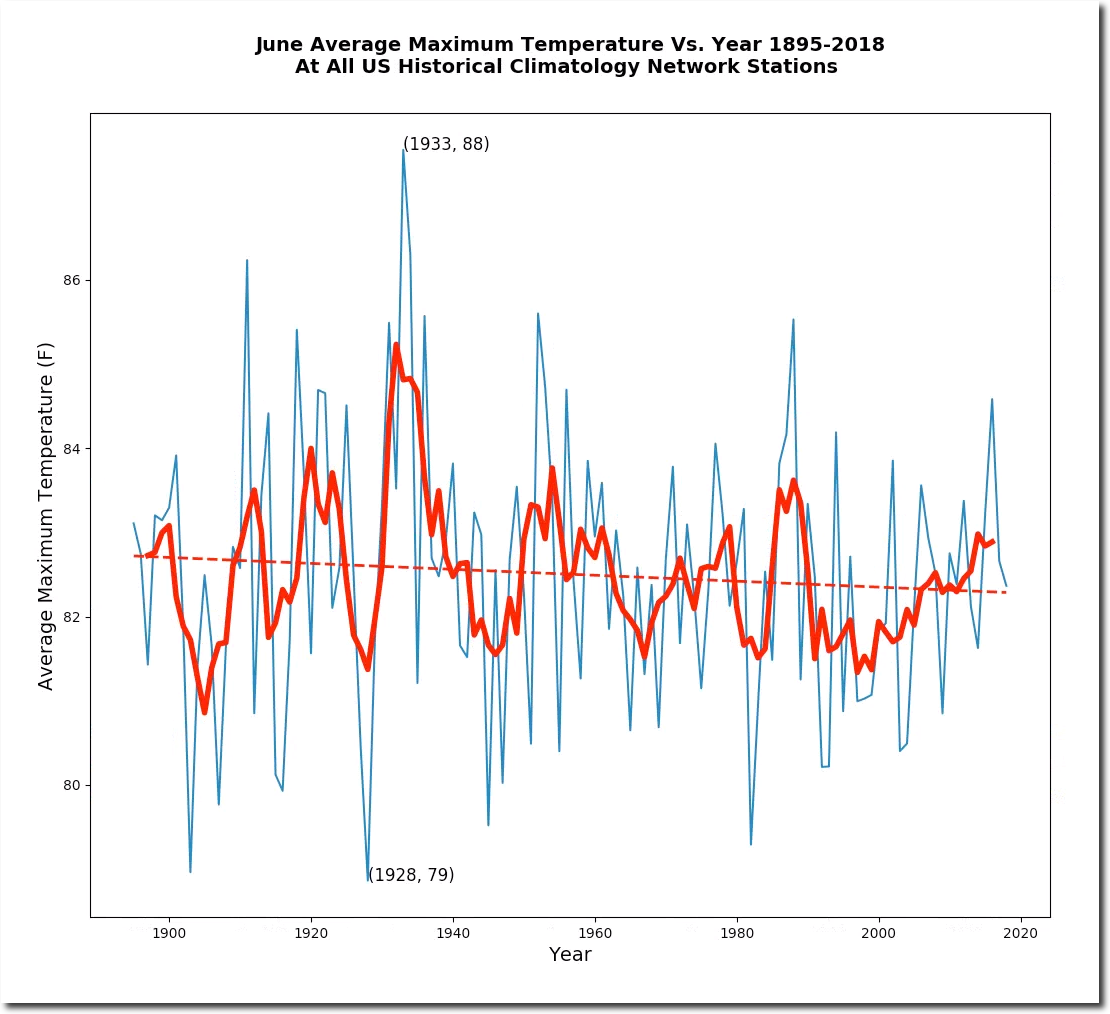
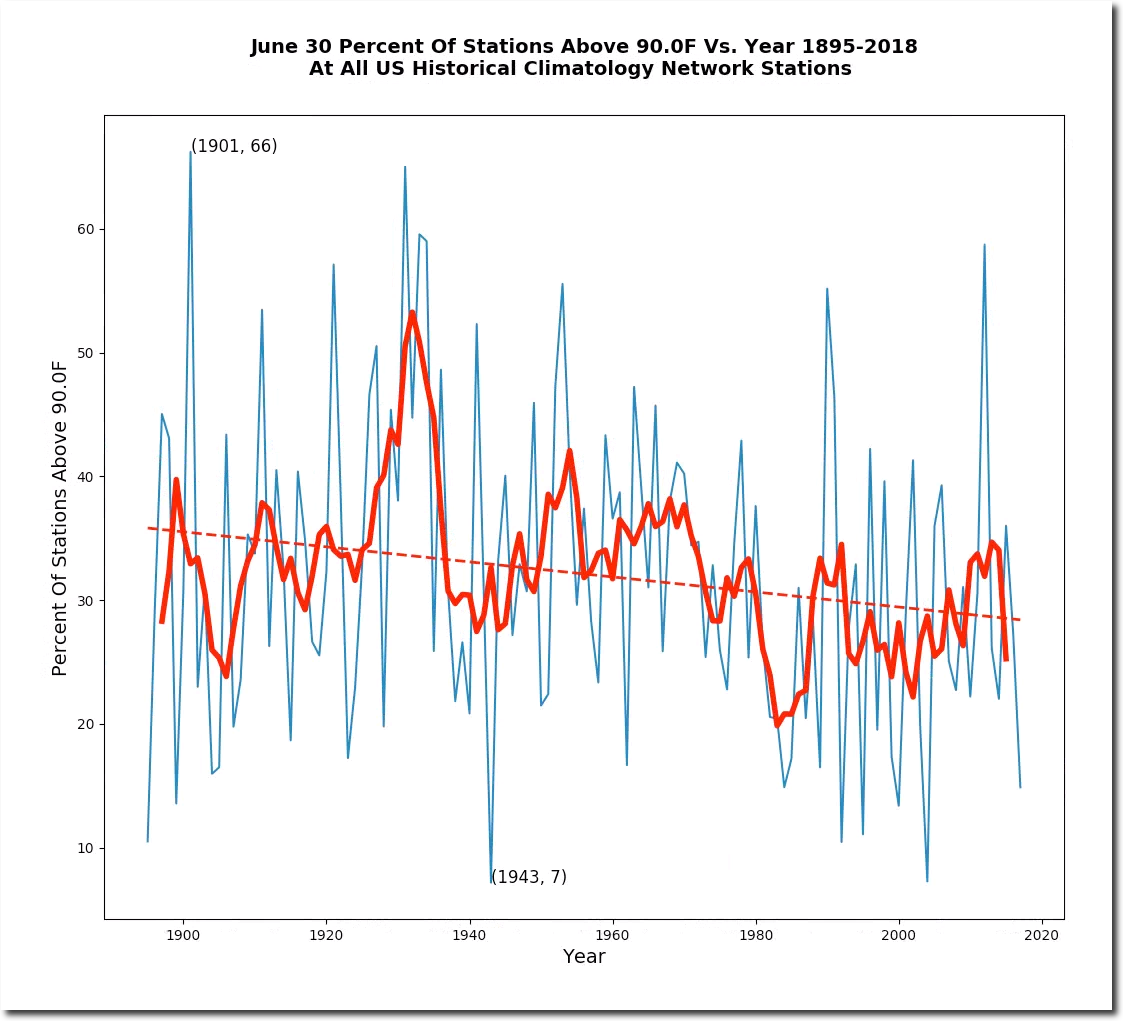
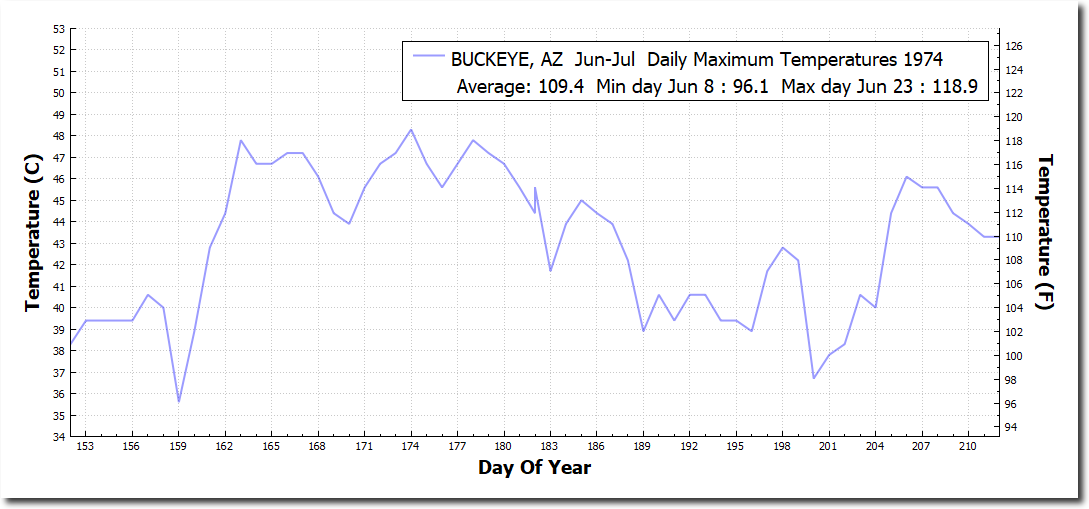
June maximum temperatures have declined in the US since the 19th century.

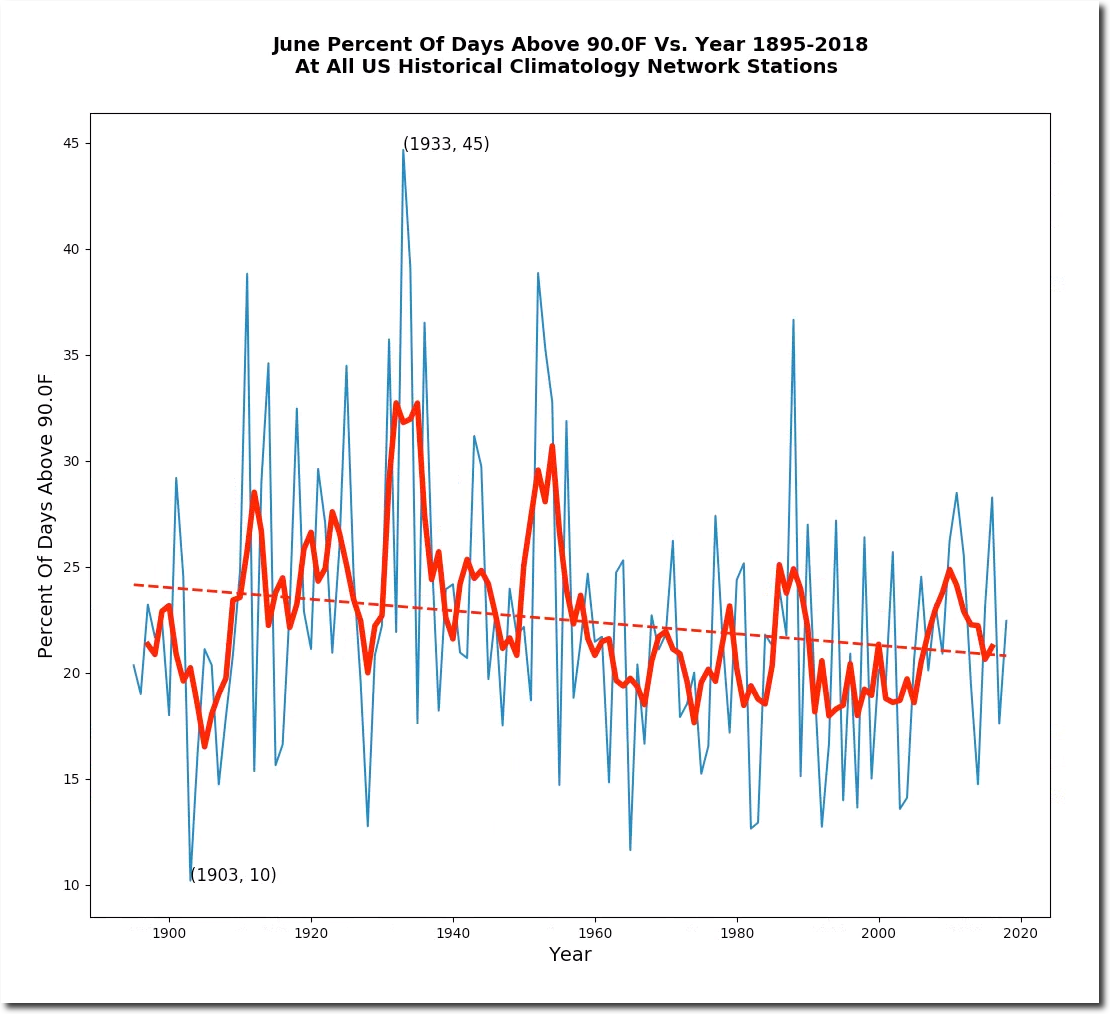
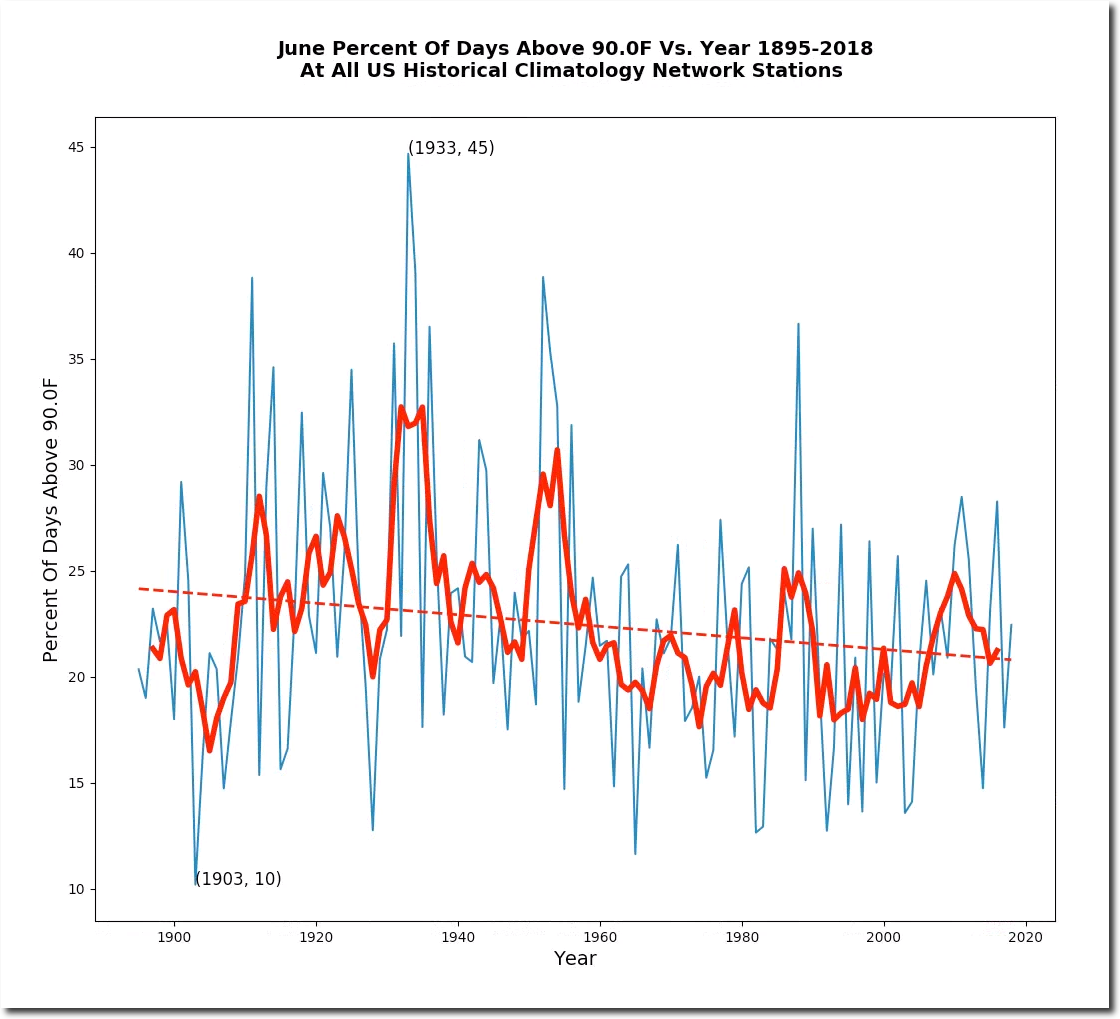
The percentage of hot June days has declined since the 19th century. Recent years have been among the lowest on record.

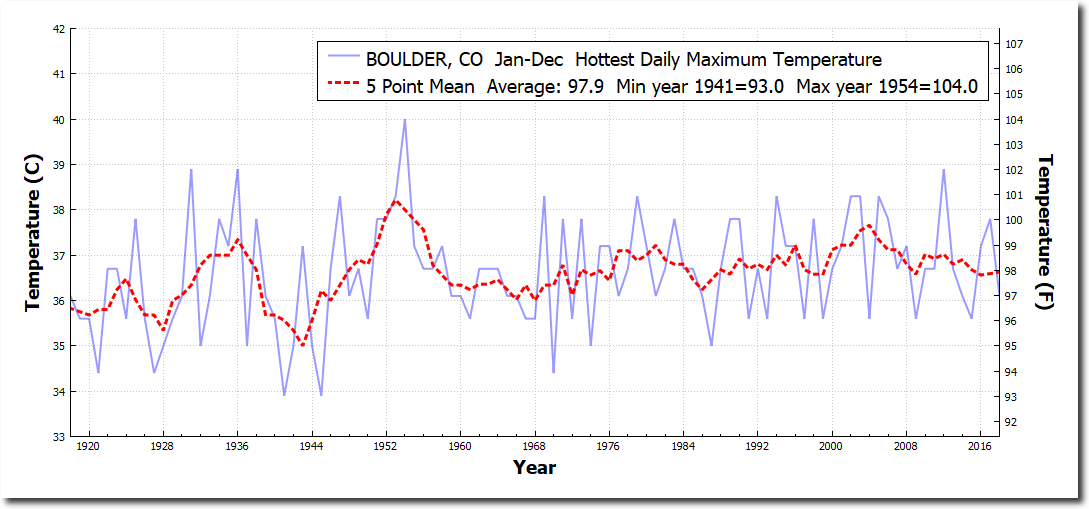
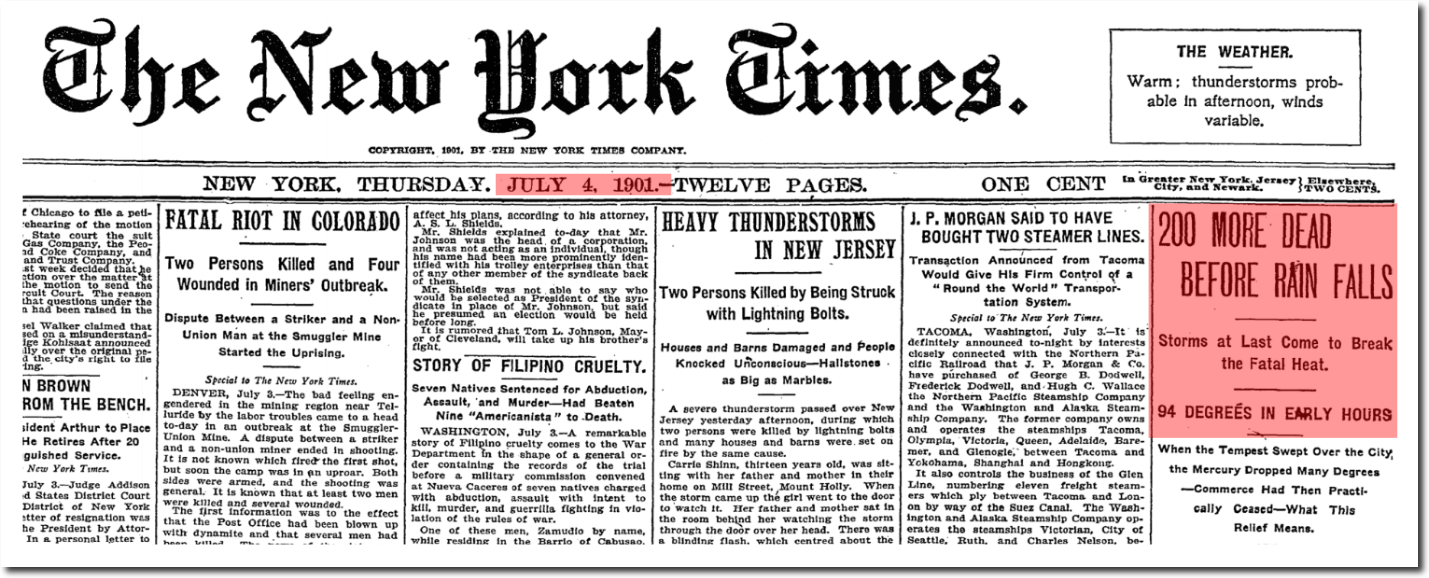
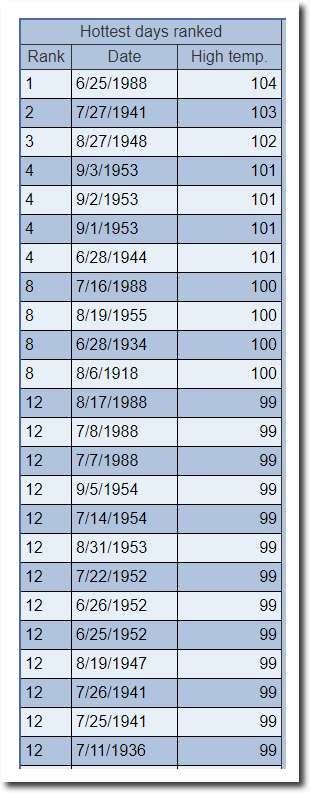
Denver is a massive urban heat island full of asphalt, glass and huge amounts of heat being dumped into the atmosphere from air conditioners and automobiles.  Here in Boulder (just outside Denver) our hottest temperature this month is about average over the past century, and much cooler than 1954.

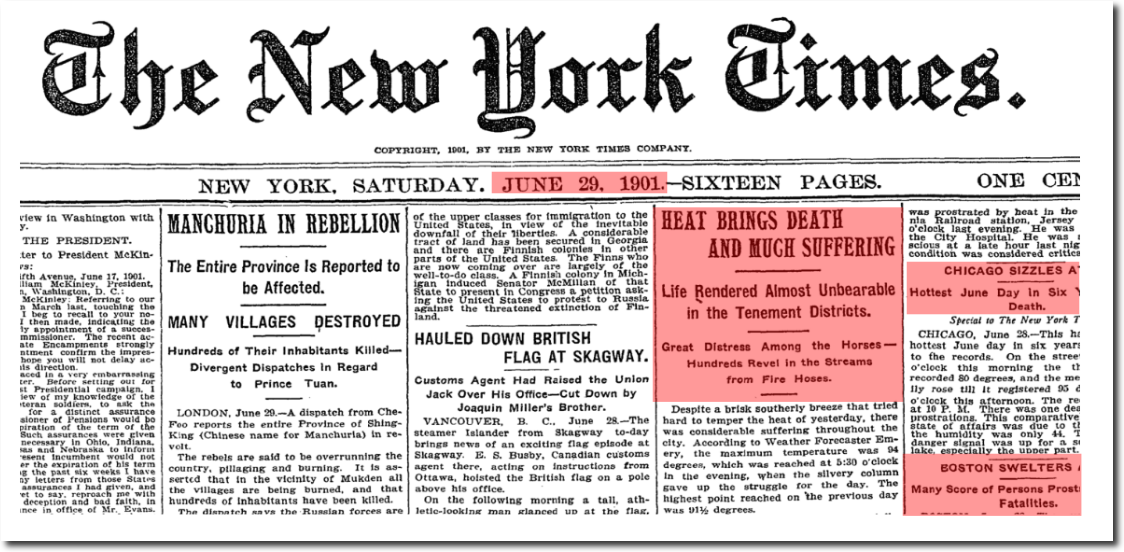
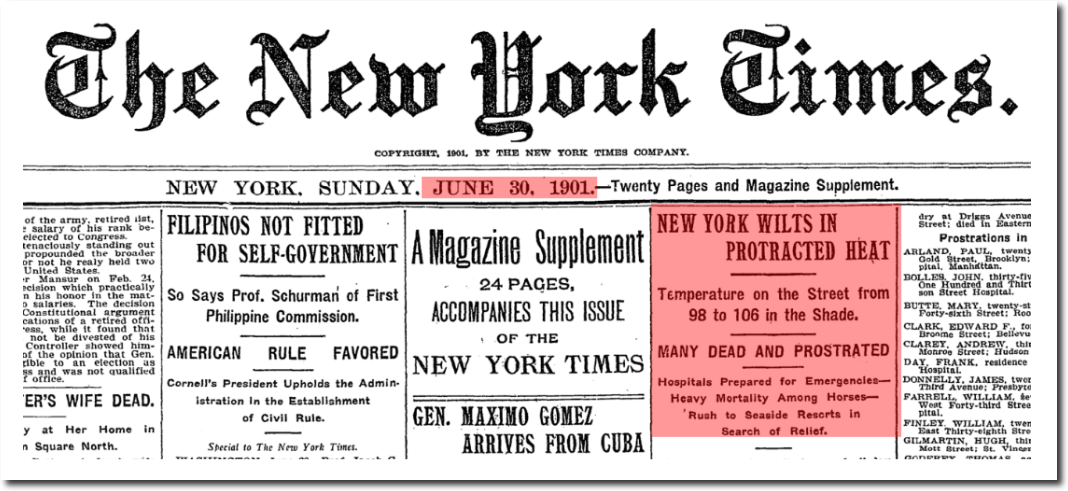
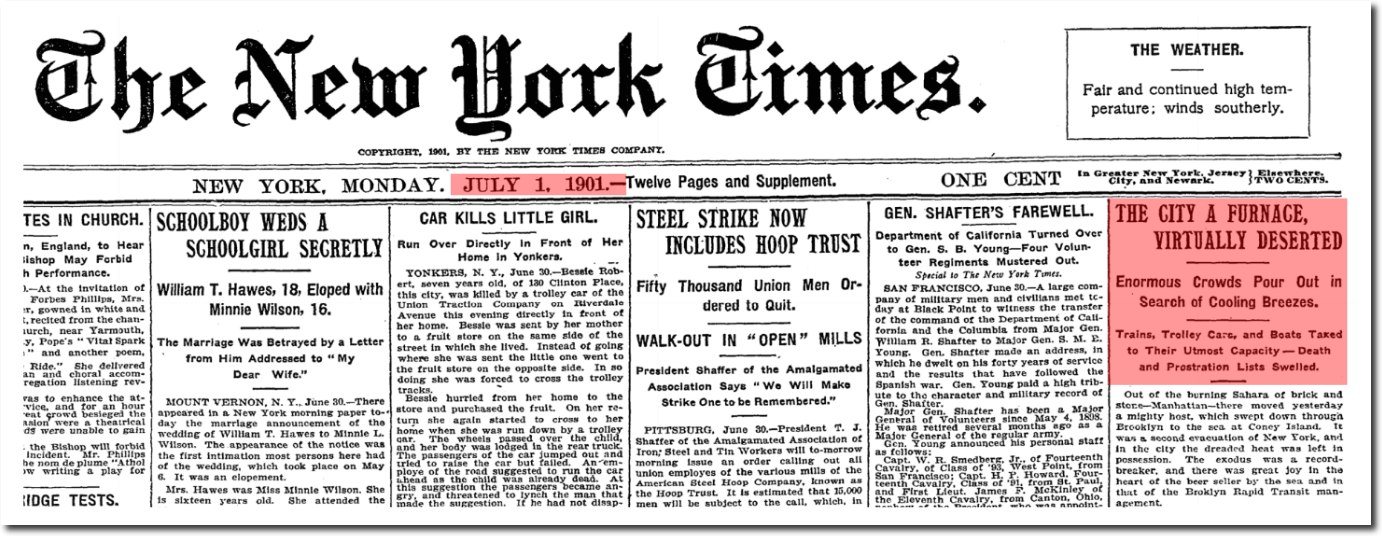
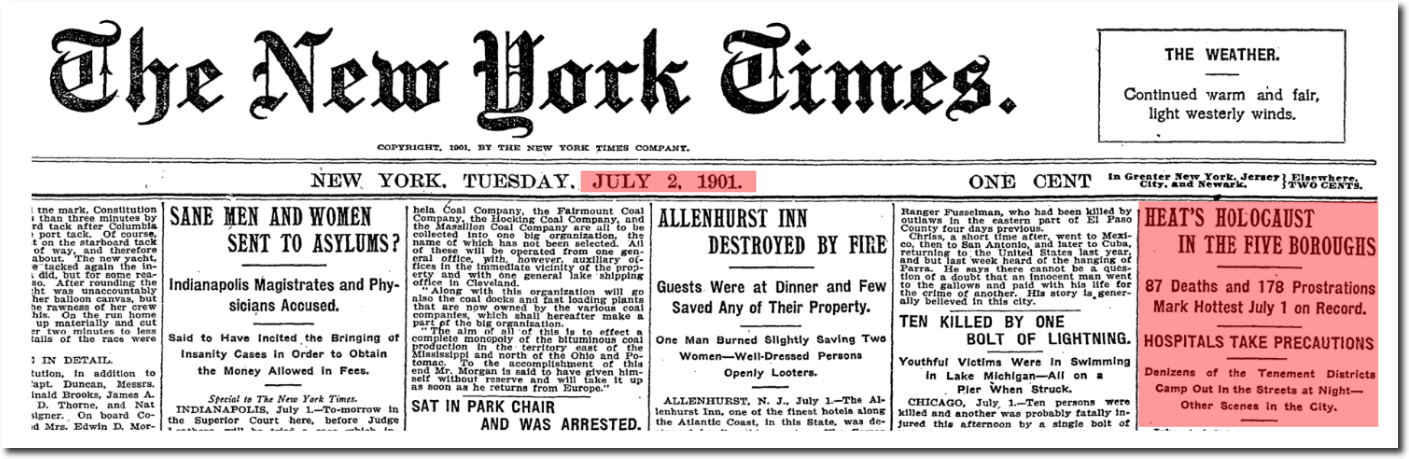
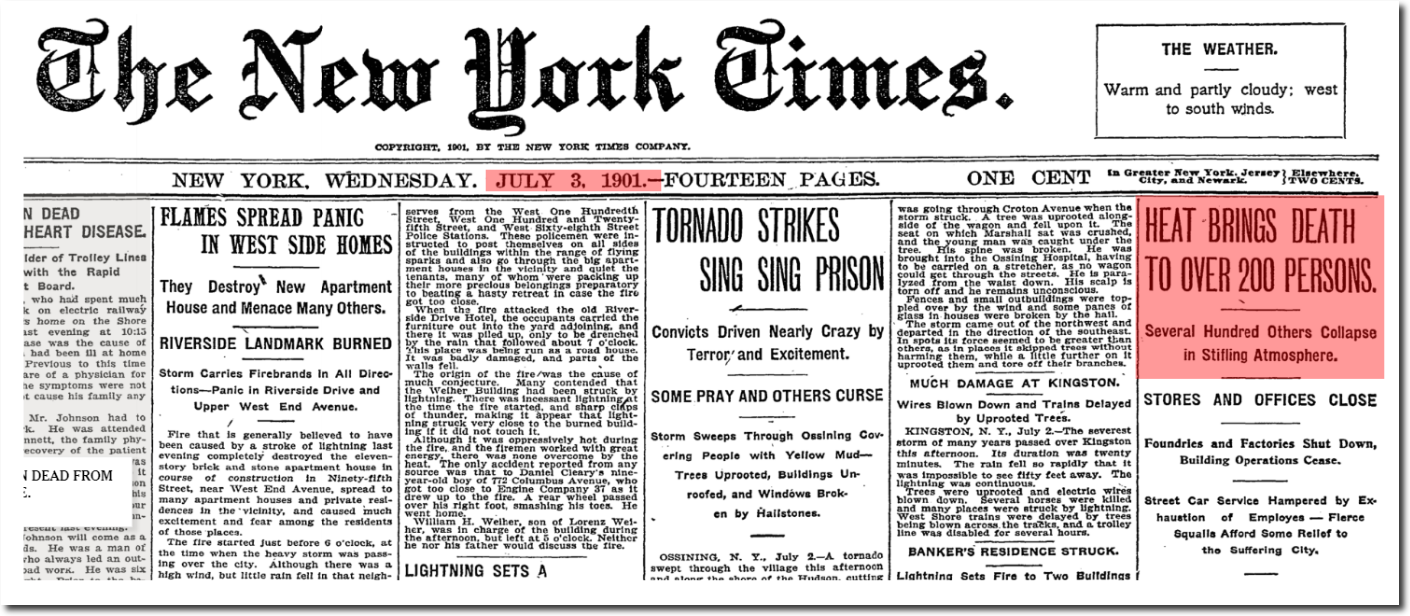
On this date in 1934, there were 100 degree temperatures from coast to coast, with Illinois reaching 107 degrees.

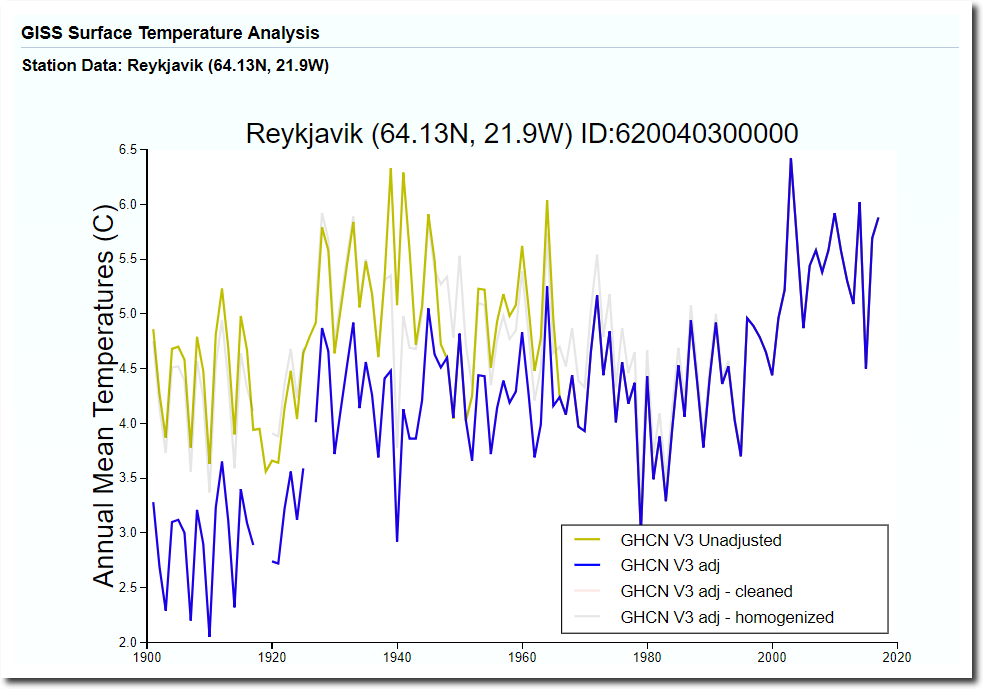
US summers are getting cooler, but through the magic of data tampering – NOAA has convinced lots of people of the exact opposite.

I was out cycling much of the afternoon yesterday, and I never use air conditioning. It didn’t feel particularly hot.  People who get addicted to air conditioning imagine the climate is overheating, when in fact they suffer from a psychological and physical dependency.

Posted in Uncategorized | Leave a comment

Plate Tectonics

Much of America’s problems lie west of the San Andreas Fault.

Posted in Uncategorized | Leave a comment

The Local Newspaper Responds

Posted in Uncategorized | Leave a comment

Excessive Snowflake Warning In Iowa

Fayette, Iowa is 77 degrees and having an “Excessive Heat Warning.” Their forecast maximum is a blistering hot 86 degrees (30C.)

June 27 temperatures at Fayette have dropped about ten degrees since 1930, and today’s “Excessive Heat” forecast is just above the long term mean, and 22 degrees cooler than 1934.

The climate is getting cooler, but the snowflakes are melting.

Posted in Uncategorized | Leave a comment