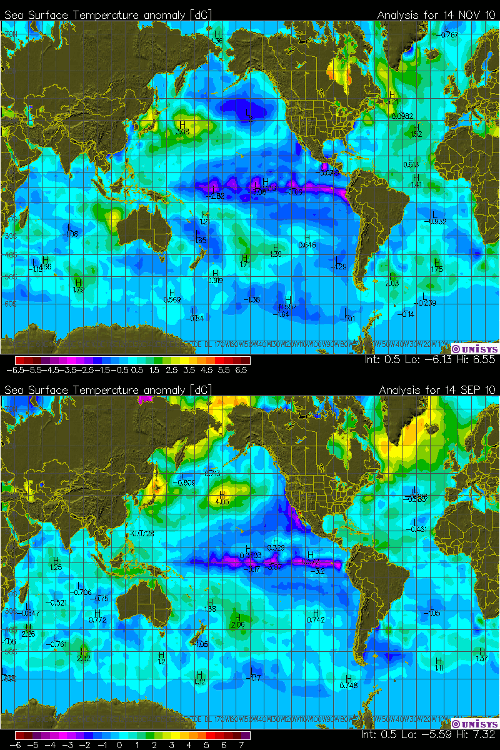
Steven: The map you posted was of sea surface temperature anomalies as you noted in the text, not ocean temperature, as your headline states. “Ocean temperature” is misleading because it implies the temperature of the ocean from surface to ocean floor.
Steven, you’re not comparing apples to apples. If you were to determine Sea Level Anomalies, the seasonal cycle would be gone. It’s one of the reasons anomalies are used.
Your SST ANOMALY map above eliminates the seasonal cycle.
Bob:
I think Steven is attempting to conform to the consensus way of stating oceans are getting warmer when talking about SST tends in anomalies that are a result of properly adjusted historical records.
Seeing how the settled consensus changes with each pronouncement it is difficult to keep abreast of current proper protocol when referring to variable definitions.
😉



The SST form UAH also is dropping again after a short blip above the 2007 levels:
http://discover.itsc.uah.edu/amsutemps/
Steven: The map you posted was of sea surface temperature anomalies as you noted in the text, not ocean temperature, as your headline states. “Ocean temperature” is misleading because it implies the temperature of the ocean from surface to ocean floor.
Regards
Sea level has dropped at least 20 mm this year, indicating that ocean temperatures are declining.
It has? You better check your source. If you remove the seasonal cycle and remove the effect of sea level pressure, the blue wiggle (60 day smooth) is going up:
http://sealevel.colorado.edu/current/sl_ib_ns_global.jpg
Does nature remove the seasonal cycle?
Steven, you’re not comparing apples to apples. If you were to determine Sea Level Anomalies, the seasonal cycle would be gone. It’s one of the reasons anomalies are used.
Your SST ANOMALY map above eliminates the seasonal cycle.
Bob:
I think Steven is attempting to conform to the consensus way of stating oceans are getting warmer when talking about SST tends in anomalies that are a result of properly adjusted historical records.
Seeing how the settled consensus changes with each pronouncement it is difficult to keep abreast of current proper protocol when referring to variable definitions.
😉