
I posted a couple of articles yesterday comparing GISS March temperatures vs satellite data in Greenland.
Reader Glc pointed out that GISS does have one station in northern Greenland with a long term contiguous temperature record. That station, Danmarkshavn, showed March, 2011 as 2.4C above the 1981-2010 mean.

http://data.giss.nasa.gov/work/gistemp/STATIONS//tmp.431043200000.1.1/station.txt
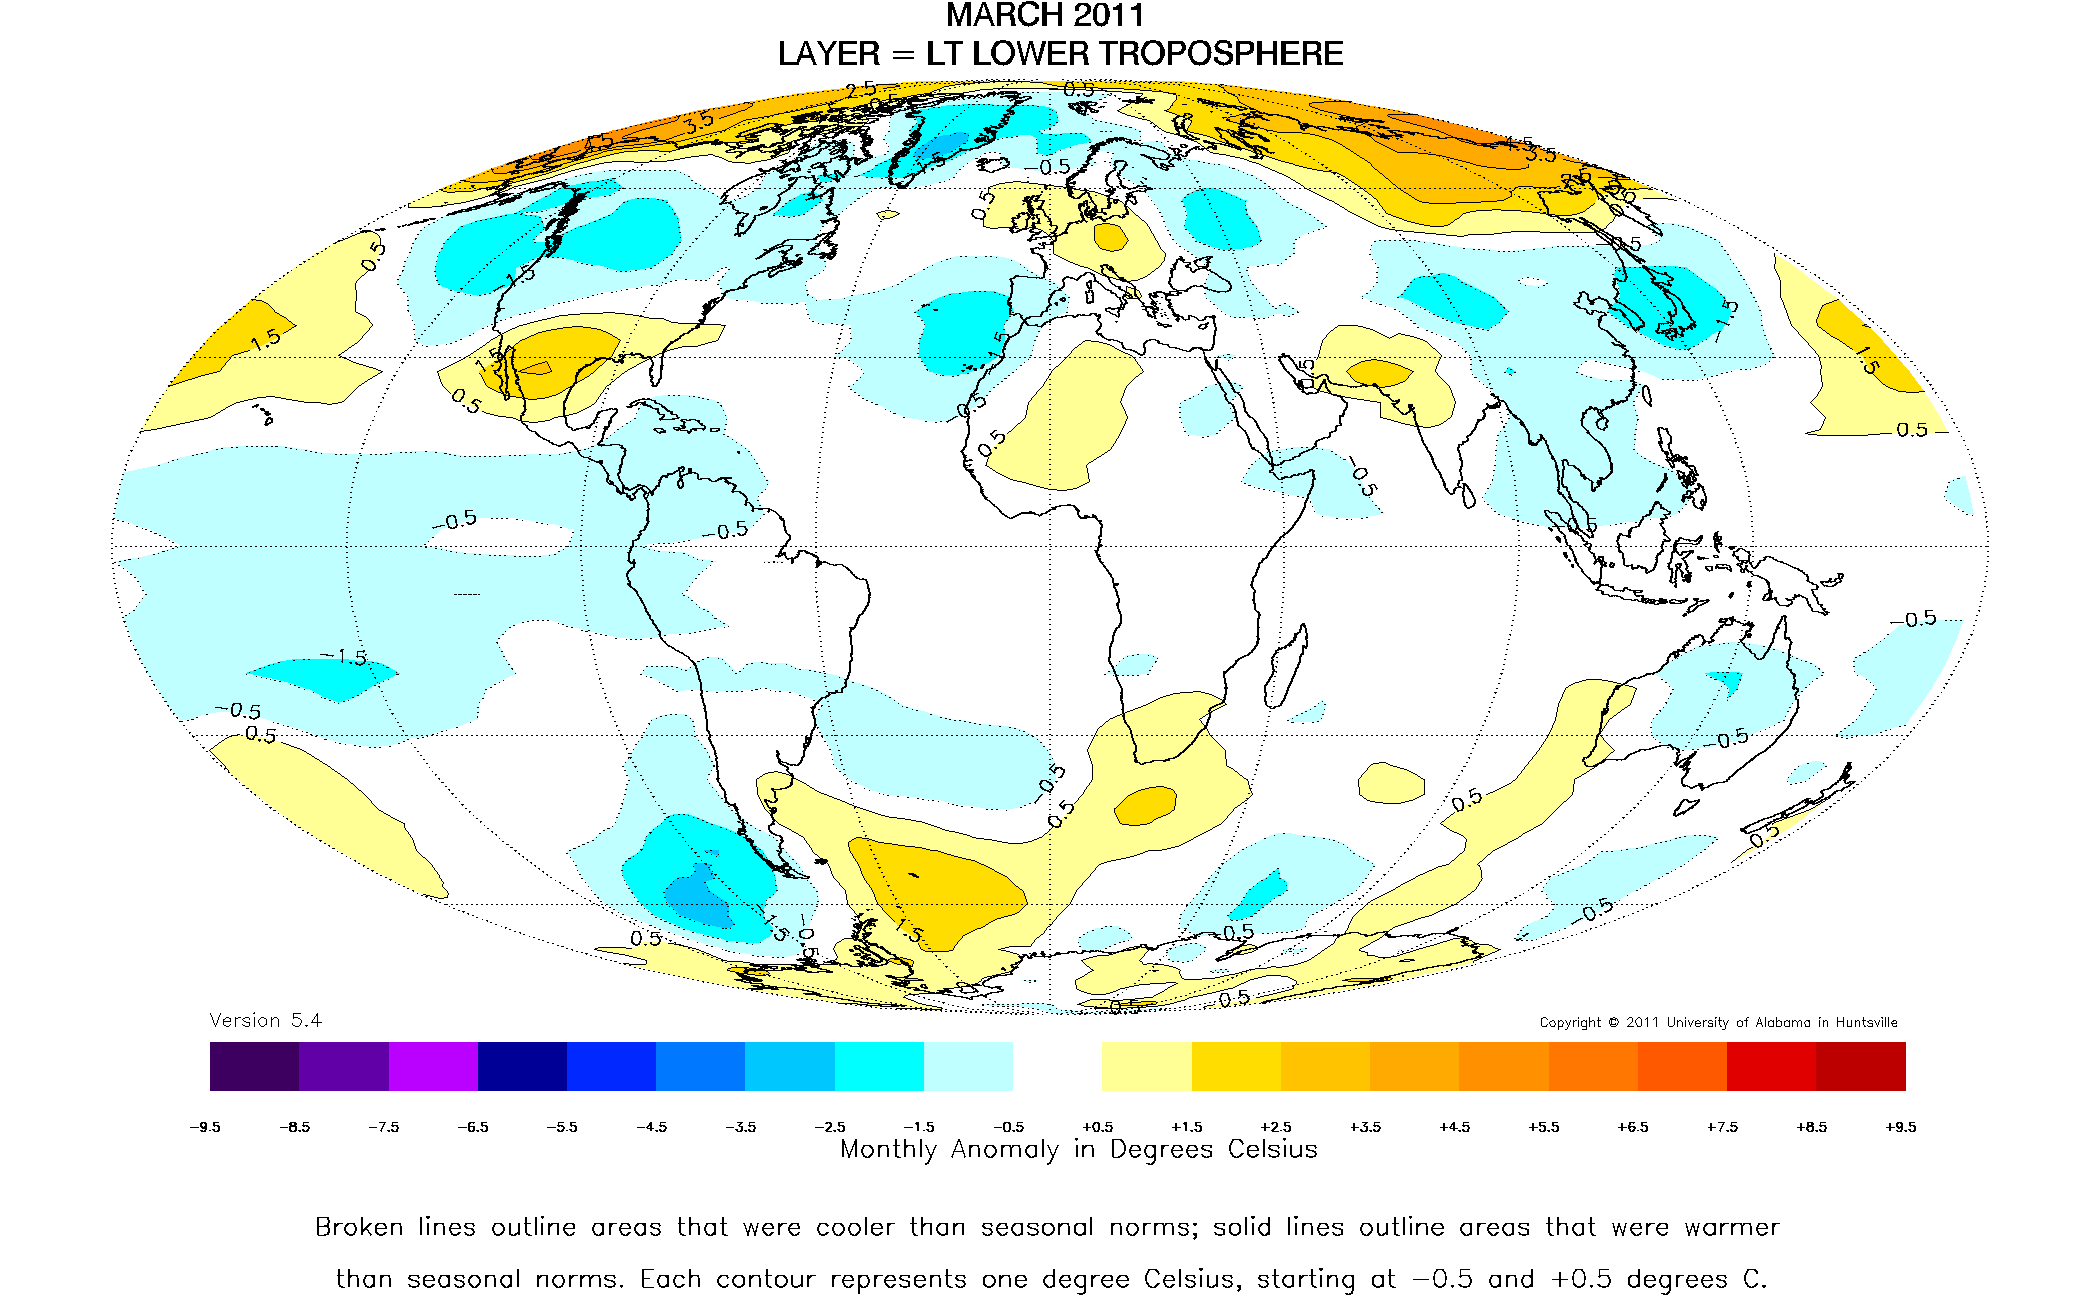
I placed a red circle below for Danmarkshavn on the UAH March TLT map, which shows anomalies realitive to the 1981-2010 mean. UAH shows an anomaly of more than 1C below normal.

So why is GISS showing Danmarkshavn with a +2.4C anomaly for the same time period using the same baseline? A 3.4C discrepancy in the anomaly is huge. Could it be UHI?

It’s hard to draw any huge conclusions from any one station. Local quirks, exposure, even bad calibration can come into play. It is probably not wise to recognize huge temperature gradients in areas where data is sparse.
Why don’t GISS put more thermometers around Greenland?
That would mean doing actual science with actual observational data at an appropriate resolution (say sensor stations on a 10km or 50km or 100 km grid across Greenland and all other land masses on Earth) which would prevent the ease to which they can now fabricate data, plus it would divert cash from them to equipment and it’s ongoing operation and maintenance. Too many serious problems for them to actually try being scientists dedicated to the actual facts on the ground.
GISS Cherry Picks stations from NCDC which uses their own secret selection method of the “Best” stations to arrive at their conclusion.
By the time they assume everything surrounding it is warmer…
….then blend that
I think these two temperatures are for different things. The UAH is a satellite derived temperature for a given pressure altitude; not a surface temperature. The GISS temperature is alleged to be a surface temperature. This may be an apples to oranges comparison.
Ahh,… so it is a different kind of temperature.
Much of Greenland is over 8,000 feet, so the 14,000 foot TLT temperatures are far more realistic than the very sparse UHI contaminated sea level data Hansen uses.
Much of Greenland is over 8,000 feet
Yes, Steve, but Danmarkshavn isn’t located at 8000 feet. It’s pretty close to sea level as far as I know.
I get it now. The likely UHI affected maritime station at one location at sea level represents the entire northern half of the island, most of which is at high altitude and located on the ice sheet. Brilliant. You close your eyes and have faith in that station instead of the thousands of satellite readings taken at altitude.
(touching the tip of my nose… pointing at SG)
That’s exactly it.
Although Crashex and I are probably on the same side, I still feel the need to give out some high fives, and take a victory lap.
Please excuse the tap dance on your ego. It’s nothing personal.
Steve
Are you having trouble understanding the issue. I believe there is (or may be) a discrepancy between GISS and UAH during March over northern Greenland which is due to measurement at different altitudes. This is NOT the issue.
You imply this is solely an issue with GISS. IT ISN’T . Several other weather related sites report that Danmarkshavn had a SURFACE mean temperature in March of -20.3, i.e. exactly the same as GISS. This inclues on of the sources you cited in another thread, i.e Wunderground. Other sites report that the ‘normal’ mean temperature for March at Danmarkshavn is -23 deg C. In other words the SURFACE temperature during March 2011 at Danmarkshavn was, according to all met sources I could find, 2-3 deg warmer than ‘normal’.
Are you saying
1. ALL sources for Danmarkshavn March SURFACE temperatures are wrong.
2. Just the sources I have found are wrong (including the one you cited in your original UAH v GISS post).
If your answer is 2 could you cite a source which disagrees with the GISS (and other) temperature readings.
Yes you are having serious problems.\understanding the issue. GISS doesn’t have any stations at altitude. Most of Greenland is at altitude. GISS has a very sparse network which is probably affected by UHI. Satellite data has broad coverage. The GISS numbers are dead wrong.
So the Wunderground numbers are wrong are they?
I just need to check what you’re saying. I need to eliminate that this is an issue with GISS before proceeding.
The wookie defense.
If your answer is 2 could you cite a source which disagrees with the GISS (and other) temperature readings.
And please don’t bother citing UAH – we’ll look at that when you’ve decided that GISS has reported the SURFACE station temperatures correctly.
So why is GISS showing Danmarkshavn with a +2.4C anomaly for the same time period using the same baseline? A 3.4C discrepancy in the anomaly is huge. Could it be UHI?
What?? Have you given this any thought at all? If Danmarkshavn is affected by UH then the 1981-2010 normal will be affected by UH – or are you saying that there is a UH effect which only affects certain months such as March 2011 for example.
Interesting you raise the UH point at a time when the surfacesations study has just been released and concluded that US temperatures are not affected by any siting bias.
Steve
Apart from the fact that you’ve shifted your original argument (quite considerably) I’ve looked back at your other responses and note that none of your arguments are valid.
1. I have shown that the Danmarkshavn March 2011 surface temperatures reported by GISS are correct. This is supported by multiple sources. You haven’t actually conceded this point but this recent post suggests you accept the GISS observations are correct. Some progress, then.
2. I have also shown that further north across Greenland anomalies were ‘warmer’ than even Danmarkshavn. I used the Nord Ads (orAws) station to show this. You rejected the use of Nord Ads on the grounds of “missing data”. The Nord Ads record is incomplete, but there is sufficient data (GISS) to calculate a 1981-2010 mean temperature. There are 21 out of a 30 possible readings (70%) which is more than enough to provide a reasonable estimate of the mean. Put it this way if every missing March value up was equal to the maximum march temperature up until 2010 (a highly unlikely situation) the 1981-2010 mean temperature would be -28.7 deg C or about 1.3 deg higher than the calculated GISS mean. The March 2011 mean temperature was -24.6 (verified by multiple sources) which is +4.3 deg above the ‘best case scenario normal’. In fact it’s more likely nearer +6 deg above normal. Independent sources give the 1981-2010 March mean temperature as -31 deg C.
3. GISS estimates the March mean temperature region above 80 deg N at ~+5deg C above normal – almost exactly in line with DMI.
Don’t you think it’s about time to give up on this, Steve? That way we might be able to investigate why the UAH (LT) ‘warm’ region starts further north than the surface ‘warm’ region. I think, though, I can say without too much doubt that it has nothing whatsoever to do with the UHI effect.
I understand. UAH and RSS are wrong about northern Greenland. Temperatures were not 1C below the 1981-2010 mean, rather they were 4C above the 1981-2010 mean. One UHI contaminated maritime station at sea level proves it. You have faith in GISS and no facts will change your mind.
Steve
Can we take this slowly because I feel you may be missing the point. Let’s leave UAH and RSS aside for
just a moment. You’re saying that one or the other must be wrong whereas I don’t think either is necessarily ‘wrong’. Danmarkshaven is at an elevation of ~36 feet not 8000 feet nor 14000 feet. Can we simply establish for the time being that the surface temperature readings at Nord Ads (81 deg N) and Danmarkshavn (76 deg N) are what they are, i.e. accept the reports from a number of sources which suggest that the March temperatures at those 2 distinct locations are, for whatever reason, a few degrees above normal.
There is no question that the GISS Danmarkshaven graph shows increasing temperatures over the last 30 years.
stevengoddard says:
May 13, 2011 at 12:06 pm
The wookie defense.
That’s not an answer. Either you’re interested in getting to the bottom of this issue or you’re not. Which is it?
The bottom of this issue is that GISS shows northern Greenland well above normal, when it was actually below normal.
stevengoddard says:
May 13, 2011 at 12:22 pm
There is no question that the GISS Danmarkshaven graph shows increasing temperatures over the last 30 years.
But, as far as I can tell from this, RSS also has increasing temperatures over Northern Greenland.
http://www.remss.com/msu/msu_data_description.html#msu_amsu_trend_map_tlt
Looks to be about 0.4 deg per decade since 1979.
stevengoddard says:
May 13, 2011 at 12:34 pm
The bottom of this issue is that GISS shows northern Greenland well above normal, when it was actually below normal
Well there was a discrepancy between satellite and surface but I’m trying to establish whether this is a short term blip or a consistent feature. If it’s a blip (and it looks very much as though it is) then it doesn’t matter. It’s a case of ‘swings and roundabouts’, i.e. there will be times when GISS will be relatively cooler than UAH/RSS and vice versa.
I think that northern Greenland at around sea level was warmer than normal in March. I think it might well have been colder than normal in the LT.
Now then, your next point might be that the satellite readings are more representative over Greenland than the surface temperatures and that is quite possibly the case. However, I still expect GISS to track the satellite trends quite closely.
Remember – from a GW perspective – it’s the Trends we are interested in, i.e. how much has it warmed over a given period.
It’s not possible that there will only be warming at at Greenland weather stations and nowhere else so GISS is unlikely to introduce a spurious trend over the long term. The GISS trend for Danmarkshavn since 1982 is 0.5-0.6 deg per decade. I said above that the RSS trend looks to be a ~0.4 deg per decade but it’s a bit hard to tell. There’s fair bit of reddish-brown in the general area of Greenland but you’d need to get actual numbers or a better resolution plot at least before reaching any conclusion.
Yes, we know that Greenland went through a period of warming from 1980-2010 which was very similar to the period between 1920 and 1950.
You may (or may not) have noticed that I have not once mentioned any reason for warming. I am simply responding to your complaints about the surface record.
Anyway, back to business, have you checked the April numbers to see if the ‘discrepancy’ has continued?
You are mistaking me for somebody else. I was complaining about the fact that the GISS March map is wrong for Northern Greenland, which it is.
The April map is pretty messed up to. http://stevengoddard.wordpress.com/2011/05/13/giss-vs-satellites-in-paraguay/