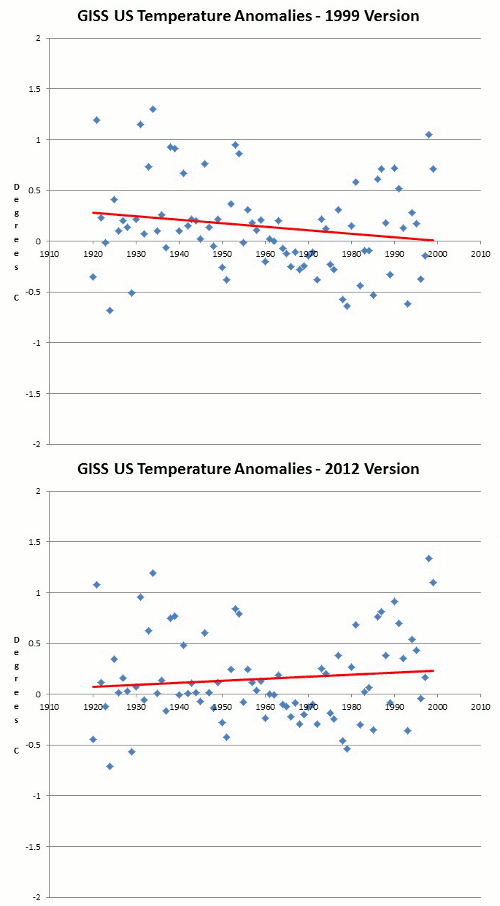
Until about ten years ago, NASA showed the US on an 80 year long cooling trend, with the three hottest years being in the 1920s and 1930s. They have deleted the raw data from their website and blocked archiving, but John Daly captured it. It was originally located at this link :
http://www.giss.nasa.gov/data/update/gistemp/graphs/FigD.txt
and can now be seen here :
http://web.archive.org/web/20120124014257/http://www.john-daly.com/usatemps.006
NASA has since rewritten US history and shows the same period warming – with 1998 as the hottest year.
data.giss.nasa.gov/gistemp/graphs_v3/Fig.D.txt
James Hansen wrote this in 1999, before he decided to alter US history :
Empirical evidence does not lend much support to the notion that climate is headed precipitately toward more extreme heat and drought. The drought of 1999 covered a smaller area than the 1988 drought, when the Mississippi almost dried up. And 1988 was a temporary inconvenience as compared with repeated droughts during the 1930s “Dust Bowl” that caused an exodus from the prairies, as chronicled in Steinbeck’s Grapes of Wrath.
in the U.S. there has been little temperature change in the past 50 years, the time of rapidly increasing greenhouse gases — in fact, there was a slight cooling throughout much of the country
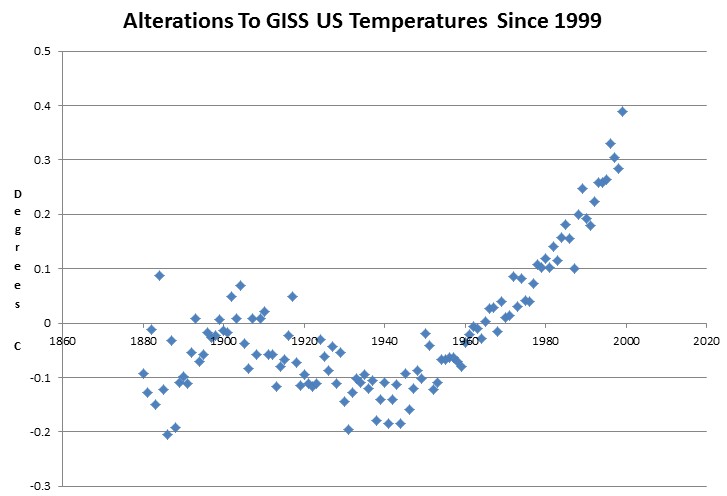
This sort of honest assessment was no use for obtaining funding, so Hansen created a hockey stick of adjustments to cool the past and warm the present.


Reblogged this on Climate Ponderings.
NASA is just doing some Equal Opportunity data “adjusting” to keep things “fair”.
It is remarkable that such recent and unidirectional, beneficial temperature adjustments can be made without insiders complaining. Don’t you think this is weird?
And you can’t “archive” data any more? How is that? If you can download it or forward it, it can be saved.
Kudos Steve. It looks exactly how I envisioned Hansen’s temperature teeter totter. This could be a Josh cartoon and I’m wondering who should we put on each end of the teeter totter?
Surely Hansen is now passed the tipping point and should be brought to justice?
Steve,
FYI John-Daly.com has been suspended. I inquired over at Jo Nova and she says John’s wife passed away last year, so it is possible the site will no longer be available.
Also, Giss is now starting to include model reanalysis data to fill in missing values. Giss just gets shoddier and shoddier as time passes.
I put up a comment about it a couple days ago at CA. It got mis-placed time-wise in the thread and was off topic. Don’t know if anyone noticed it. You might be interested in reading it.
http://climateaudit.org/2013/03/19/bent-their-core-tops-in/#comment-407034
Giss makes a one sentence mention about using reconstructed data at the end of their Mar 21st update on this page.
http://data.giss.nasa.gov/gistemp/updates_v3/
Fear monger: “One thing we can all agree on is that the globe is warming. Right?”
NOT?
This is really important. And if true, there’s just nothing but puffery and bs left in the whole AGW theory, especially when you add that the IPCC claim of a causal correlation between temps & CO2 (as the IPCC claimed until c. 2004) has been shown to be false: http://www.youtube.com/watch?v=WK_WyvfcJyg&info=GGWarmingSwindle_CO2Lag
One issue, though, is I’d feel a little hesitant to link to this post as reliable proof of a claim. If I could link with full confidence to it, agw would be done. That’s why I implore you Steven to put out a more detailed step by step kind of proof at some point, with the data up front when helpful, and with quality links as needed. Then write a short book on it if you want to. $