
We have seen quite a bit of impressive climate data fraud from government agencies, and one of my personal favorites is NOAA’s Climate Extremes Indicator – which shows 2012 as being the most extreme year in US history when tropical cyclones are ignored.
U.S. Climate Extremes Index (CEI) | Extremes | National Climatic Data Center (NCDC)
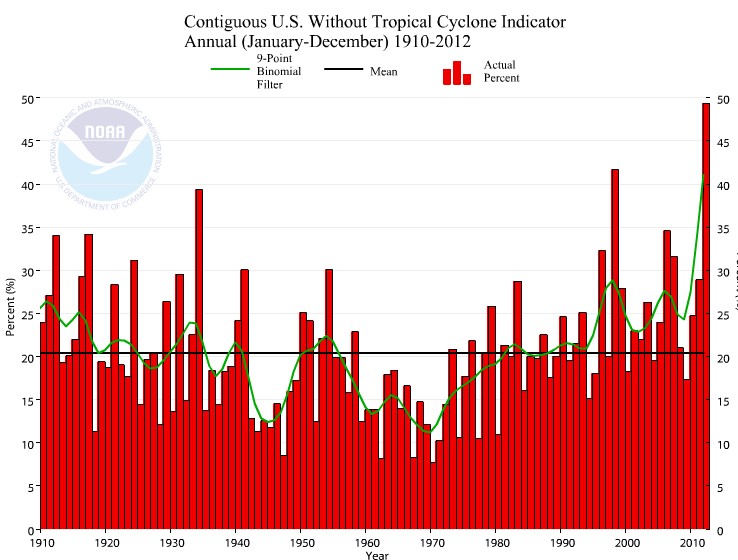
This might make a person scratch his/her head, because other than Sandy (which isn’t included in the index) 2012 had very little extreme weather in the US. The week before Sandy, Bill McKibben was complaining about the record lack of storms in 2012.
So where did the most extreme numeric come from? The winter and spring had a lot of very mild temperatures, which allowed people to play golf weeks earlier than normal. NOAA classifies lovely spring weather as extreme. And to make matters worse, they double counted all the mild days as mild afternoons and mild nights – as Paul Homewood pointed out.
The index is a piece of completely worthless junk, but a centerpiece for the Ministry of Truth. Last year probably didn’t rank in the top 10 for extreme weather in the US.

Yes, all those golf days were worse than the Galveston Hurricane of 1900 (8,000 dead), the
Tri-State tornado of 1925 (700 dead) and the Johnstown Flood of 1889 (2.200 dead) combined.
This graph shows US data, ignores Uzbekistan, Patagonia, and the South China Sea.
NOAA CEI is an indicator for the US.
Here in the UK, along with other things, Bradford MDC claimed that “Lack of snow” in winter 2006/7 was an example of “extreme weather”.
Later in the same list, they also claim that “Heavy snowfall” in 2010/11 was also an example.
http://www.bradford.gov.uk/bmdc/the_environment/climate_change/about_climate_change/climate_change_bradford_district
I wonder how much council time was wasted in making up this list.
These people are so brainwashed that they actually believe this rubbish.
Why?
Because they have been told it is so by DEFRA.
http://ukclimateprojections.defra.gov.uk/23146
Don’t forget the increasing money-flow caused by the extreme weather claims.
Sorry, I should have said that the source of the above was Paul Homewood’s blog:
http://notalotofpeopleknowthat.wordpress.com/2013/09/12/climate-change-officers-save-bradford-from-climate-disaster/