That Scribbler article is BS. The arctic is not anomalously warm. It was the coldest summer on record and there has been a lack of blocking (warmth) in the arctic so far this winter.
The BOM reckons that eastern Australia is gonna fry over summer.
Each month their three month forecast is optimistic in how hot it will be.
I expect a warm summer, like all normal summers in Australia, with a bunch of cyclones in the north. And Western Australia will always be stinking hot in summer.
“I love a sunburnt country” – Dorothy Mackellar http://www.bom.gov.au/climate/ahead/temps_ahead.shtml


To convince Dana you need 97%.
Dana considers 3% to be 97%, He is lysdexic
http://robinwestenra.blogspot.com/2013/12/climate-chaos-and-global-warming.html
Yep. This may continue.
That Scribbler article is BS. The arctic is not anomalously warm. It was the coldest summer on record and there has been a lack of blocking (warmth) in the arctic so far this winter.
The BOM reckons that eastern Australia is gonna fry over summer.
Each month their three month forecast is optimistic in how hot it will be.
I expect a warm summer, like all normal summers in Australia, with a bunch of cyclones in the north. And Western Australia will always be stinking hot in summer.
“I love a sunburnt country” – Dorothy Mackellar
http://www.bom.gov.au/climate/ahead/temps_ahead.shtml
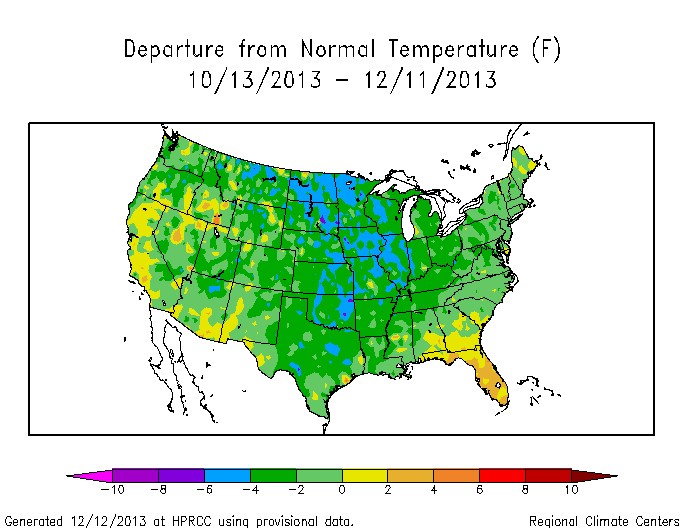
Those orange and yellow spots throughout central US are reliable indicators to
“dig here” for corrupted/unreliable temperature data.
Start with that spot on the Canadian border in North Dakota.