Steve – I think I remember you from growing up. Weren’t you the kid who liked to throw rocks at hornet’s nests and poke at poisonous snakes with short sticks?
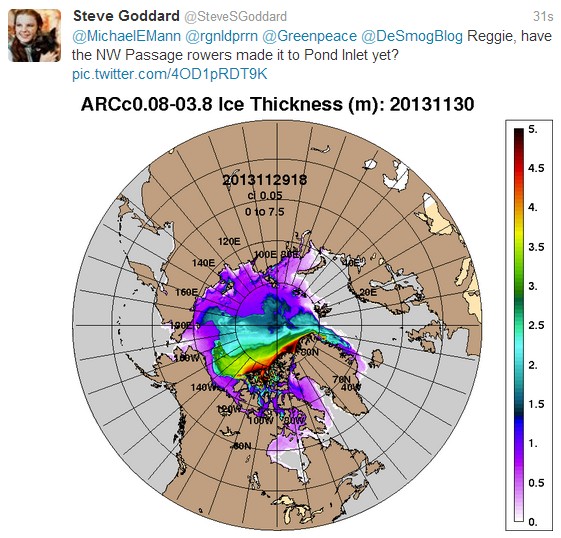
How come PIOMAS are not called out by NASA, NCIDC or a reputable meteorological organisation? Arctic sea ice extent in November varied from 9 to 11 million sq km (Average 10 x 10^^12 metres squared). Yet PIOMAS publishs their ice volume chart that shows about 6,000 cubic km (6 x 10^^12 metres squared). Simple math says they “calculate” an average ice thickness of 0.6 metres. Yet from the ARC chart you posted, there is no way the average is 0.6 metres.
The thickest MYI zone >2.5 metre (green and thicker) alone looks to have an area of 1.5 million sq km and a volume of about 4500 – 5000 cubic km.
The MYI in the light blue zone (1.25 – 2.5m) has an area of about 1.7 million sq km and a volume around 3000 – 3300 cubic km.
That leaves the remaining New Ice area of 6.8 million sq km with an average of 0.6 m thickness and a volume of around 4000 cubic km.
So the total volume ranges from 11,500 to 12,300 cubic km. or barely below the 30 yr mean value of their chart and double what their number is.
Maybe PIOMAS use the “New Math” same as ENRON, MF Global, Lehman Bros, Goldman Sachs and co use. I wonder if the IRS would like to examine PIOMAS’ accounts for the past 10 years, if they understated their finances like they understate the ice volumes.
No..they are back in Vancouver explaining that it wasn’t the ice that stopped them but Climate Change which had caused the seasons to move.
They also saw “half breed bears”…sick, terrible creations that had never occurred before (first noted about 1885) and a beaver “swimming in the Arctic Ocean”. Amazing since they were in the Beaufort Sea hugging the shore heading eastward to the Amundsen Gulf.
The Arctic Joule was apparently supposed to be blown along (not rowed?) by winds which always used to blow only from the west but now changed direction, sometimes 3 times a day. Makes you wonder why all the rowing practice never took place in the similar conditions of the Fraser River delta just 10-15 Km away from atypical English Bay and Deep Cove.


Steve – I think I remember you from growing up. Weren’t you the kid who liked to throw rocks at hornet’s nests and poke at poisonous snakes with short sticks?
No, I was the kid who showed up at school with a full deck, paid attention, and loved to write.
Hi Steven,
How come PIOMAS are not called out by NASA, NCIDC or a reputable meteorological organisation? Arctic sea ice extent in November varied from 9 to 11 million sq km (Average 10 x 10^^12 metres squared). Yet PIOMAS publishs their ice volume chart that shows about 6,000 cubic km (6 x 10^^12 metres squared). Simple math says they “calculate” an average ice thickness of 0.6 metres. Yet from the ARC chart you posted, there is no way the average is 0.6 metres.
The thickest MYI zone >2.5 metre (green and thicker) alone looks to have an area of 1.5 million sq km and a volume of about 4500 – 5000 cubic km.
The MYI in the light blue zone (1.25 – 2.5m) has an area of about 1.7 million sq km and a volume around 3000 – 3300 cubic km.
That leaves the remaining New Ice area of 6.8 million sq km with an average of 0.6 m thickness and a volume of around 4000 cubic km.
So the total volume ranges from 11,500 to 12,300 cubic km. or barely below the 30 yr mean value of their chart and double what their number is.
Maybe PIOMAS use the “New Math” same as ENRON, MF Global, Lehman Bros, Goldman Sachs and co use. I wonder if the IRS would like to examine PIOMAS’ accounts for the past 10 years, if they understated their finances like they understate the ice volumes.
Cheers
Ha ha! effin hilarious!
No..they are back in Vancouver explaining that it wasn’t the ice that stopped them but Climate Change which had caused the seasons to move.
They also saw “half breed bears”…sick, terrible creations that had never occurred before (first noted about 1885) and a beaver “swimming in the Arctic Ocean”. Amazing since they were in the Beaufort Sea hugging the shore heading eastward to the Amundsen Gulf.
The Arctic Joule was apparently supposed to be blown along (not rowed?) by winds which always used to blow only from the west but now changed direction, sometimes 3 times a day. Makes you wonder why all the rowing practice never took place in the similar conditions of the Fraser River delta just 10-15 Km away from atypical English Bay and Deep Cove.