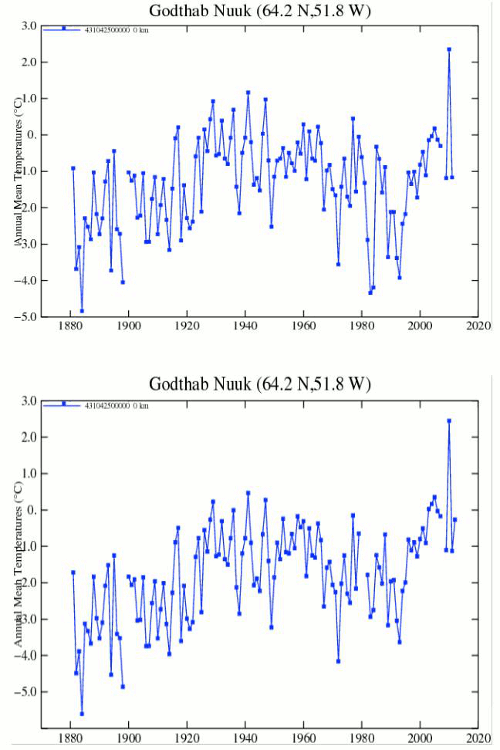
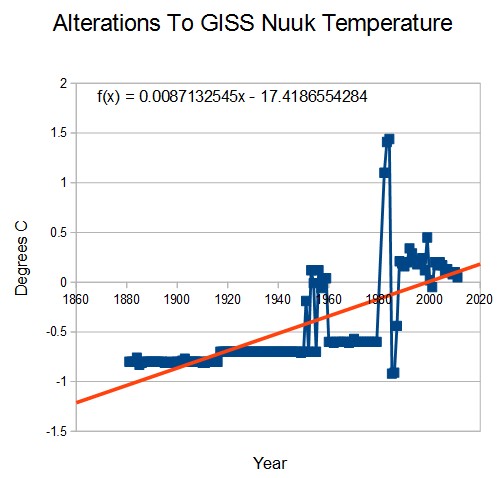
NASA’s global warming story depends on a huge amount of warming in the Arctic. They accomplish this by creating imaginary data where they have no stations, and cooling the past at the few stations they do have.
Tampered : Data.GISS: GISS Surface Temperature Analysis
Measured : Data.GISS: GISS Surface Temperature Analysis


Reblogged this on CraigM350.
I don’t understand your post. How is one measured and one tampered?- Please explain. Also please expound upon the significance of line fit graph. Thank you.
Measured is the raw data. Tampered is the data they use in their global temperature analysis. They tamper with older data to make it colder than what the thermometers actually read, and they make newer data warmer than the thermometer readings. The trend line is the fake warming trend which they have created purely by data tampering.
I would like to see the best fit line with the untampered data… I like your blog btw.
outstanding! thank you, the data speaks for itself.
Wow just wow. Superb reply!
Is there any legal vehicle through which we could sue the bastards for fraud and blow the whole charade out of the water?
The one inland station never got to freezing this year. Despite what alarmists are claiming, the 7,500 ft. thick ice sheet is not melting anytime soon.