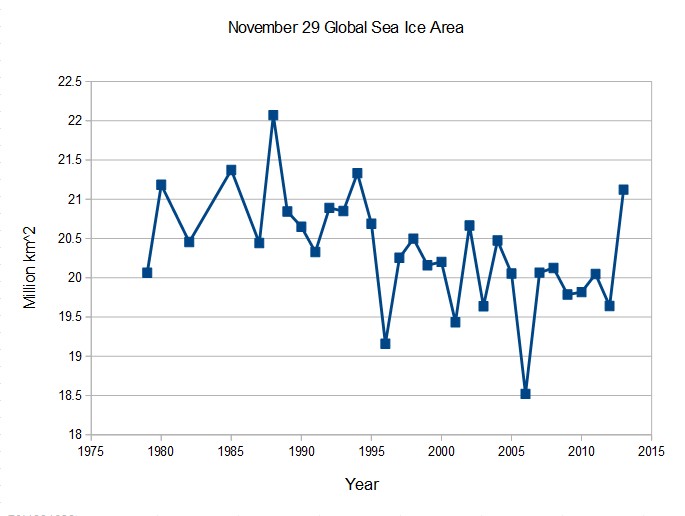
Global sea ice area increased from the 1970’s until the late 1980’s. Then it decreased until 2007, and has since grown very rapidly back to 1970’s levels. The global warming scam is on its last legs.
arctic.atmos.uiuc.edu/cryosphere/timeseries.global.anom.1979-2008


You obviously don’t watch the Weather Channel. They had a special report yesterday on how the American Navy is preparing for a melted Arctic. According to their expert presenter, the Arctic is melting at an unprecedented rate, and could be navigable all summer. My point is that the scam will continue as long as such misleading reports continue to go unchallenged.
Our military has a bad habit of preparing for, and fighting, the ‘last war’.
Our military is in the habit of preparing for and fighting whatever funds them. Seems to me that all the non-PC flag officers and colonels are getting their retirement letters. Let’s hope we won’t be as bad in 2017 as we were in 1981, but there will be a heck of a lot of weeding necessary to put real military types back in.
Based on all the predictions, the ice all melted this year, last year or the year before. All the predictions were ice-free arctic in 5 years. Quite a recovery in one year. /sarc
I think you have absurd numbers. Look at 2013. You have the year mean at something like 21.2.
Look here:
http://arctic.atmos.uiuc.edu/cryosphere/IMAGES/global.daily.ice.area.withtrend.jpg
Only 44 days of the year 2013 the global ice was above 21.2 MKm^2. From 2013.7781 on.
The true graph is this one:
http://plazamoyua.com/2013/03/04/graficos-varios-de-calentamiento-global-actualizados-a-febrero-2013/
2013 is the 15th highest from 34.
Any year you choose you will see similar problems. None of the yearly means have so much ice in the data.
Are you looking for the stupid comment of the day award?
OK thanks. November.
Yes, looking for the award. 😉
But I’ll give you the award for the most interesting climate post of the year. 5th highest global november ice!!! Just great.
Sorry, this graph.
http://plazamoyua.files.wordpress.com/2013/03/hielo-marino-global-nov-2013-abs2.png
“… You have the year mean at something like 21.2…”
He’s talking about November mean, not the yearly mean.
Besides, the sea ice anomalies have been steadily increasing throughout the year, and even in 2012, due to Antarctica mainly.
Therefore, the comparison at the beginning of the year would probably be not so favorable to 2013, and the yearly mean would reflect that.
The trend upward continues in Antarctica and now the Arctic ice is showing *remarkable* recovery with the *real possibility* of being the greatest of this century (I know it’s only 14 years) in the months ahead.
I believe that’s the meaning of Steve’s post, it’s a summary of the present abnormal high speed of increase of the sea ice *everywhere*.
The cause of all this “sudden” acceleration, especially in the Arctic, IMO is the Sun.
Even with the extreme low levels of Arctic ice in 2007 and 2012, the trend upwards after 2005 is quite evident.
… trend upwards after 2006 is quite evident.
it went up then down then up (yawn!). How many billions have been spent studying this non-event?