
Disrupting the Borg is expensive and time consuming!

Google Search
-
Recent Posts
- Analyzing The Western Water Crisis
- Gaslighting 1924
- “Why Do You Resist?”
- Climate Attribution Model
- Fact Checking NASA
- Fact Checking Grok
- Fact Checking The New York Times
- New Visitech Features
- Ice-Free Arctic By 2014
- Debt-Free US Treasury Forecast
- Analyzing Big City Crime (Part 2)
- Analyzing Big City Crime
- UK Migration Caused By Global Warming
- Climate Attribution In Greece
- “Brown: ’50 days to save world'”
- The Catastrophic Influence of Bovine Methane Emissions on Extraterrestrial Climate Patterns
- Posting On X
- Seventeen Years Of Fun
- The Importance Of Good Tools
- Temperature Shifts At Blue Hill, MA
- CO2²
- Time Of Observation Bias
- Climate Scamming For Profit
- Climate Scamming For Profit
- Back To The Future
Recent Comments
- Bob G on Analyzing The Western Water Crisis
- Bob G on Analyzing The Western Water Crisis
- Bob G on Analyzing The Western Water Crisis
- Hank Phillips on Analyzing The Western Water Crisis
- Hank Phillips on Analyzing The Western Water Crisis
- Hank Phillips on Analyzing The Western Water Crisis
- Hank Phillips on Analyzing The Western Water Crisis
- Bob G on Analyzing The Western Water Crisis
- conrad ziefle on Analyzing The Western Water Crisis
- Bob G on Analyzing The Western Water Crisis
The only data to use is the raw data. And even then we must be carrfull becaus even that cane and will be fishi so to speak.
Steve if any one cane do something like put togetter a raw data grap you would be the man to do it. Then also we now what the real climate is.
They also shut down a lot of the weather stations that showed cooling /and are rural as a “cost cutting measure.” Yeah, you can look back 100 years of unadulterated data – but then you will only see the data from the non-closed weather stations.
Except in specific cases with known, describable and explained variation, data should not be altered or adjusted. Any data “adjusted” needs to have a clear explanation of why it was changed and by what process. Lastly, all data, charts, etc., need to have appropriate error bars assigned.
Lacking those things, you get institutions like NOAA pretending to output scientific findings. NOAA is no more believable than the so-called economic reports issuing from Washington.
THANK YOU STEVE FOR REAL SCIENCE!
CryoSat Satellite Finds Arctic Ice Increased 50% in Volume
http://www.breitbart.com/Big-Peace/2013/12/17/CryoSat-Satellite%20-Findings-Arctic-Ice-Increase
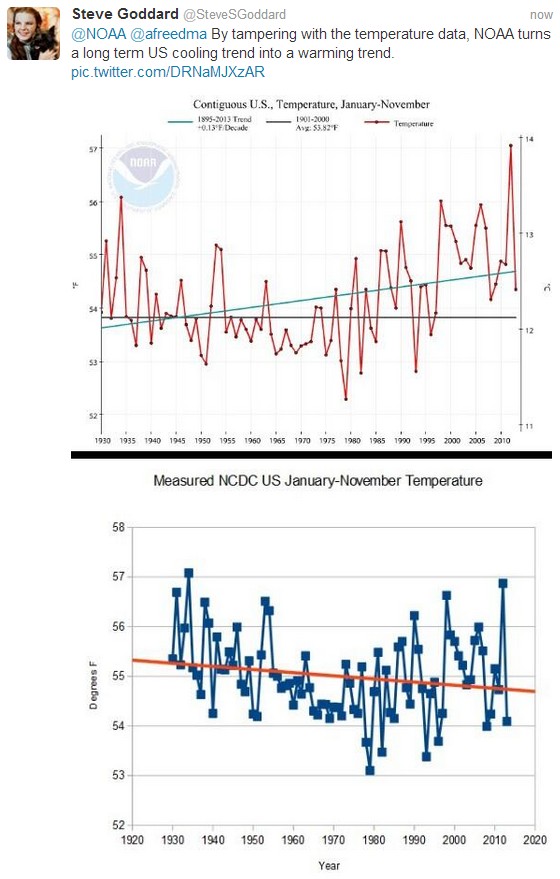
The striking part of the chart was the cold of the late 1970’s. Aside from that, there is very little change. There is absolutely no sign of significant warming.