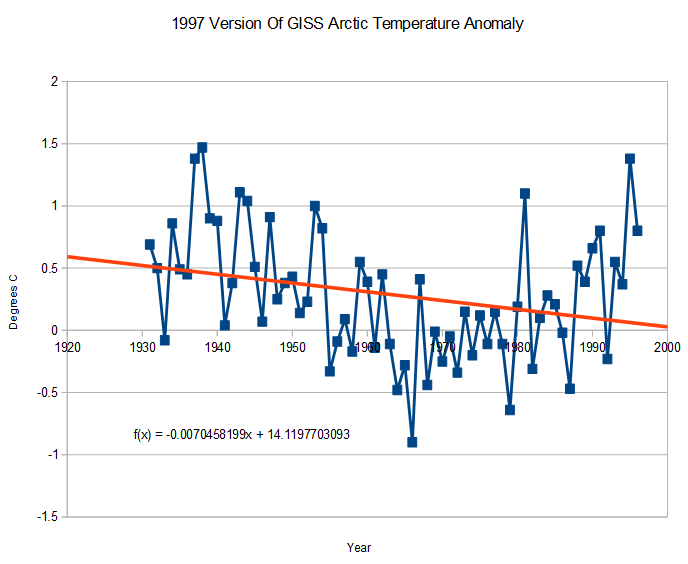
In 1997, GISS showed the Arctic cooling since the 1930’s
Archived 1997 version : www.giss.nasa.gov/Data/GISTEMP/ZonAnn.Ts.txt
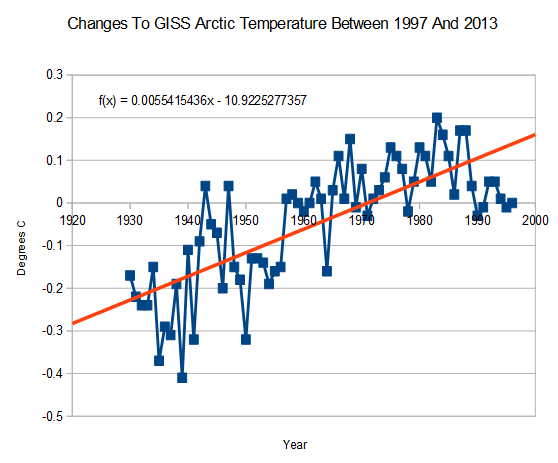
But GISS fixed that inconvenient warm period, by cooling the 1930’s Arctic 0.4ºC
Current version : data.giss.nasa.gov/gistemp/tabledata_v3/ZonAnn.Ts.txt
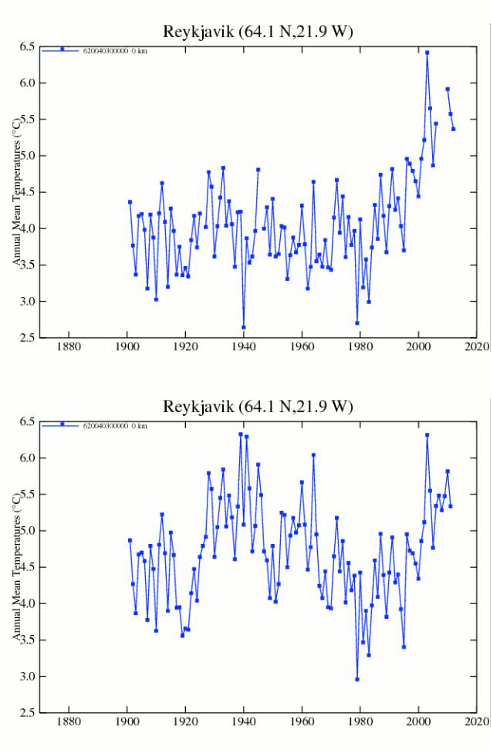
Some of their more impressive work eliminating 1930’s Arctic warmth was done in Iceland


GISS altered EVERY Icelandic station they use.
GISS fraud of Holar Hornafirdi, Iceland.
http://www.flickr.com/photos/7360644@N07/11243965324/
GISS fraud of Teigarhorn, Iceland
http://www.flickr.com/photos/7360644@N07/11244199504/
GISS fraud of Akureyri, Iceland
http://www.flickr.com/photos/7360644@N07/11244417413/
GISS fraud of Keflavik, Iceland
http://www.flickr.com/photos/7360644@N07/11244423904/
GISS fraud of Stykkisholmur, Iceland
http://www.flickr.com/photos/7360644@N07/11244518635/
GISS fraud of Thorshavn, Faeroe Islands.
http://www.flickr.com/photos/7360644@N07/11245505326/
Time travel at Grimsey, Iceland.
Interestingly, CRUtem3 and GISS show the same 5 year data shift for Grimsey, Iceland.
http://www.flickr.com/photos/7360644@N07/11243544765/
http://www.flickr.com/photos/7360644@N07/11243544705/
This is disgusting… How the @@@@ can they not be called out on this garbage?? Does anyone know I’d the original data is still publicly available??
The Iceland station data is available from the Iceland Met Office:
http://en.vedur.is/climatology/data/
GISS data for Iceland region
http://data.giss.nasa.gov/cgi-bin/gistemp/find_station.cgi?dt=1&ds=14&name=&world_map.x=335&world_map.y=61
Thanks for the graphics! I may borrow these if you do not mind.
@ gator69 Of course, no problem
Even the berserker Berkeley Earth Surface Temperature algorithm is quite happy with Reykjavik, leaving it off its bloody chopping block:
http://berkeleyearth.lbl.gov/stations/155459
**Steve, you need to see this**
Frank Lasner has done some interesting work that make explain that.
http://hidethedecline.eu/
Reblogged this on CACA.
Sleepalot and gator69
The v1 GISS NASA data for individual w/stations has been archived and access denied.
But here’s another example (Jan Mayen) using GISS v1 and GISSv4.
V1 – raw temps
http://data.giss.nasa.gov/cgi-bin/gistemp/show_station.cgi?id=634010010003&dt=1&ds=1
V4 – adjusted temps
http://data.giss.nasa.gov/cgi-bin/gistemp/show_station.cgi?id=634010010000&dt=1&ds=14
Hope they still work.
@ Ian Yes, I confirmed it by comparison with the CRUtem3 version.
How are you able to link to GISSv1 if they’ve hidden it?
For some stations you can by adjusting the web address in the address bar. Doesn’t always work but you can see from the ones above what the changes are. You have to fiddle around a bit because some changes aren’t always the same.
It looks like the first chart is temperature and the second is change in temperature. At least that is how they are labelled above. If so, then they are consistent with each other.