It is very laughable that NOAA has an “Information Quality” program. In the Information Quality Overview document at that site it says the following:
‘Any affected person, defined as “an individual or entity that uses, benefits from, or is harmed by the disseminated information at issue,” may file a request for correction (RFC) of that information. The agency will provide a response to the RFC, usually within 60 days of receipt. The requester may file an appeal of the agency’s initial denial of a request for correction.’
Has anyone ever tried filing an RFC for the temperature data?
The international airport nearest me began its development in the 1890’s as an airfield for dirigibles, and when it received its first paved runway in the 1930’s, it was still far from the city and surrounded by farms. It now sits in the middle of one of the largest metropolitan areas in the US, and yet needs upward adjustments for modern temperature data. Funny that.
I guffaw when they claim it is due to time of observation bias (TOBs)
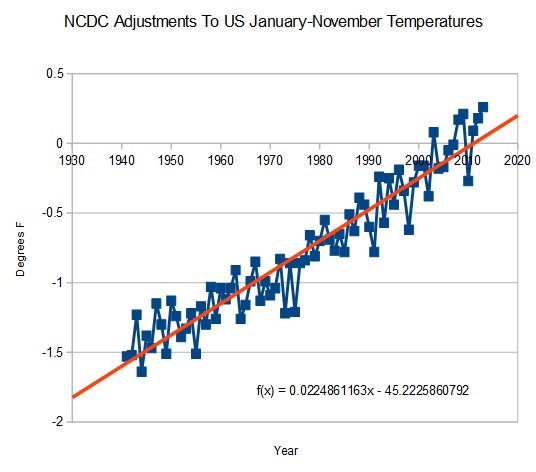
If it was true, then our ancestors got less biased as each year passed. They were lazy at first, but then decided to recprd temperature readings a little bit closer to the actual time of record.
Subsequent generations said, “Not only will I be less biased than my Dad, but when I’m frail and 80, I’m gonna be more accurate than when I was fit and 30!”
According to the graph, the only year anyone knew how to read a thermometer was 2000, because now, we are biased the other way.
“Six’s thermometer is a registering thermometer which can record the maximum and minimum temperatures reached over a period of time, for example 24 hours. It is used to record the extremes of temperature at a location, for instance in meteorology and horticulture. It was invented by Englishman James Six in 1782; the same basic design remains in use.”
It certainly does seem suspicious that the largely unexplained “adjustments” to old dataalways seem to conveniently support the ideologies of the people doing the adjusting. It’s like the weather: if they don’t like the old data, wait awhile, and they’ll change it to something they like better.
The technologies for measuring and recording temperatures really didn’t change at all between 1938 and 1970. They had plain thermometers, Six’s registering thermometers (for recording daily highs and lows), and sometimes strip-chart recorders. Nor is there any reason to think that American meteorologists varied in competence significantly between 1938 and 1970. They weren’t idiots in either year, and they certainly did not habitually make errors in measurement averaging a full degree Fahrenheit!
Yet the subsequent “adjustments” which conveniently erased nearly all of the cooling trend over that period, both for the U.S. 48 States and for the entire Northern Hemisphere, were about that large, and they’ve also added warming via adjustments to subsequent years. A total of about 1.25 °F of warming has been added by adjustments to the surface temperature record for the 48 contiguous U.S. States.
It strains credulity to suppose that it is pure coincidence that the NCDC adjustments always reinforce their global warming narrative.
Thanks. So Nooa is not providing novembers cumalative non adjusted data but only the adjusted cumulative. It is hard work which you have done but using your program and getting same results proves no much. If I find out other way handle same raw data and get same kind of results it is supportive I think. And there is allways other possibilities too.
Now it looks quite strange as if most of warming has created by adjusting.
From a UK/European perspective the NOAA anomaly map for November looks odd. Here in England November 2013 was nearly 1C/2F below the 1980-2010 mean and just below the 1961-90 mean. Equally in Spain the temperature was below average – and in the ‘extremely below’ average category in the southwestern half of the country, yet the NOAA map shows Spain as having a warmer than average November?
Why January-to-November, rather than January-to-December, Steve?
BTW, two years ago I tried to get the “Climate Science Rapid Response Team” to find the reasons for the 0.7 °C of warming which has been added since 1999 to the U.S. 48-State temperature record by “adjustments.” but they were stumped: http://tinyurl.com/revstoustemp2
Note that, coincidentally, 0.7 °C is approximately equal the total 20th century global warming.


Physical Mechanism Which Can Explain NOAA’s Adjustments is called greenbacks in the pocket.
That is a very plausible explanation. Too bad it is not a justification as well!
As the lefturds would put it –
“The ends justifies the means, and the means justifies the ends”.
What about the granting of money?
and obviously, our parents and grand parents couldn’t read a thermometer either….what a joke…
It is very laughable that NOAA has an “Information Quality” program. In the Information Quality Overview document at that site it says the following:
‘Any affected person, defined as “an individual or entity that uses, benefits from, or is harmed by the disseminated information at issue,” may file a request for correction (RFC) of that information. The agency will provide a response to the RFC, usually within 60 days of receipt. The requester may file an appeal of the agency’s initial denial of a request for correction.’
Has anyone ever tried filing an RFC for the temperature data?
http://www.cio.noaa.gov/services_programs/info_quality.html
When you consider the incredible development around suburban airport stations, you have to adjust down, not up.
The international airport nearest me began its development in the 1890’s as an airfield for dirigibles, and when it received its first paved runway in the 1930’s, it was still far from the city and surrounded by farms. It now sits in the middle of one of the largest metropolitan areas in the US, and yet needs upward adjustments for modern temperature data. Funny that.
I guffaw when they claim it is due to time of observation bias (TOBs)
If it was true, then our ancestors got less biased as each year passed. They were lazy at first, but then decided to recprd temperature readings a little bit closer to the actual time of record.
Subsequent generations said, “Not only will I be less biased than my Dad, but when I’m frail and 80, I’m gonna be more accurate than when I was fit and 30!”
According to the graph, the only year anyone knew how to read a thermometer was 2000, because now, we are biased the other way.
This is why TOBS is simply BS.
“Six’s thermometer is a registering thermometer which can record the maximum and minimum temperatures reached over a period of time, for example 24 hours. It is used to record the extremes of temperature at a location, for instance in meteorology and horticulture. It was invented by Englishman James Six in 1782; the same basic design remains in use.”
Thanks for this, Steve and gator69.
It certainly does seem suspicious that the largely unexplained “adjustments” to old data always seem to conveniently support the ideologies of the people doing the adjusting. It’s like the weather: if they don’t like the old data, wait awhile, and they’ll change it to something they like better.
The technologies for measuring and recording temperatures really didn’t change at all between 1938 and 1970. They had plain thermometers, Six’s registering thermometers (for recording daily highs and lows), and sometimes strip-chart recorders. Nor is there any reason to think that American meteorologists varied in competence significantly between 1938 and 1970. They weren’t idiots in either year, and they certainly did not habitually make errors in measurement averaging a full degree Fahrenheit!
Yet the subsequent “adjustments” which conveniently erased nearly all of the cooling trend over that period, both for the U.S. 48 States and for the entire Northern Hemisphere, were about that large, and they’ve also added warming via adjustments to subsequent years. A total of about 1.25 °F of warming has been added by adjustments to the surface temperature record for the 48 contiguous U.S. States.
It strains credulity to suppose that it is pure coincidence that the NCDC adjustments always reinforce their global warming narrative.
Can you give link to data source and/or permission to use your chart image?
I have some interest about this case.
The raw data is here.
ftp://ftp.ncdc.noaa.gov/pub/data/ghcn/daily/hcn/
Adjusted data is here
http://www.ncdc.noaa.gov/cag/
My code for processing raw data is here
http://stevengoddard.wordpress.com/2012/12/29/ghcn-code/
Thanks for posting the code link again
Thanks. So Nooa is not providing novembers cumalative non adjusted data but only the adjusted cumulative. It is hard work which you have done but using your program and getting same results proves no much. If I find out other way handle same raw data and get same kind of results it is supportive I think. And there is allways other possibilities too.
Now it looks quite strange as if most of warming has created by adjusting.
From a UK/European perspective the NOAA anomaly map for November looks odd. Here in England November 2013 was nearly 1C/2F below the 1980-2010 mean and just below the 1961-90 mean. Equally in Spain the temperature was below average – and in the ‘extremely below’ average category in the southwestern half of the country, yet the NOAA map shows Spain as having a warmer than average November?
Why January-to-November, rather than January-to-December, Steve?
BTW, two years ago I tried to get the “Climate Science Rapid Response Team” to find the reasons for the 0.7 °C of warming which has been added since 1999 to the U.S. 48-State temperature record by “adjustments.” but they were stumped:
http://tinyurl.com/revstoustemp2
Note that, coincidentally, 0.7 °C is approximately equal the total 20th century global warming.
Do you have December 2013 data available?