
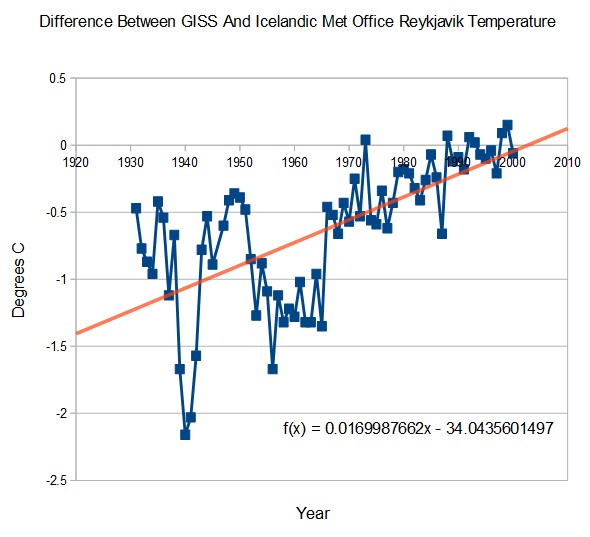
Hansen’s Schmidt’s crew at GISS have taken it upon themselves to rewrite the history of Iceland, turning a cooling trend into a warming trend.
Icelandic Met Office Data :en.vedur.is/Medaltalstoflur-txt/Reykjavik.txt
GISS tampered data : Data.GISS: GISS Surface Temperature Analysis
GISS has cooled the past at a rate of 1.7ºC per century, in support of their junk CO2 theory.

To accuse NASA of being fraudulent is serious, but unfortunately correct.
Anyone seriously interested in knowing what happened to science, will take a few minutes to read Sir Fred Hoyle’s autobiography (pages 153-154) and ask why the scientific community decided to unanimously change the internal composition of the Sun from:
IRON (Fe) in 1945 to
HYDROGEN (H) in 1946
Without discussion or debate???
Oliver K Manuel
Former NASA Principal
Investigator for Apollo
Fred Hoyle, Home Is Where the Wind Blows, published 1 April 1994.
Fred Hoyle [1] quietly “blew the cover” on pages 153-154 of his autobiography on fraudulent science (astronomy, astrophysics, cosmology, climatology, geology, nuclear, particle, planetary and solar science):
After WWII ended, science textbooks:
1. Proclaimed the Sun and other stars are made of, and burn, hydrogen, and
2. Replaced Aston’s valid nuclear “packing fraction” curve with von Weisacker’s deceptive “nuclear binding energy” curve.
Fred Hoyle, Home Is Where The Wind Blows: Chapters from a Cosmologist’s Life, published 1 April 1994.
http://www.amazon.com/Home-Where-Wind-Blows-Cosmologists/dp/093570227X
Yes, at this rate, the planet will burn up under a snowball earth.
Steve, I estimate GISS dropped 1940 by nearly 3.5C whereas you show the difference
to be about 2C. I don’t understand.
1940 : IMO 4.8 GISS 2.64
Ah, my appologies – it’s my eyes. It’s 1939 and 1941 that are “hot” on IMO.
It’s the monthly differences that really show the fraud. The follow is a difference table, IMO minus GISS (positive values are where GISS has been cooled).
j f m a m j j a s o n d
1931 0.2 0.7 0.6 0.6 0.6 0.6 0.6 0.6 0.6 0.6 0.6 0.7
1932 0.7 0.6 0.6 0.7 0.6 0.6 0.6 0.6 0.6 0.6 0.6 0.6
1933 0.7 0.7 0.6 0.6 0.6 0.6 0.6 0.6 0.6 0.6 0.6 7.2
1934 0.6 0.6 0.7 0.6 0.6 0.6 0.6 0.6 0.6 0.6 0.6 0.7
1935 0.8 0.8 0.7 0.7 0.7 0.7 0.7 0.7 0.7 0.7 0.7 0.8
1936 0.8 0.8 0.7 0.7 0.7 0.7 0.7 0.7 0.7 0.7 0.7 0.8
1937 0.8 0.7 0.8 0.7 0.7 0.7 0.7 0.7 0.7 0.7 0.7 0.7
1938 0.8 0.7 0.7 0.7 0.7 0.7 0.7 0.7 0.7 0.7 0.7 0.7
1939 0.8 0.7 2.0 2.0 2.0 2.0 2.0 2.0 2.0 2.0 2.2 2.1
1940 2.1 2.1 2.1 2.0 2.0 2.0 2.0 2.0 2.0 2.0 2.2 2.0
1941 2.1 2.0 2.1 2.0 2.0 2.0 2.0 2.0 2.0 2.0 2.0 2.1
1942 2.2 2.2 2.1 2.1 2.1 2.1 2.1 0.7 0.7 0.8 0.7 0.7
1943 0.7 0.8 0.7 0.7 0.7 0.7 0.7 0.7 0.7 0.7 0.7 0.7
1944 0.7 0.7 0.7 0.7 0.7 0.7 0.7 0.7 0.7 0.7 0.7 0.7
1945 0.6 0.7 0.7 0.7 0.7 0.8 0.7 0.7 0.7 0.7 0.7 0.7
1946
1947 0.5 0.4 0.4 0.4 0.4 0.4 0.4 0.4 0.4 0.4
1948 0.4 0.4 0.4 0.4 0.4 0.4 0.4 0.4 0.4 0.4 0.4 0.5
1949 0.5 0.5 0.5 0.5 0.5 0.5 0.5 0.5 0.5 0.5 0.5 0.4
1950 0.4 0.4 0.4 0.4 0.4 0.4 0.4 0.3 0.5 0.4 0.4 0.4
1951 0.4 0.4 0.4 0.4 0.4 0.4 0.4 0.4 0.4 0.4 0.3 0.4
1952 0.4 0.4 0.4 0.4 0.5 0.5 0.4 0.4 1.3 1.2 1.3 1.2
1953 1.2 1.2 1.2 1.2 1.2 1.2 1.2 1.2 1.2 1.2 1.2 1.2
1954 1.2 1.2 1.2 1.1 1.1 1.2 1.1 1.2 1.2 1.2 1.2 1.1
1955 1.2 1.1 1.2 1.2 1.2 1.2 1.2 1.2 1.2 1.2 1.2 1.3
1956 1.2 1.3 1.3 1.3 1.3 1.3 1.3 1.3 1.2 1.3 1.3 1.3
1957 1.3 1.3 1.3 1.3 1.3 1.3 1.3 1.3 1.3 1.3 1.3 1.3
1958 1.3 1.3 1.3 1.3 1.3 1.3 1.3 1.3 1.3 1.3 1.3 1.3
1959 1.3 1.3 1.3 1.3 1.3 1.3 1.3 1.3 1.3 1.3 1.3 1.3
1960 1.3 1.3 1.3 1.3 1.3 1.3 1.3 1.3 1.3 1.3 1.3 1.3
1961 1.2 1.2 1.2 1.2 1.2 1.2 1.2 1.2 1.3 1.2 1.2 1.1
1962 1.2 1.2 1.2 1.2 1.2 1.2 1.2 1.2 1.2 1.2 1.2 1.2
1963 1.2 1.2 1.2 1.2 1.2 1.2 1.2 1.2 1.2 1.2 1.2 1.3
1964 1.3 1.3 1.3 1.3 1.3 1.3 1.3 1.3 1.3 1.3 1.3 1.3
1965 1.3 1.3 1.3 1.3 1.3 1.3 1.3 1.3 1.3 1.2 1.3 0.5
1966 0.5 0.5 0.5 0.5 0.5 0.5 0.5 0.5 0.5 0.5 0.5 0.5
1967 0.5 0.5 0.5 0.5 0.5 0.5 0.5 0.5 0.5 0.5 0.5 0.5
1968 0.5 0.5 0.5 0.6 0.5 0.5 0.5 0.5 0.5 0.5 0.5 0.4
1969 0.4 0.4 0.4 0.4 0.4 0.4 0.4 0.4 0.4 0.4 0.4 0.4
1970 0.4 0.3 0.4 0.4 0.4 0.4 0.4 0.4 0.4 0.4 0.4 0.4
1971 0.4 0.4 0.4 0.4 0.4 0.4 0.4 0.4 0.4 0.4 0.4 0.4
1972 0.4 0.4 0.4 0.4 0.4 0.4 0.4 0.4 0.5 0.4 0.5 0.4
1973 0.4 0.4 0.4 0.4 0.4 0.4 0.4 0.4 0.4 0.4 0.4 0.3
1974 0.4 0.4 0.4 0.4 0.4 0.5 0.4 0.4 0.4 0.4 0.4 0.4
1975 0.4 0.4 0.4 0.4 0.4 0.4 0.4 0.4 0.4 0.4 0.4 0.4
1976 0.4 0.4 0.4 0.4 0.4 0.4 0.4 0.4 0.4 0.4 0.4 0.4
1977 0.4 0.4 0.4 0.4 0.4 0.4 0.4 0.5 0.4 0.4 0.4 0.4
1978 0.4 0.4 0.4 0.4 0.4 0.4 0.4 0.4 0.4 0.4 0.4 0.3
1979 0.2 0.3 0.3 0.3 0.3 0.3 0.3 0.4 0.3 0.3 0.3 0.3
1980 0.2 0.3 0.3 0.3 0.3 0.3 0.3 0.3 0.3 0.3 0.3 0.3
1981 0.3 0.3 0.3 0.3 0.3 0.4 0.3 0.3 0.3 0.3 0.3 0.3
1982 0.2 0.3 0.3 0.3 0.4 0.4 0.4 0.3 0.4 0.4 0.2 0.2
1983 0.2 0.3 0.2 0.2 0.4 0.3 0.4 0.3 0.4 0.4 0.3 0.2
1984 0.1 0.2 0.3 0.2 0.2 0.3 0.3 0.2 0.3 0.2 0.3 0.3
1985 0.3 0.3 0.1 0.2 0.2 0.3 0.3 0.2 0.2 0.3 0.2 0.1
1986 0.2 0.2 0.3 0.3 0.2 0.3 0.2 0.3 0.3 0.2 0.2 0.1
1987 0.2 0.2 0.3 0.2 0.3 0.2 0.2 0.2 0.2 0.3 0.2 0.2
1988 0.2 0.1 0.2 0.3 0.3 0.2 0.3 0.2 0.2 0.2 0.2 0.2
1989 0.1 0.1 0.1 0.2 0.1 0.1 0.2 0.1 0.1 0.2 0.2 0.1
1990 0.1 0.1 0.0 0.2 0.1 0.1 0.2 0.1 0.1 0.1 0.2 0.0
1991 0.1 0.1 0.1 0.1 0.1 0.2 0.1 0.1 0.1 0.1 0.1 0.1
1992 0.1 0.1 0.1 0.1 0.1 0.1 0.1 0.1 0.1 0.1 0.1 0.1
1993 0.1 0.1 0.1 0.1 0.1 0.1 0.1 0.1 0.1 0.1 0.1 0.0
1994 0.0 0.0 0.0 0.0 0.0 0.0 0.0 0.0 0.0 0.0 0.0 0.0
1995 0.0 0.0 0.0 0.0 0.0 0.0 0.0 0.0 0.0 0.0 0.0 0.0
1996 0.0 0.0 0.0 0.0 0.0 0.0 0.0 0.0 0.0 0.0 0.0 0.0
1997 0.0 0.0 0.0 0.0 0.0 0.0 0.0 0.0 0.0 0.0 0.0 0.0
1998 0.0 0.0 0.0 0.0 0.0 0.0 0.0 0.0 0.0 0.0 0.0 0.0
1999 0.0 0.0 0.0 0.0 0.0 0.0 0.0 0.0 0.0 0.0 0.0 0.0
2000 0.0 0.0 0.0 0.0 0.0 0.0 0.0 0.0 0.0 0.0 0.0 0.0
There’s a formatting error on 1947 – it’s Jan and Feb that are missing.
Oh, and NASA GISS can’t correctly calculate an annual average – they can be as much as 0.4 C out.
To illustrate the point, I compared CRUtem3 and GISS data for Kap Tobin, Greenland: I calculated annual averages for both sets, and they were identical. The annual averages supplied by GISS vary as much as 0.77C from
my calculated values. [Other than those wrong annual averages, GISS hasn’t (clearly) molested that data – yet.]
Interestingly, CRUtem3 and GISS show the same 5 year data shift for Grimsey, Iceland.
http://www.flickr.com/photos/7360644@N07/11243544765/
http://www.flickr.com/photos/7360644@N07/11243544705/
GISS fraud of Holar Hornafirdi, Iceland.
http://www.flickr.com/photos/7360644@N07/11243965324/
GISS fraud of Teigarhorn, Iceland
http://www.flickr.com/photos/7360644@N07/11244199504/
GISS fraud of Akureyri, Iceland
http://www.flickr.com/photos/7360644@N07/11244417413/
GISS fraud of Keflavik, Iceland
http://www.flickr.com/photos/7360644@N07/11244423904/
GISS fraud of Stykkisholmur, Iceland
http://www.flickr.com/photos/7360644@N07/11244518635/
That’s yer lot, for now. Steve, please let me know that you saw this.
GISS fraud of Thorshavn, Faeroe Islands.
http://www.flickr.com/photos/7360644@N07/11245505326/
(It comes to something when I’m using CRUtem3 as reliable! CRutem3 seems to delete data to get its desired results.)