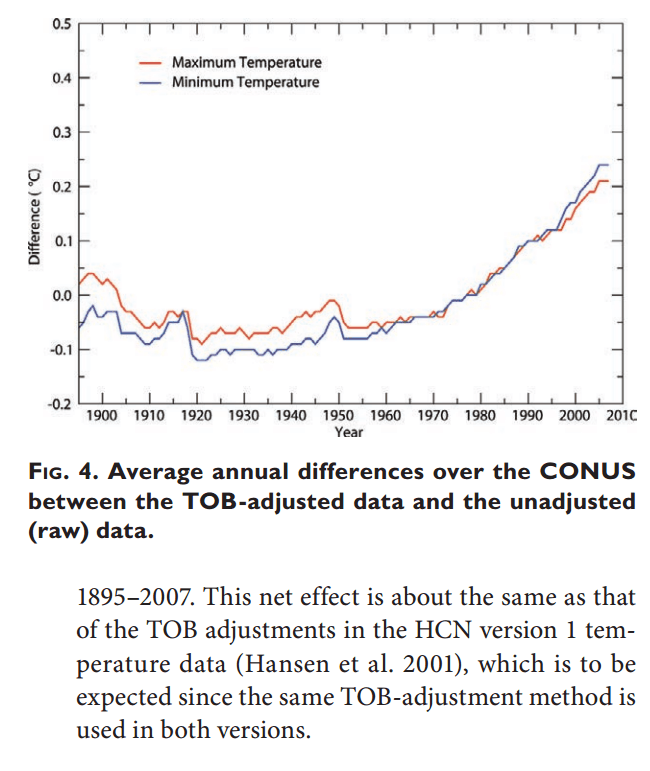
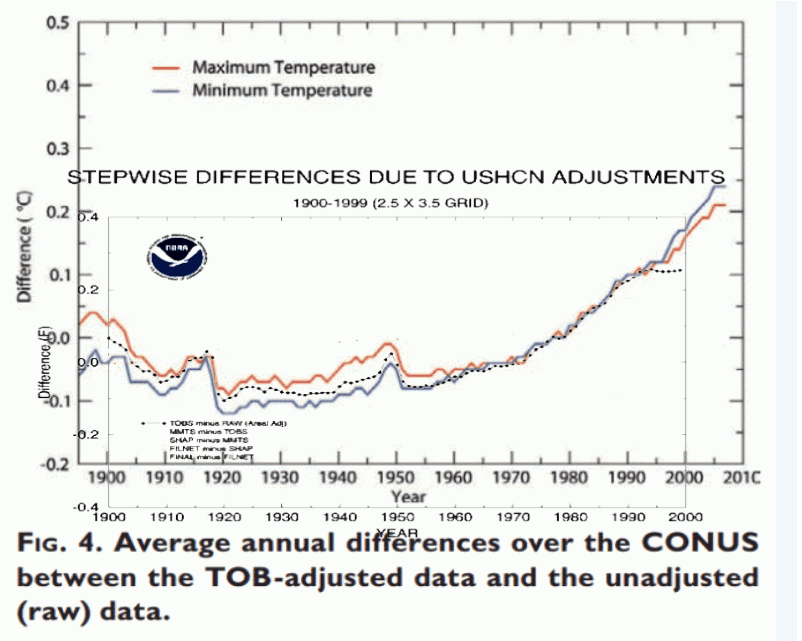
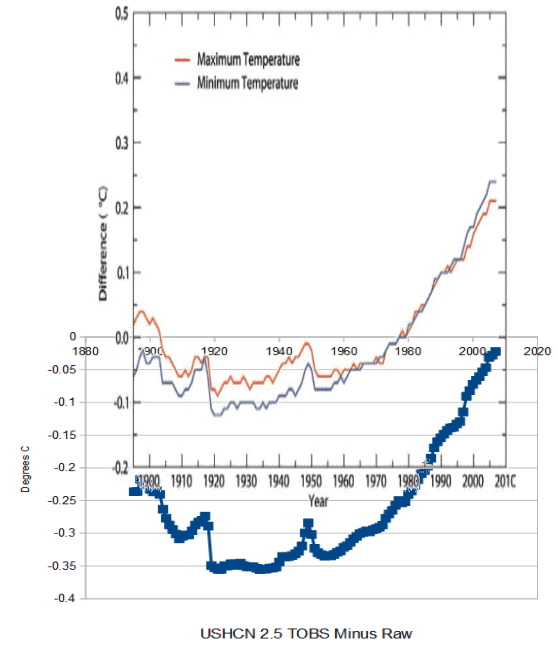
Ignoring a host of other issues about TOBS, according to USHCN V2 docs the USHCN V2 TOBS adjustment is supposed to look like this – positive since 1980, and slightly negative prior to that.
This is somewhat similar to V1 (dashed line below) except for a different offset, and a smoking gun of very different behavior after 1990.
But the actual implementation of V2 TOBS (thick blue line below) is very different from the supporting docs. The actual adjustment is about 0.2C lower than the graph in the specification (red and thin blue) lines. It is abundantly clear that their code does not correctly implement the specification.


I believe they said the earlier measurements were often done in the morning, making the temperatures cooler, relative to afternoon temps. That was fixed with the conversion to MMTS. If that’s so, the TOB correction should be toward warmer temperatures in the past and there shouldn’t be any ROB corrections after thermistors were installed, right?
The theory is that if you reset your min/max thermometer in the afternoon, you double count some high temperatures. If you reset your thermometer in the morning, you double count some low temperatures. Any operator with half a brain will figure this out after about three days and reset the thermometer at night.
Steven,
Frank Lansner and Nicolai Skjoldby have skewered the justification for TOBS adjustments.
“TOBS: For almost all countries examined, the Time of OBServation (“TOBS”) was constant from around year 1900 and fore ward. The time of observation is normally appearing in the meteorological yearbooks. Especially the decline in temperature data after around 1940-1950 seems normally not to be related to TOBS changes ”
http://hidethedecline.eu/pages/posts/original-temperatures-general-conclusions-262.php
They have the raw data for many countries. See if you can get a copy.
Its time to apply Steven Goddard to larger data sets…
Excellent analysis that confirms what I have observed regarding temperature trends in areas that do not suffer from maritime or UHI influence. After I discovered which stations were removed from the GHCN, I started looking at rural Midwestern stations and found they either showed no change, or a slight cooling over the past century. Good link!
Thanks, I never understood this. This would indeed be foolish, and would not any average person only count the maximum high, and the minimum low, and not record two of each for the day, assuming it only took a little while to reset well after the high, and long before the low, and so most always capture true max and minimum.
typo?
“It is abundantly clear that their code does correctly implement the specification.”.
Do you mean “does NOT correctly”?
TOBS? Please define.
Time of Observation”
Also, the RTD’s (Resistive thermal devices) became widely used during the mid 90’s and there are other anomalies other than UHI which have affected observation stations, primarily manufacturer issues.
From Zeke (Steven Mosher Fan)
Note** These guys don’t quantify or qualify measurement station data to well…
http://rankexploits.com/musings/2010/uhi-in-the-u-s-a/
USHCN provides three different sets of data (raw, TOB, and F52) for three different temperature readings (mean, max, and min). Raw data is the rawest of the raw; a simple monthly average mean, max, and min from each station with very basic quality control checks. TOB data is the raw data corrected for bias introduced by changes in observation times over time for a portion of the USHCN stations without hourly temperature data (e.g. primarily those in the COOP network). F52 is the final adjusted dataset that takes the TOB data as a starting point and uses an algorithm to detect step changes and other inhomogeneities in individual station data by comparing the record of each station to that of other nearby stations. The F52 data also has missing datapoints infilled from nearby stations.
Time of observation (TOB) adjustments occur primarily in stations without hourly temperature data available. These stations will tend to measure temperatures only a few times a day, and the time they measure the temperature will have a strong effect on the max and min temps recorded. If the time of observation changes over time, it can introduce a bias into the raw temperature data. Because stations record the time of observation associated with each reading, researchers can measure how the TOB changes over time. The Figure below (also from Menne et al 2009) shows the general TOB for each station by year. Immediately obvious is a dramatic shift from PM TOB to AM TOB over the past 60 years; a change which Menne et al 2009, Karl et al. 1986, Vose et al 2003, Pielke et al 2007, and numerous other papers all conclude introduces a spurious cooling bias into the temperature record.
Why don’t they just use the actual maximum and minimum temperatures – regardless of the time of observation?
That would be too logical, Jimmy.
So, from about 1940 onwards, they reckon that something was artifically causing thermometers to run too cool. But, not only that – each year the thermometers were running cooler and cooler. What magical force could be causes this annual problem? The properties of mercury changing annually, along with the laws of resistance? Amazing that nobody but trained climate scientists have cottoned onto such fundamental instabilities.
CO2 of course…
I really do not see why an am reading, taken well after the normal low, would not record both the afternoon high and the normally early am low?
Not surprising that the global warming mafia would adjust the temperature record using a study that raises modern temps and lowers historical ones. Where are the studies that lower modern ones due to UHI, which is probably 10 times more important?
They aren’t really interested in the truth or scientific accuracy at all. They do it for the cause. They do it for “our cause”, ie Cosa Nostra
Steven:
I strongly urge you to expand this finding to include a detailed explanation of exactly how NOAA has perpetuated this fraud and ask others like Anthony Watts, Marc Morano, Joanne Nova, Lucia, and Drs. Curry, Pielke Sr., & Pielke Jr. to post it on their blogs as well. I love what you post here, but this deserves the widest possible audience exposure .