Daily Telegraph – 8 November 2011 Arctic sea ice ‘to melt by 2015’
Prof Wadhams said: “His [model] is the most extreme but he is also the best modeller around.
“It is really showing the fall-off in ice volume is so fast that it is going to bring us to zero very quickly. 2015 is a very serious prediction and I think I am pretty much persuaded that that’s when it will happen.”
——- Guardian – 17 September 2012
Arctic expert predicts final collapse of sea ice within four years
“This collapse, I predicted would occur in 2015-16 at which time the summer Arctic (August to September) would become ice-free. The final collapse towards that state is now happening and will probably be complete by those dates”.
——- Financial Times Magazine – 2 August 2013
“It could even be this year or next year but not later than 2015 there won’t be any ice in the Arctic in the summer,”
——- The Scotsman – 12 September 2013 Arctic sea ice will vanish within three years, says expert
“The entire ice cover is now on the point of collapse.
“The extra open water already created by the retreating ice allows bigger waves to be generated by storms, which are sweeping away the surviving ice. It is truly the case that it will be all gone by 2015. The consequences are enormous and represent a huge boost to global warming.”
——- Guardian – 17 September 2012
“This collapse, I predicted would occur in 2015-16 at which time the summer Arctic (August to September) would become ice-free. The final collapse towards that state is now happening and will probably be complete by those dates“.
[Professor Peter Wadhams – Cambridge University]
——- Arctic News – June 27, 2012
My own view of what will happen is: 1. Summer sea ice disappears, except perhaps for small multiyear remnant north of Greenland and Ellesmere Island, by 2015-16. 2. By 2020 the ice free season lasts at least a month and by 2030 has extended to 3 months…..
it’s a lot worse than we thought…….
Recently they started counting the coast line….the ins and outs of all the bays, etc
That is the first thing to melt in the summer…and will bring the extent way down
Sorry to disappoint you, but nobody knows when “the end” will come. “But about that day or hour no one knows, not even the angels in heaven, nor the Son, but only the Father.” (Matt. 24:36). … Also, the information you want can’t be found in Revelation. Very well qualified biblical scholars say Revelation was a dramatization of the persecution of the Jews and the destruction of Jerusalem in the first century. Anyway, why would people who lived in those times want to predict disasters over 2,000 years into the future? It doesn’t make any sense. It would be like us worrying about people who might be living in the year 4014.
Okay, good point. .. I guess real prophets would have the ability to predict events in their future whether they wanted it or not! .. Maybe I should have omitted the words: “want to”, so that the sentence would be: “Anyway, why would people who lived in those times predict disasters over 2,000 years into the future?”
The HSDIC web site on Arctic Sea Ice is not yet showing the right “hook” visible in the EU chart you are showing above. Any theories or explanations why? Smoothing?
Have a look at this.Notice the icy water(very below anomaly) surrounding the WHOLE of Antarctica:
weather.unisys.com/surface/sfc_daily.php?plot=ssa&inv=0&t=cur
Arctic sea ice extent will be above average this summer (2014) for the first time since the mid-1990s, according to predictions from computer models used by the US National Oceanic and Atmospheric Administration (NOAA).
This development will be seized on by climate change sceptics as evidence that the variations in Arctic sea ice are not totally due to human-driven global warming and that natural variations may play a role.
A number of recent research papers have hinted at the importance of natural variations in the Arctic.
Don’t allow them to weasel their way out of it. Use their own words. After all, Skeptics were not the ones who invented the drama-queen phrase, “Death Spiral,” and had all sorts of ominous music playing in the background, during supposedly-scientific PBS documentaries.
Of course Skeptics are going to “seize upon” a blunder of this magnitude. Why not? Are Alarmists going to now claim that pointing out the mud all over Alarmist’s faces is bad manners?
It would be one thing if most Alarmists had ever displayed the slightest iota of good manners towards Skeptics. (Maybe a few did, but they stood out as exceptions to the rule. I will display decency and courtesy towards those few.) The rest? I will “seize upon” and “seize upon” and “seize upon,” grinding the magnitude of their folly into their foolish faces.
Hey Caleb! “Don’t allow them to weasel their way out of it. Use their own words.”
Yes, exactly — and they WILL try to weasel out. That is one reason why I always stress “CAGW” and tell them that their alarmism is based on four points. They claim that the changes are catastrophic, that they are man made, that they are global in nature, and that it is warming (not merely changing cycles). If they back down from any of those claims, then their whole plan of “Let’s destroy Western Civilization” falls apart.
I listen to you (Caleb) as someone who knows a lot more than the self proclaimed Government experts. They have been blundering for the last 30 years. If they were financial advisors, they would have been out of business long ago.
This development will be seized on by climate change sceptics as evidence that the variations in Arctic sea ice are not totally due to human-driven global warming and that natural variations may play a role.
A little help please – Can anyone direct me to a source of historical daily precipitation for all the stations within a given Indiana county? I tried google and some links above, but USHCN gives me an error. I don’t need the raw data, just the output of precipitation by date and station from as far back as possible to present.
I’m fighting “the man” and trying to show that a rain/flood event in 2003 was a 100 yr event. They put my property in the flood plain 5 years after our home was built, so I get to pay flood insurance, which reduces my property value by at least $50,000.
The Indiana Department of Natural Resources does the flood mapping here for FEMA. After a big 2003 flood/precip event, I called the DNR and said all the media and government officials are reporting that this was a 100 yr flood, maybe a 500 yr flood, so you need to remove my property from the 100 yr flood plain because our home did not flood. Unbelievably, the DNR said, “it is not possible that it was a 100 yr flood at your house, because if it was, our model shows that your house would have flooded”. I kid you not, models trump observation, similar to global warming. It’s extremely frustrating.
I’ve been trying to fight it for 10 years, but it’s one dead end after another. The flood insurance is added to the mortgage. You have no choice but to pay it. My neighbor is in the same situation, but he is trying to sell his house. He had his house sold for his asking price until the lender added mandatory flood insurance to the mortgage, and the buyer backed out. The seller dropped his price by $50k, but the buyer said no thanks. These aren’t mansions on the ocean. These are average priced homes a half mile from a small creek.
Thanks, and sorry for the OT, but I’m not sure where to turn.
I would also consider studying some of the area topographic maps for your area, to get a mental idea how your property is situated with respect to local ‘watersheds’. I am not familiar with the 2003 flood event up there, but we can get rains here in Texas that can be somewhat ‘localized’ and create problems for some folks and not others.
PS. I just checked the USGS website and for some reason it seems to be down … probable outage for service on a Sunday vs a weekday I would reckon.
We are a half mile from a large river. I got the large printed Topographic map from USGS and a survey of the property and took them both to the local (200 miles away) office of the USGS and had a geologist mark the actual 100 year flood plain on the topo map and on my survey. He added a letter and stamped the drawing. It shut up the planning board but they still would not allow a basement. (I am on a ridge 100 feet above the flood plain.)
Good luck. That was done back in 1994 before CAGW was such a major football.
There is a Death Spiral. It is the credibility of the AGW Scientific Community who have been pushing the scam for decades and now expect everyone to say they did nothing wrong. Most of them should be immediately fired. Some should be prosecuted for fraud. These scientists sold their souls for fake and funding, sold out their credibility such that they make ENRON accountants look honest.
We must never let them scam their way out of the scam they created. Hound them to the ends of the earth.
That’s just reality. It has no effect on AGW because AGW is real and is based on the “real” models. /sarc
The irony of all this is that I prefer warmer climate. I don’t care if all the ice goes away because as long as there is ice on the planet, it means we’re in an ice age. And in less than 3000 years, we’ll be in a full ice age, not an interglacial like now. In fact, it’s obvious that it’s colder now than 5000 years ago by at least 3 degrees C and will continue to do so for another 6C. This interglacial is on its way out. This AGW scare is pure lunacy. Not to mention the lunacy that we’re so very close to complete extinction if CO2 levels go below 180 ppm. CO2 levels should be much higher. Look at the long term trend. THAT is what’s scary. Not high CO2, but low CO2. It’s like the “climate scientists” decided that everything that is truly harmful, they’re going to treat as safe, and everything safe and beneficial, they’re going to treat it as dangerous.
That is the crux of the matter. The Earth is in a COOLING phase and during the last glacial when the oceans cooled they sucked the CO2 down to a very dangerous level.
I often publish the Antithesis viewpoint, eminent glaciation, mainly to tweak the noses of the Alarmists, but the fact is we do not know when the earth will actually descend into the next glacial and the ride down will be almost as bad as glaciation is.
Heck this quiet solar period and a few bad volcanic eruptions could be the trigger for all we know. The earth is certainly within the glacial inception “Tipping Point” for solar insolation.
The fall 2012 paper Can we predict the duration of an interglacial? gives the calculated solar insolation values of several glaciations:
The current value according to that paper is: northern summer solar insolation = 479W m?2
MIS 7e – insolation = 463 W m?2,
MIS 11c – insolation = 466 W m?2,
MIS 13a – insolation = 500 W m?2,
MIS 15a – insolation = 480 W m?2,
MIS 17 – insolation = 477 W m?2,
The earth is a heck of a lot closer to glaciation than it is to peak warming. Remember ALL the energy comes from the sun except for a small amount from the molten core of the earth.
I would certainly like to see CO2 ~1000 ppm to 2000 ppm at this point in the Milancovitch cycle.
Another bit to toss in the face of Warmists is the Holocene sealevel Highstand was ~ 1.5 meter above todays sea-level 6,000 years ago in geologically stable South Vietnam. Sea level has been DECREASING in fits and starts ever since then.
Please, oh please! Send us more money so we can buy a new super-duper super computer. Of course it isn’t the computer’s fault that the garbage we put in gives us garbage out, but look! A squirrel. Now give us those extra billions. We’re certain to get this right….. one day.
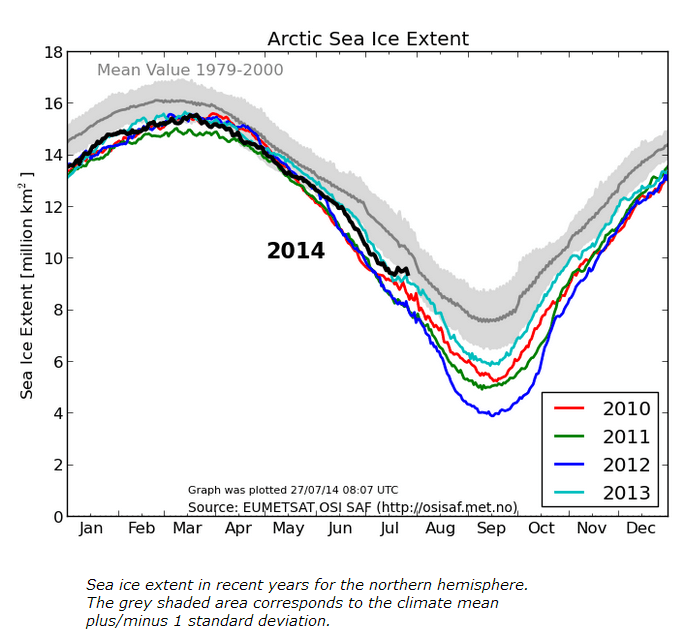
I’m curious about the cause of the “shoulder” in each of these graphs from the past few years around July. Anyone?
Is it due to rapid melting of thin annual ice, leaving thicker multi-year ice?
I recall that there is some change in the satellite data processing algorithm that is made around that time each year to account for melt water. I can’t find any reference to it in a quick search though. Not much help I guess.
My guess is that there is some ice, for example the ice in Hudson Bay, that is just going to melt every year (nearly.) That is why the chart goes into a free fall for a while. Then you hit a point where all the easy-to-melt ice is gone, and start in on the harder-to-melt ice.
Some years that harder-to-melt ice gets flushed south in quite large quantities through Fram Strait, (biggest decrease in extent). Some years warmer-than-normal waters melt the ice from beneath. (second biggest decrease.) However this year the ice isn’t getting flushed south, and the under-ice currents aren’t all that warm. And that is what sometimes creates the “Shoulder” in the graph.
In other words, I think your question holds the answer, in years like this one. Thin annual ice melts, leaving tough multi-year ice, and that ice says, “I am not going down easy, bucko.” Result? The “Shoulder” in the graph.
The thing that interests me is that not only the tough multi-year ice is saying, “I ain’t going down easy, bucko.” Also some of the first-year ice (also called “baby ice”) is on its way to becoming multi-year ice.
Latitude:Re Coast etc arctic. This is a real worry I have been posting here and at WUWT for many years now, that they have probably been “adjusting” each section of arctic ice to suit the AGW story.You see they cannot do that with Antarctica its one “whole mass/section. One wonders if NH ice is at all accurate, especially NSDC etc., and they have not been adjusting all the time.DMI is the only one that can be trusted. The Danes have an aversion to fraud..
We all know that the rapid melting gives a lot of more easyfrozen sweetwater around the thin thin ice and thats what gives the illusion of growth of ice…soon we have pike n perch insted of cod n halibuts around the poles…then u cant deny it 🙂
One of the main reasons I’m 100% sure AGW is wrong is that whenever I get into a discussion with a warmer, and I show some solid evidence, they so often resort to BS. Let me give you an example. I showed this chart to Rugby59, whose real name is Wayne Fowler, one of the main warmer shills on youtube. I showed him http://www.hyzercreek.com/NYsealevel.jpg and he tried to argue that it wasn’t really a straight line. He said somebody just drew a straight line through the data points and called it a straight line. I had to prove statistically that it was straight. Take a look at that chart. Can you imagine anybody so full of CRAP that they would try to argue it’s not really a straight line? Telling me I have to prove that it’s really a line, and doesn’t just “look” like one? So he points me to a fraudulent Church and White sea level paper (I repeat myself). It’s total BS. These people depend on their ability to BS.
The fraction of people who will change their opinions after being given contradictory facts is surprisingly small. People like Rugby59 do not think — at least they do not think in a rational sense. They emote, they believe, they feel, but they are impervious to mere facts. If all his friends changed, maybe Rugby59 would follow the herd, but otherwise, Rugby 59 will never renounce his cult. He is a member of a group that thinks truth is something produced by majority decision.
If anybody comes across rugbyguy59 on youtube videos just ignore him. He knows a lot about the AGW arguments and can name all the names, knows all the papers, but he admits to being in favor of US sending aid to African countries to repay the damage the US has caused to the earth via CO2, and so we should be carbon taxed. So he’s into redistribution of wealth.
The Ramones have the 4 basic rules of life. One of which is, don’t talk to commies. The 2 others are, be nice to mommy, and eat Kosher Salami. But the main one is, just don’t talk to commies. OK? And don’t talk to Rugbyguy59
Toto may be busy….. Working for a living is kinda tough at times.
I don’t know about your posts,. but the times I’ve encountered that issue was because I had to many links. You get 2 (I could be wrong it may be 3) without a quibble. More than that kicks the post into moderation never-never land.
Eventually such posts get read & pop into view. Most of the time.


http://www.bbc.co.uk/news/science-environment-28247175
ROFL … Good luck with that … hehehe
I love a good GAGWing clown car crash. Here’s the website:
http://cornellsailing.com/2014/07/blue-planet-odyssey-yachts-meet-cold-north/
Anyone laying bets on when they get stuck and have to be rescued?
Love this
Here is someone who does not love this.
it’s a lot worse than we thought…….
Recently they started counting the coast line….the ins and outs of all the bays, etc
That is the first thing to melt in the summer…and will bring the extent way down
…..and it didn’t
I just love how such a “settled science” keeps changing the measurement methodologies so often.
Their actions speak volumes about how “settled” their so-called science is.
🙂 It’s settled. They’ll say anything for a buck.
The end is coming soon an very soon… For the Bible tells me so… Thankyou Lord Jesus….
Sorry to disappoint you, but nobody knows when “the end” will come. “But about that day or hour no one knows, not even the angels in heaven, nor the Son, but only the Father.” (Matt. 24:36). … Also, the information you want can’t be found in Revelation. Very well qualified biblical scholars say Revelation was a dramatization of the persecution of the Jews and the destruction of Jerusalem in the first century. Anyway, why would people who lived in those times want to predict disasters over 2,000 years into the future? It doesn’t make any sense. It would be like us worrying about people who might be living in the year 4014.
“Anyway, why would people who lived in those times want to predict disasters over 2,000 years into the future? ”
What gives you the idea that a prophet WANTS to predict anything?
Okay, good point. .. I guess real prophets would have the ability to predict events in their future whether they wanted it or not! .. Maybe I should have omitted the words: “want to”, so that the sentence would be: “Anyway, why would people who lived in those times predict disasters over 2,000 years into the future?”
The HSDIC web site on Arctic Sea Ice is not yet showing the right “hook” visible in the EU chart you are showing above. Any theories or explanations why? Smoothing?
Here’s the link – and sorry for the typo above – it is NSIDC not HSDIC. My bad.
http://nsidc.org/arcticseaicenews/charctic-interactive-sea-ice-graph/
I thought the polar bears all drowned?
http://cornellsailing.com/2014/07/polar-bear-sighting/
Have a look at this.Notice the icy water(very below anomaly) surrounding the WHOLE of Antarctica:
weather.unisys.com/surface/sfc_daily.php?plot=ssa&inv=0&t=cur
http://www.weather.unisys.com/surface/sfc_daily.php?plot=ssa&inv=0&t=cur(it has no www.
Hmmm … looks like there is a ‘www’ to me, with a lot more before the unisys as well.
I just copied this from the browser’s address bar after visiting the website:
http://www.weather.unisys.com/surface/sfc_daily.php?plot=ssa&inv=0&t=cur
Hmmmm …
Excellent observation. Thanks.
Is anything happening to the Gulf Stream?
Yes, .. it seems to be moving at up to 3 knots in this graphic :
http://www.opc.ncep.noaa.gov/sst/images/gulfstream/ncomhrCurrWatlGS.png
( model run / forecast valid: 2014/07/25.)
Steven,
Big back-down coming:
Arctic sea ice extent will be above average this summer (2014) for the first time since the mid-1990s, according to predictions from computer models used by the US National Oceanic and Atmospheric Administration (NOAA).
http://www.reportingclimatescience.com/news-stories/article/noaa-predicts-above-average-arctic-summer-sea-ice-extent.html
This development will be seized on by climate change sceptics as evidence that the variations in Arctic sea ice are not totally due to human-driven global warming and that natural variations may play a role.
A number of recent research papers have hinted at the importance of natural variations in the Arctic.
Big, big back-down.
Soft, ‘fall back’ position detected: “recent research papers have hinted at the importance of natural variations in the Arctic.”
A claim of:
. “I was against natural variability before research papers turned me for it.”
… I am thinking …
.
Don’t allow them to weasel their way out of it. Use their own words. After all, Skeptics were not the ones who invented the drama-queen phrase, “Death Spiral,” and had all sorts of ominous music playing in the background, during supposedly-scientific PBS documentaries.
Of course Skeptics are going to “seize upon” a blunder of this magnitude. Why not? Are Alarmists going to now claim that pointing out the mud all over Alarmist’s faces is bad manners?
It would be one thing if most Alarmists had ever displayed the slightest iota of good manners towards Skeptics. (Maybe a few did, but they stood out as exceptions to the rule. I will display decency and courtesy towards those few.) The rest? I will “seize upon” and “seize upon” and “seize upon,” grinding the magnitude of their folly into their foolish faces.
Of course. Ditto to the above. Thanks Caleb.
Hey Caleb! “Don’t allow them to weasel their way out of it. Use their own words.”
Yes, exactly — and they WILL try to weasel out. That is one reason why I always stress “CAGW” and tell them that their alarmism is based on four points. They claim that the changes are catastrophic, that they are man made, that they are global in nature, and that it is warming (not merely changing cycles). If they back down from any of those claims, then their whole plan of “Let’s destroy Western Civilization” falls apart.
I listen to you (Caleb) as someone who knows a lot more than the self proclaimed Government experts. They have been blundering for the last 30 years. If they were financial advisors, they would have been out of business long ago.
Big Al (Al Gore) has some backing down to do as well.
His prediction of there being a 75% chance of an Ice-free Arctic in 2014 looks like an abysmal failure at this point.
I wonder if he will blame a “97% consensus of all the computer-generated climate models” as the basis of his spectacularly failed prediction.
This development will be seized on by climate change sceptics as evidence that the variations in Arctic sea ice are not totally due to human-driven global warming and that natural variations may play a role.
Well, duh.
A little help please – Can anyone direct me to a source of historical daily precipitation for all the stations within a given Indiana county? I tried google and some links above, but USHCN gives me an error. I don’t need the raw data, just the output of precipitation by date and station from as far back as possible to present.
I’m fighting “the man” and trying to show that a rain/flood event in 2003 was a 100 yr event. They put my property in the flood plain 5 years after our home was built, so I get to pay flood insurance, which reduces my property value by at least $50,000.
The Indiana Department of Natural Resources does the flood mapping here for FEMA. After a big 2003 flood/precip event, I called the DNR and said all the media and government officials are reporting that this was a 100 yr flood, maybe a 500 yr flood, so you need to remove my property from the 100 yr flood plain because our home did not flood. Unbelievably, the DNR said, “it is not possible that it was a 100 yr flood at your house, because if it was, our model shows that your house would have flooded”. I kid you not, models trump observation, similar to global warming. It’s extremely frustrating.
I’ve been trying to fight it for 10 years, but it’s one dead end after another. The flood insurance is added to the mortgage. You have no choice but to pay it. My neighbor is in the same situation, but he is trying to sell his house. He had his house sold for his asking price until the lender added mandatory flood insurance to the mortgage, and the buyer backed out. The seller dropped his price by $50k, but the buyer said no thanks. These aren’t mansions on the ocean. These are average priced homes a half mile from a small creek.
Thanks, and sorry for the OT, but I’m not sure where to turn.
I would also consider studying some of the area topographic maps for your area, to get a mental idea how your property is situated with respect to local ‘watersheds’. I am not familiar with the 2003 flood event up there, but we can get rains here in Texas that can be somewhat ‘localized’ and create problems for some folks and not others.
PS. I just checked the USGS website and for some reason it seems to be down … probable outage for service on a Sunday vs a weekday I would reckon.
.
They pulled this on me.
We are a half mile from a large river. I got the large printed Topographic map from USGS and a survey of the property and took them both to the local (200 miles away) office of the USGS and had a geologist mark the actual 100 year flood plain on the topo map and on my survey. He added a letter and stamped the drawing. It shut up the planning board but they still would not allow a basement. (I am on a ridge 100 feet above the flood plain.)
Good luck. That was done back in 1994 before CAGW was such a major football.
Following bread crumbs I found myself here: http://www.reportingclimatescience.com/news-stories/article/evidence-that-internal-variability-has-driven-arctic-climate-change.html
Hadn’t seen this article before. Not surprising given the limited access to the public authors who go against the party line have.
There is a Death Spiral. It is the credibility of the AGW Scientific Community who have been pushing the scam for decades and now expect everyone to say they did nothing wrong. Most of them should be immediately fired. Some should be prosecuted for fraud. These scientists sold their souls for fake and funding, sold out their credibility such that they make ENRON accountants look honest.
We must never let them scam their way out of the scam they created. Hound them to the ends of the earth.
That’s just reality. It has no effect on AGW because AGW is real and is based on the “real” models. /sarc
The irony of all this is that I prefer warmer climate. I don’t care if all the ice goes away because as long as there is ice on the planet, it means we’re in an ice age. And in less than 3000 years, we’ll be in a full ice age, not an interglacial like now. In fact, it’s obvious that it’s colder now than 5000 years ago by at least 3 degrees C and will continue to do so for another 6C. This interglacial is on its way out. This AGW scare is pure lunacy. Not to mention the lunacy that we’re so very close to complete extinction if CO2 levels go below 180 ppm. CO2 levels should be much higher. Look at the long term trend. THAT is what’s scary. Not high CO2, but low CO2. It’s like the “climate scientists” decided that everything that is truly harmful, they’re going to treat as safe, and everything safe and beneficial, they’re going to treat it as dangerous.
+1
Very good post +4
+100^100000
That is the crux of the matter. The Earth is in a COOLING phase and during the last glacial when the oceans cooled they sucked the CO2 down to a very dangerous level.
Carbon starvation in glacial trees recovered from the La Brea tar pits, southern California (La Brea is near sea level)
Royal Society: Carbon dioxide starvation, the development of C4 ecosystems, and mammalian evolution
I often publish the Antithesis viewpoint, eminent glaciation, mainly to tweak the noses of the Alarmists, but the fact is we do not know when the earth will actually descend into the next glacial and the ride down will be almost as bad as glaciation is.
Heck this quiet solar period and a few bad volcanic eruptions could be the trigger for all we know. The earth is certainly within the glacial inception “Tipping Point” for solar insolation.
The fall 2012 paper Can we predict the duration of an interglacial? gives the calculated solar insolation values of several glaciations:
The current value according to that paper is: northern summer solar insolation = 479W m?2
MIS 7e – insolation = 463 W m?2,
MIS 11c – insolation = 466 W m?2,
MIS 13a – insolation = 500 W m?2,
MIS 15a – insolation = 480 W m?2,
MIS 17 – insolation = 477 W m?2,
To give you a feel for how close to glaciation the earth is, you can also look at the calculations from NOAA:
http://www1.ncdc.noaa.gov/pub/data/paleo/climate_forcing/orbital_variations/berger_insolation/insol91.jun
depth of the last ice age – around 463 Wm?2
NOW (modern Warm Period) 476 Wm-2
Holocene peak insolation: 522.5 Wm-2
The earth is a heck of a lot closer to glaciation than it is to peak warming. Remember ALL the energy comes from the sun except for a small amount from the molten core of the earth.
I would certainly like to see CO2 ~1000 ppm to 2000 ppm at this point in the Milancovitch cycle.
Another bit to toss in the face of Warmists is the Holocene sealevel Highstand was ~ 1.5 meter above todays sea-level 6,000 years ago in geologically stable South Vietnam. Sea level has been DECREASING in fits and starts ever since then.
Please, oh please! Send us more money so we can buy a new super-duper super computer. Of course it isn’t the computer’s fault that the garbage we put in gives us garbage out, but look! A squirrel. Now give us those extra billions. We’re certain to get this right….. one day.
I’m curious about the cause of the “shoulder” in each of these graphs from the past few years around July. Anyone?
Is it due to rapid melting of thin annual ice, leaving thicker multi-year ice?
John, it’s probably wind…when the Arctic settles into a summer pattern
I recall that there is some change in the satellite data processing algorithm that is made around that time each year to account for melt water. I can’t find any reference to it in a quick search though. Not much help I guess.
My guess is that there is some ice, for example the ice in Hudson Bay, that is just going to melt every year (nearly.) That is why the chart goes into a free fall for a while. Then you hit a point where all the easy-to-melt ice is gone, and start in on the harder-to-melt ice.
Some years that harder-to-melt ice gets flushed south in quite large quantities through Fram Strait, (biggest decrease in extent). Some years warmer-than-normal waters melt the ice from beneath. (second biggest decrease.) However this year the ice isn’t getting flushed south, and the under-ice currents aren’t all that warm. And that is what sometimes creates the “Shoulder” in the graph.
In other words, I think your question holds the answer, in years like this one. Thin annual ice melts, leaving tough multi-year ice, and that ice says, “I am not going down easy, bucko.” Result? The “Shoulder” in the graph.
The thing that interests me is that not only the tough multi-year ice is saying, “I ain’t going down easy, bucko.” Also some of the first-year ice (also called “baby ice”) is on its way to becoming multi-year ice.
John go here and look at the graphs of individual seas / areas and you will see (as Caleb mentions) the effect of areas melting out totally and therefore plateauing (your shoulder):
http://arctic.atmos.uiuc.edu/cryosphere/IMAGES/recent365.anom.region.1.html
Click an area to see it’s plot.
Thanks everyone for the replies.
Latitude:Re Coast etc arctic. This is a real worry I have been posting here and at WUWT for many years now, that they have probably been “adjusting” each section of arctic ice to suit the AGW story.You see they cannot do that with Antarctica its one “whole mass/section. One wonders if NH ice is at all accurate, especially NSDC etc., and they have not been adjusting all the time.DMI is the only one that can be trusted. The Danes have an aversion to fraud..
We all know that the rapid melting gives a lot of more easyfrozen sweetwater around the thin thin ice and thats what gives the illusion of growth of ice…soon we have pike n perch insted of cod n halibuts around the poles…then u cant deny it 🙂
I want to catch some pike and perch around the south of the poles. Any timeframe so I can start booking the trip?
This is cold for Fiji !!
http://www.fijitimes.com/story.aspx?id=275591
One of the main reasons I’m 100% sure AGW is wrong is that whenever I get into a discussion with a warmer, and I show some solid evidence, they so often resort to BS. Let me give you an example. I showed this chart to Rugby59, whose real name is Wayne Fowler, one of the main warmer shills on youtube. I showed him http://www.hyzercreek.com/NYsealevel.jpg and he tried to argue that it wasn’t really a straight line. He said somebody just drew a straight line through the data points and called it a straight line. I had to prove statistically that it was straight. Take a look at that chart. Can you imagine anybody so full of CRAP that they would try to argue it’s not really a straight line? Telling me I have to prove that it’s really a line, and doesn’t just “look” like one? So he points me to a fraudulent Church and White sea level paper (I repeat myself). It’s total BS. These people depend on their ability to BS.
The fraction of people who will change their opinions after being given contradictory facts is surprisingly small. People like Rugby59 do not think — at least they do not think in a rational sense. They emote, they believe, they feel, but they are impervious to mere facts. If all his friends changed, maybe Rugby59 would follow the herd, but otherwise, Rugby 59 will never renounce his cult. He is a member of a group that thinks truth is something produced by majority decision.
If anybody comes across rugbyguy59 on youtube videos just ignore him. He knows a lot about the AGW arguments and can name all the names, knows all the papers, but he admits to being in favor of US sending aid to African countries to repay the damage the US has caused to the earth via CO2, and so we should be carbon taxed. So he’s into redistribution of wealth.
The Ramones have the 4 basic rules of life. One of which is, don’t talk to commies. The 2 others are, be nice to mommy, and eat Kosher Salami. But the main one is, just don’t talk to commies. OK? And don’t talk to Rugbyguy59
Yep, behavior always gives the game away.
Ice comes ice goes, I wounder why –
https://www.youtube.com/watch?v=d66E6JXiLVM&feature=youtu.be
Check out the “Recent” channels (C1- through C25) and see where all that heat is going 😉
http://images.remss.com/msu/msu_time_series.html
“If climate scientists had a more expensive computer, then the Arctic really would be melting like they predicted.”
Well obviously, because those extra computers would be producing more heat which will warm up the planet and cause the artic ice to melt.
Host: Is there any reason why my two comments/question are still showing as “waiting for moderation?”
Toto may be busy….. Working for a living is kinda tough at times.
I don’t know about your posts,. but the times I’ve encountered that issue was because I had to many links. You get 2 (I could be wrong it may be 3) without a quibble. More than that kicks the post into moderation never-never land.
Eventually such posts get read & pop into view. Most of the time.