
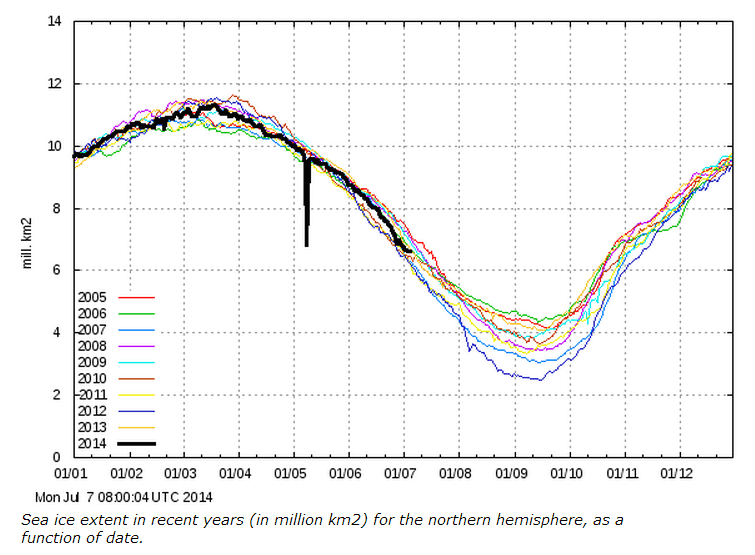
2006 had the highest summer minimum of the last decade, and July 7, 2014 Arctic ice extent is identical to the same date in 2006.
COI | Centre for Ocean and Ice | Danmarks Meteorologiske Institut
2006 had the highest summer minimum of the last decade, and July 7, 2014 Arctic ice extent is identical to the same date in 2006.
COI | Centre for Ocean and Ice | Danmarks Meteorologiske Institut

I can’t believe the error in May hasn’t been corrected.
So it’s worse than we thought! :-O
Yes but Antarctic sea ice is up by 622,000 Manhattans!
http://www.dailymail.co.uk/news/article-2681829/Global-warming-latest-Amount-Antarctic-sea-ice-hits-new-record-high.html
This plot and your earlier post have different extents? Or am I reading this wrong?
http://stevengoddard.wordpress.com/2014/07/07/im-absolutely-certain-that-three-weeks-from-now/
Different calculation methods used by different agencies. The important thing is the slope and the relative position of different years in the same plot.
Some might be interested to compare MASIE results with NOAA Sea Ice Index, since NOAA is a typical reference for Arctic Ice news. NOAA, like DMI uses only passive microwave readings, while MASIE includes other sources, such as satellite images and field observations.
For comparison, MASIE shows about 700,000 Km2 more ice extent than NOAA both at maximum and minimum. This is usually explained by microwave sensors seeing melt water on top of ice the same as open water.
For the years 2007 to 2013 inclusive, each year MASIE shows higher maximums than NOAA, on average 5% higher. In each of those same years MASIE shows higher minimums than NOAA, on average 15% higher. The melt extent is more comparable: NOAA shows an average annual loss of 70.5 %, while MASIE shows an average loss of 67.5%.
Isn’t something like just a couple of inches (or less) meltwater able to skew the passive microwave measurements?
Yes, that’s where the 700,000Km2 difference comes from.
What can we expect from NOAA for 2014 minimum ice extent? Below are estimates based upon the extent of melt from maximum to minimum.
Average: 4.40 MKm2, (comparable to 5.09 for MASIE) If the loss is the same as the seven-year average, the minimum for 2014 can be estimated to be 4.40MKm2, which is 13% less than the 2013 minimum of 5.08 MKm2. This is due to starting the melt with a smaller max extent.
Low: 3.29 Mkm2, (comparable to 3.81 for MASIE) On the other hand, if the loss is as great as in 2012 (the record recent minimum), 2014 could go as low as 3.29 Mkm2, which would be a new record.
High: 4.97 MKm2,, (comparable to 5.74 for MASIE) If the melt is as small as 2009, the 2014 minimum could be as high as 4.97 MKm2.
If the 2014 NH ice extent minimum is outside this range, then maybe the climate is changing. Note that an extent matching or exceeding 2013 would be outside this range, and would suggest a cooling effect.
Noaa’s forecast: ~6.7 million sq kilometers
http://www.cpc.ncep.noaa.gov/products/CFSv2/imagesInd3/sieMon.gif
Yes Daffy, Joe Bastardi pointed to that as well. If that forecast happens, it will be a major event, a “sea change” as it were. If it would shut up alarmists, I would be happy, but I don’t hope for it since warm is better than cold.
Someone once said: “Happiness is 90% warmth.”
FYI that forecast by noaa was updated today! Their June forecast had August ice +600,000 which they lower to approx +370,000 for August. My point being while noaa is tweaking there forecast, they are sticking with the whopper minimum.
You can see a copy of last month’s noaa forecast here: http://community.runnersworld.com/topic/editing-summer-solstice-arctic-sea-ice-noaa-forecasts-above-average-minimum-in-september-but-melt-ponds-say-min-same-as-last-year
Also, some more cynical than I have suggested that NOAA put their estimate unrealistically high so their September headline can be to the effect that Arctic ice is once again below expectations.
… If typhoon neoguri goes into the arctic is what to worry about
http://www.jma.go.jp/en/typh/typh5.html
The other advantage of MASIE is the tracking of specific regions.
At this point (day 186) 40% of NH ice extent has melted. Here are the Regions to watch:
Central Arctic still has 99% of its ice
East Siberian Sea 93%
Kara Sea 77%
Beaufort Sea 82%
Canadian Archipelago 86%
Why these regions?
The Northwest Passage (NWP) goes through Baffin Bay, Canadian Archipelago, Beaufort Sea, Chukchi Sea and the Bering Sea. The Northern Sea Route (NSR) used by Russia goes through Barents Sea, Kara Sea, Laptev Sea, Eastern Siberian Sea, to Chukchi Sea, Bering Sea.
“During early September 2013 the Russian battlecruiser Petr Velikiy led a flotilla of Russian navy ships through the Russian portion of the Northern Sea Route in preparation for establishing regular patrols. About 400 ships are expected to transit the Russian portion of the route during the 2013 season, up from about 40 during 2012.”
Ihttp://en.wikipedia.org/wiki/Northern_Sea_Route
In actual fact, with the unexpected ice recovery., only 71 ships crossed the Northern Sea Route in 2013. The NWP did not open at all because of the iced Archipelago.
I wonder how volume compares this year to 2006?
The current extent is within days of every other measured extent. The slopes are all but unvarying. There are wiggles where regional areas melt sooner or later year on year. The slope represents the rate of possible change, up or down, and the rate of possible change is unchanging over time. All that changes is where in the timeline the slope is found.
How can these unvarying slopes be explained in a warming world? One is surely reasonable to presume a warming world would create rates of change proportionate to the warming – quicker melt times, slower refreeze times.
But all the ice is THINNER now, right?
That’s what the AGW cultists tell me.
Also, if you mention the Arctic they tell you it’s the Antarctic that matters, there are after all no penguins in the Arctic which you’d know if you weren’t such a Luddite tool.
If you tell them about the Antarctic, you’re a bloody fool because it’s the ARCTIC that matters, and the dwindling polar bears.
It’s a cultist tag-team extravaganza!
NOAA are exceptionally good at ‘adjusting’ temperature records, why don’t they adjust their ice records to reflect the microwave errors … or is it that the error by microwave sensors is consistent with their ‘adjustment algorithms’ ?
“2006 had the highest summer minimum of the last decade, and July 7, 2014 Arctic ice extent is identical to the same date in 2006”
Looking at that graph and telling that you must have better eye sight than me.
There is no correlation between current ice extent and what the final minima will be, so saying it is same as 2006 which had a certain extent at minima has no weight. Same as saying it is same as 2012 or 2007. Need to wait longer.
Andy