
Green shows areas of ice gain since yesterday. Red shows regions of ice loss. Cold temperatures and a cyclone in the western Arctic have essentially halted ice extent loss.
Green shows areas of ice gain since yesterday. Red shows regions of ice loss. Cold temperatures and a cyclone in the western Arctic have essentially halted ice extent loss.

Tony,
Is there a colorblind friendly graph you can point me to?
Thanks
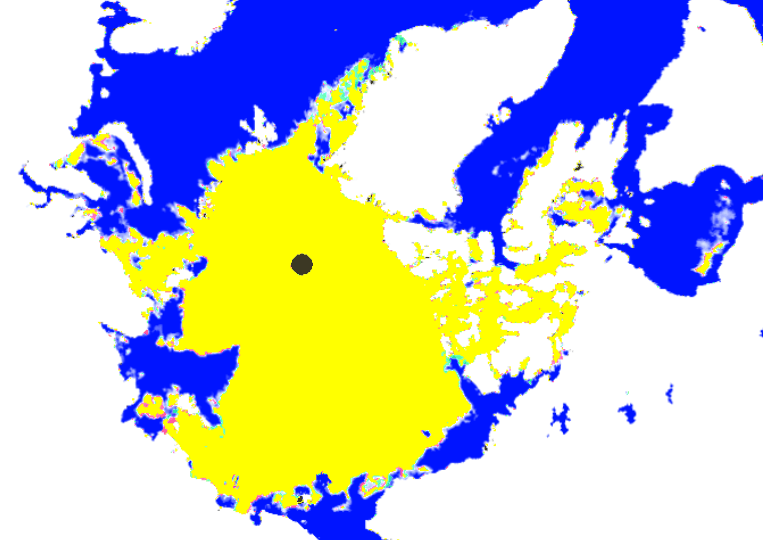
This one is from Cryosphere Today and they usually update it daily!
Those seeking to traverse the elusive N.W. Passage this year may have a rough go of it 😉
http://arctic.atmos.uiuc.edu/cryosphere/NEWIMAGES/arctic.seaice.color.000.png
The big dot in the middle is a polar bear orgy. (You don’t want to see it.)
I thought it was Al Gore’s yacht.
or this
or this
Nah! It’s just a fargin’ icehole!
https://www.youtube.com/watch?v=dv8tVxk6Nj4&app=desktop
ROFLMAO
Again, so much ice, so few row boats.
Wonder what ever happened to our ever so earnest and Greenie do gooders? Maybe they needed to make some money to pay their debts and they have gone to work at the Oil Sands.
Gaia would be most pleased.
Yeah, its row bots now.
I was up in Calgary last year skiing and was with some oil sand people that were greenies and seemed to have no problem working in the oil sands. But they still “cared” about the problem and wanted someone/something bigger than themselves to fix it.
Were they able to define what the “problem” was?
“If Canada proceeds [with its tar sands oil development]… ice sheets would accelerate out of control. Sea levels would rise and destroy coastal cities. Global temperatures would become intolerable. Twenty to 50 percent of the planet’s species would be driven to extinction.” -James Hansen, 2012
Wow, these greenies really put there own personal interest above that, huh. Of course, Gore does the opposite, by showing charity to the owners of a soon to be deluged beachside CA mansion by buying it off them for $9 million. Very nice of Gore.
Of course we also got this:
“Entire nations could be wiped off the face of the Earth by rising sea levels if the global warming trend is not reversed by the year 2000. Coastal flooding and crop failures would create an exodus of eco-refugees, threatening political chaos.” -Noel Brown, ex UNEP Director, 1989
And this:
“[in twenty years (2008)] the West Side Highway (and thus much of Manhattan) will be under water.” -James Hansen, 1988, NASA http://stevengoddard.wordpress.com/2012/09/28/manhattan-underwater-update/
And yet, no right turn in the anomaly maps so far…
DMI shows 2014 and 2013 as nearly identical in the last few days,
15% concentration
http://ocean.dmi.dk/arctic/plots/icecover/icecover_current_new.png
and 30%
http://ocean.dmi.dk/arctic/plots/icecover/icecover_current.png
Last year the ice extent nearly halted around July 20th and the plateau continued for nearly a week, but only the 15% graph shows it clearly.
This is two days behind, but a right turn is in the making:
http://arctic-roos.org/observations/satellite-data/sea-ice/observation_images/ssmi_ice_ext.png
I don’t know if you have seen these images but they are updated every 3 hours and the graphic is excellent! Only works for me in google Chrome, not IE.Enjoy:
http://earth.nullschool.net/#current/wind/isobaric/850hPa/orthographic=-227.14,88.95,635
PS: Has a lot of changable parameters down the bottom left corner too.
Interesting pictures of summer snow in Chelyabinsk, Russia on July 12th.
http://englishrussia.com/2014/07/14/mid-summer-snow/
Steve, nearly 1000 Manhattens melted away yesterday, how can you say “essentially halted” ?
Andy
It is melting.
From 11th to 12th -90,000 km2
From 12th to 13th -50,000 km2
From 13th to 14th -75,000 km2
http://www.ijis.iarc.uaf.edu/seaice/extent/plot_v2.csv
Actually tracking years 2007 and 2014.
It is a very good thing that 2014 is tracking 2014 … we are all going to die of GLO-BULL warming but the last thing we need is a tear in the space time continuum so that we can die twice 😉
Groundhog Day!