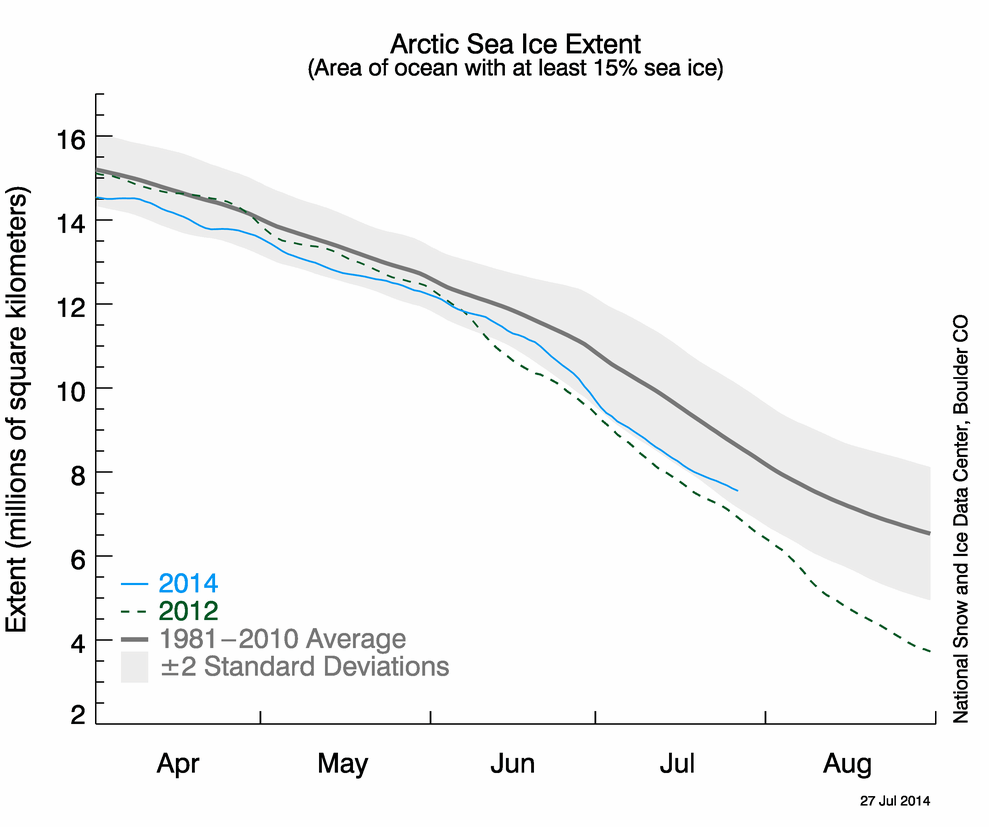
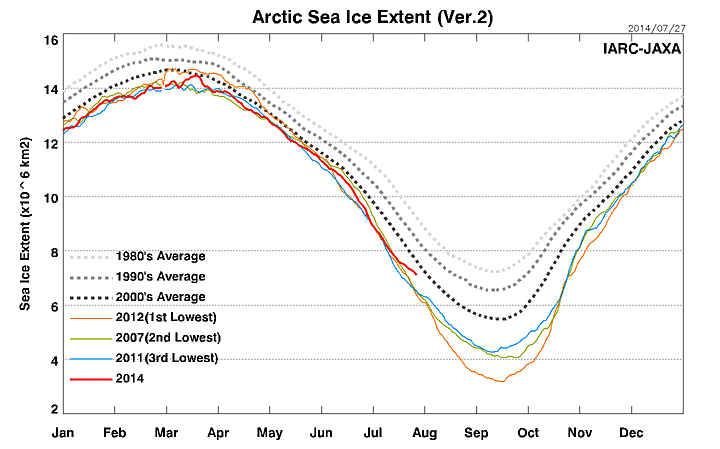
Last week, ClimateCrocks started the latest round of conspiracy theorizing – when they implied that DMI’s Arctic graphs (which showed a sharp decrease in ice loss rates) were somehow different from the other groups measuring the same data.
It is difficult to understand where such world beating paranoid stupidity comes from. All of the groups measuring Arctic sea ice show exactly the same thing – ice loss has dropped off sharply over the past few weeks.


If I had a manufacturing process running within 2?, it would be time to work on something else.
I do not think Climastrogists have any knowledge of statistics what so ever.
I have seen production people with a heck of a lot more understanding. (we made them do tests and chart the results. You got your hand smacked good if you messed with the controls if the charts showed the process was within two standard deviations.)
my old stomping grounds in Eureka (NU) is just above freezing!! in late July!! They should be +10 to +15 each day….
It’s also apparent “they” don’t bother to check what the measurements are. Not all the graphs use the same methodology so they will come out slightly different. The one you had before is a fairly known one, but it did skew a bit more than the others. Again, due to methodology.
Conspiracies are fun until you start making up your own. But the AGW crowd has crossed that bridge a long time ago.
This is the 1st sign of data tampering to come.
Two clear signs of deception in government science were recently identified for the Congressional Space Science and Technology Committee immediately after the end of the Second World War:
1. The internal composition of the Sun was changed from mostly iron (Fe) in 1945 to mostly hydrogen (H) in 1946, . . . (without discussion or debate) and
2. Textbooks replaced Nobel Laureate Francis W. Aston’s rigorously valid “nuclear packing fraction” with von Weizsacker’s convincing, but deceptive “nuclear binding energy” after the Second World War.
https://dl.dropboxusercontent.com/u/10640850/WHY.pdf
omanuel, not that you have a horn to continually toot, but did you notice the UFO’s last week?
There were three that landed in my back yard. I tried to call 911, but my calls were somehow blocked. I got some photos, but later, when I examined the photos, the UFO’s had been edited out.
Just wondering if this ever happened to you….
Sometimes I think you are so F.O.S. (figure it out) it must show out your ears; it defies the imagination (and a LOT of common sense) to think that that working physicists today would accept any hare-brained theories about whole-sale cover-ups and re-written ‘theory’ when dozens of old textbooks and written correspondence/research letters from that era still exist in libraries around the world.
Simply stated, some of your harebrained theories just don’t hold any water when examined from a logical, real-world perspective.
.
It’s an ancient rhetorical technique, made famous by “Carthago delenda est”. Except that Cato could make the case.
Colorado Wellington:
Thanks for the intriguing quote. The recent AGW saga shows that dogmatic arrogance holds its own seeds of destruction.
The Warmongers are getting desperate. None of their predictions are coming true, they look like lying dumbass fools.
So they will double down and make bigger fools of themselves.
A lot more than the reputations of Warmongers is at stake:
The reputation of the entire post-WWII scientific edifice is about to crumble !
For this, we can all indebted to the unidentified person that surreptitously released the Climategate emails in late November 2009.
Correction: For this, we are all indebted to the unidentified person that surreptitously released Climategate emails in late November 2009.
NANSEN has figured out how to stop the graph making a right-turn: just stop updating it. Now almost a week since they posted any updates (usually it’s updated daily):
http://arctic-roos.org/observations/satellite-data/sea-ice/observation_images/ssmi1_ice_area.png
Steve:
If you have not seen the latest in stupidity, read this for the joke of the year:
http://www.dailymail.co.uk/sciencetech/article-2708256/Would-climate-change-CRUISE-Ship-tour-melted-Arctic-tourists-polar-bears-theres-no-mention-environmental-impact.html
Let’s recap for a moment. There isn’t suppose to be any ice as of 2013. So what are you guys saying? There is still ice at the Artic? What happened to the 2013 line?
NSIDC uses a 5 day average to fit their line, whereas DMI uses the daily value. This is why the slope of the others appear to have a less drastic change.
Is it only me or have the warm-mongers been very quiet recently? Are they planning something or do they know their goose is cooked?
They’ve had two days of siting on one thread https://stevengoddard.wordpress.com/2014/07/26/coolest-summer-on-record-in-the-us/ because that one was quoted a bit wider.
Preprogrammed fools of little intellect all of them.
Keep turning the screw, Steve.
From Denmark it is easy understandable that the ice melts slowly for the time being.
Denmark and Greenland/Arctic is somehow opposite in temperature, and we have had two weeks of very intence heat in Denmark, so naturally Greenland should have it colder than normal.
Actually it is Canada and the USA having the colder weather. It was 59 °F (15 °C) this morning in mid North Carolina. BRRRrrrrr
This is because the jet stream has gone from zonal to a meridional pattern. (S curves)
Some think this is caused by changes in UV levels from the weak solar cycle 24 that effects the formation and destruction of ozone. TSI may stay fairly constant but UV/EUV can change 7% or more.
SEE: http://science.nasa.gov/science-news/science-at-nasa/2009/01apr_deepsolarminimum/
Hudson found that during the Grand Solar Maximum of the 20th Century the Jets moved southward. (SEE: A History of Solar Activity over Millennia by Ilya G. Usoskin of the Sodankyl Geophysical Observatory-Oulu unit)
What is not mentioned in the paper of course is that the jets are now moving back towards the equator and the jets have gone from Zonal to Meridional. After all you can not get funding or get your paper published if you do not Kowtow to the CAGW gods.
A second paper:
From the Laboratory for Atmospheric and Space Physics (Colorado)
Of note is the Laurentide Ice Sheet in the last glaciation followed the same shape as the “Polar Vortex” cold weather intrusions into Canada and the USA. MAP Notice that Alaska had tundra while near New York City was buried in ice. (There was a glacial moraine in my backyard just north of NYC)
The official low temperature this morning was 58F. Locally, 54F. I’m not at the airport and my probe is not in a standard shelter. So what was the ‘real’ low? Closer to 54 than 58; but that doesn’t matter much.
I’m on the edge of the Birmingham metro area, in a Piedmont valley in Alabama. I’m further south than Gail, yet it was colder here.
Gail, are you in the mountains, the Piedmont, or coastal plain?
Anyway, some might be surprised by it being a bit ‘warmer’ overnight in mid-NC some 3 degrees north of me, but I’m not. I’ve seen it be warmer in NYC than here due to cold front timing and oceanic influences, including wind fetches with oceanic components.
I am Mid state in the Piedmont
Ah, thanks. I was in your neck of the woods earlier this year hauling a vehicle my nephew bought for his business.