Yesterday I reported that USHCN raw monthly temperatures do not match the daily temperatures for the corresponding month, and the changes from raw daily to raw monthly produce a bias which makes their TOBS adjustment look legitimate.
So I started looking at specific examples – this is the second one I have looked at so far.
Jefferson City, MO is station ID USC00234271
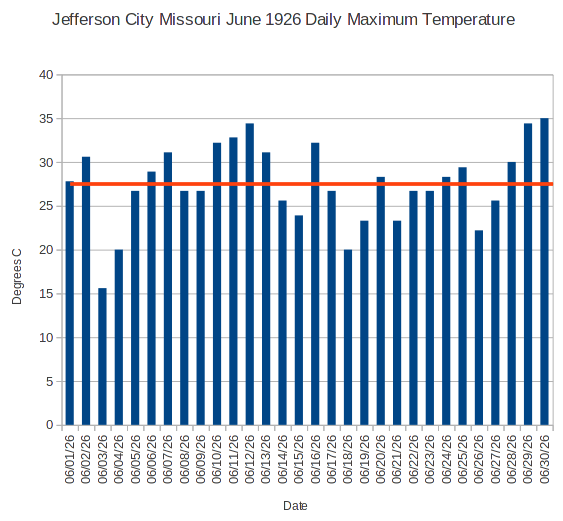
During June, 1926 the station reported maximum temperatures every day of the month, with an average daily maximum of 27.54C.
But the USHCN monthly raw temperature for Jefferson, MO June 1926 is marked as 2833c, which means 28.33C and a code of “c”
Their documentation doesn’t say anything about a code “c” and there is nothing even slightly suspicious about the daily temperature data for that month. So why does the raw maximum monthly temperature differ from the measured maximum daily average by 0.8C?
This is completely nuts. What are these people doing?


Making their own global warming – since Gaia is not supporting them.
Could ‘c’ mean corrected?
So in this instance they are not cooling the past…hmmm.
Just a random choice of location?
Like I said, this is the second individual station I have looked at. The average for all 1936 morning stations does cool the past quite a bit.
Understood, there is a pattern.
I don’t see why they would want to warm the past. Unless I am missing something, that adjustment must result from incompetence rather than the usual criminality.
They tend to increase certain abnormally low years/months to help hide the fact that they’re generally cooling the past. If, for instance, June 1926 was unusually cold (averaging 82° for the high in June in Jeff City doesn’t seem particularly high) , adding 0.8°C would help to offset a decrease in other years (hey, look, we adjusted ’36,’35, & ’10 down, but we adjusted ’26 up, so it averages out, right?) without having a very large effect on the overall “corrected” trend.
that is on a “need to know basis” and unless you are part of the climate establishment you don’t need to know. Job security is only achieved when nobody rocks the boat by asking awkward questions. And don’t let the facts get in the way of a good story.
What happens to the data if they threw out the highest and lowest daily maximum? And are they using a median value of the daily maximum instead of a linear average?
When I approximate the data in excel form the graph, I get an average of 27.6, median of 27.5, a mode of 27, and of course stdev of 4.5…not that the data should be normal, but what other approx. would they be doing, certainly not lognormal?
They will keep futzing around and futzing around with the constant shifts and “adjustments” until they hope no one has a good copy of the raw data anymore.
Then in a “Lois Lerner” moment, the dog will eat the hard drive with the raw data. And the NSA won’t be able to locate their copy either.
And then “hey presto” the new, altered and adjusted data will be declared to be the “sacred official data” to be sued henceforth.
Just a guess though.
sued –> used….
I’ll blame the smell checker for passing that. Err… Spell checker….
Spell checkers can only tell you if it is not a word, not that it is sued correctly. 😉