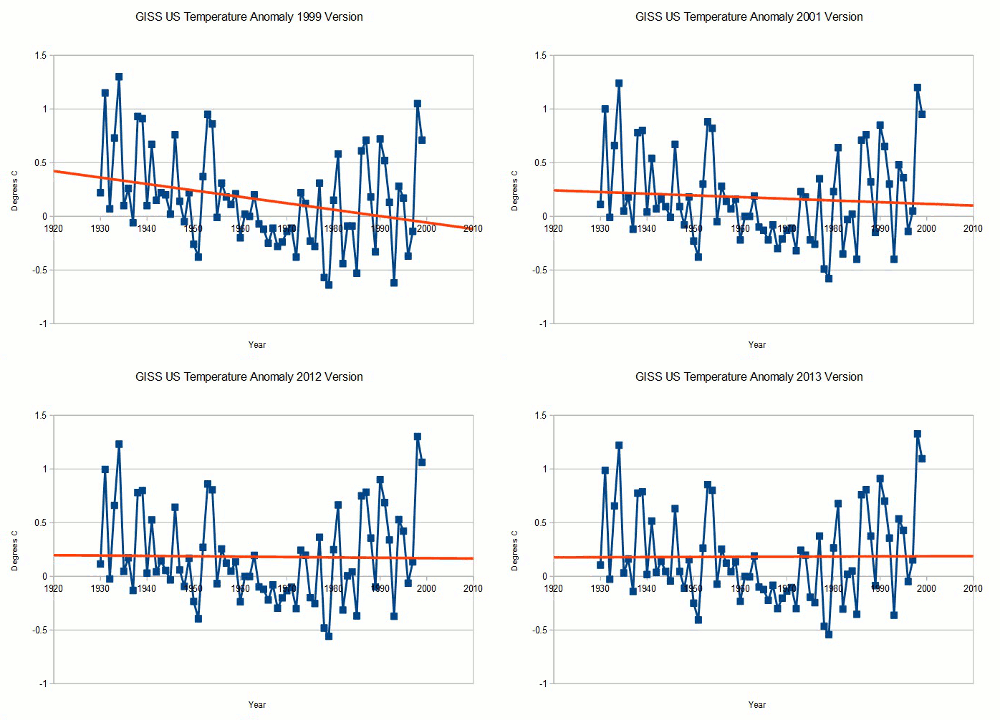
Almost every year, NASA finds a new valid scientific reason excuse to further cool the past and warm the present, and they are still at it.
2000 version : www.giss.nasa.gov/data/update/gistemp/graphs/FigD.txt
2001 version : www.giss.nasa.gov/data/update/gistemp/graphs/FigD.txt
2012 version : data.giss.nasa.gov/gistemp/graphs_v3/Fig.D.txt
2014 version : data.giss.nasa.gov/gistemp/graphs_v3/Fig.D.txt
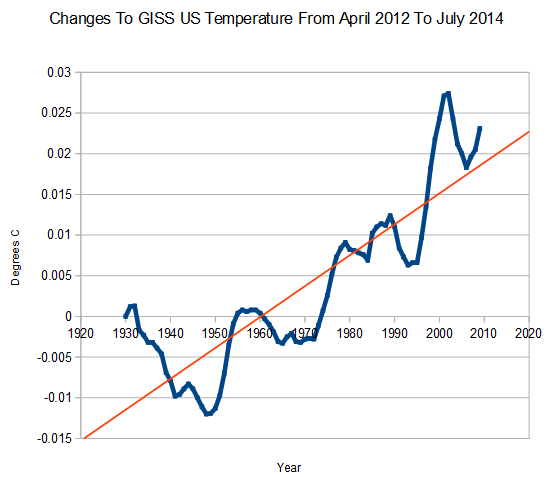
The next graph shows the hockey stick of changes they have made just since 2012.
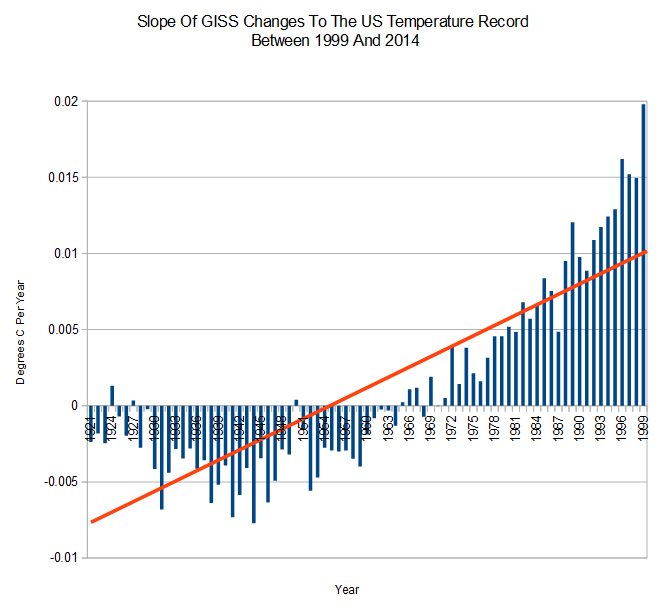
The next graph shows the slope of changes per year to the temperature record since 2000. With each passing year, 1999 gets warmer by an average of 0.02 degrees, and 1944 gets colder by an average of 0.008 degrees. (h/t to Steve Case for the new graph.)
Climate experts on both sides of the debate say that these constant changes which cool the past and warm the present are first rate science, and that I am stupid to worry about massive data tampering which turns a long term cooling trend into a warming trend.
Science is the belief in the ignorance of the experts
– Richard Feynman


amen……….
No, no, no Steve. If you are going to bury someone, leave their buttocks sticking out so you have somewhere to park your bike …
Good advice, Truthseeker!
The High Priests will not be pleased with being outed as charlatans, scammers, rent seeking ex scientists, sell outs to their political masters and preferences.
Now that they can’t afford to build rockets….they have to find “busy work”. Making up wild climate fiction for the government seems to be their niche….
Same problem with a large standing Army in peacetime.
You have two options.
1 reduce the numbers or
2 do something about the peacetime.
If you want dictatorial power option 2.
That animated graph is Steve at his best and I just do not understand how anyone –Stokes, Mosher, Zeke etc. can say anything is wrong with it. It is fully referenced using NASA’s own data. It should be front page of the Washington Post ( well 4 separate graphs in print media ).
I had some fun plotting out the slope of each year as it morphed through the four releases.
I sent Steve/Tony an email with the Excel file.
Here’s the graph
http://oi58.tinypic.com/2r5u4xd.jpg
Who are the first class experts on the skeptical side of the debate that keep claiming this is ok? Apologies if you already answered this and I missed the response.
Curry and WUWT
How about adjusting the thermometers so that “water freezes” at one hundred degrees? That way when it snows, the temperature is over 100–note that I didn’t specify Kelvin, Fahrenheit or Celsius!
http://en.wikipedia.org/wiki/Temperature_conversion
Failing to be specific gives liars and politicians more wiggle room. Failing to convert the older temperature records will save time, save effort, and promote the Global Warming Trend.
No one believes what the USG says any more (Fast&Furious, IRS e-mails lost, Benghazi, illegal children entering America, etc.).
Might want to read a fascinating book out ( http://www.booksbyoliver.com )about decent Americans taking a stand against federal tyranny cause it’s about the 2nd American Revolution & what is coming next. I recommend it.
The “Ministry of Trust” (MSM) will continue to tell us it’s global warming, but the tide of concurrence is turning against this theory. Remember, in the ’70s it was global freezing.
Nice rabbit 🙂
Steve, at the rate you are going NASA will be forced to remove earlier records and only show the new improved temperature time series. Cannot have the government look bad.