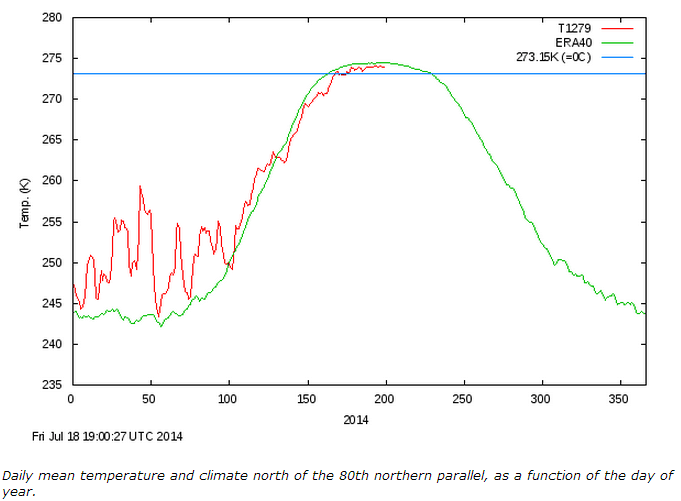
The North Pole is almost two thirds of the way through its melt season, and temperatures have been below normal every day this summer. Last summer, temperatures were also below normal every day.
COI | Centre for Ocean and Ice | Danmarks Meteorologiske Institut


Waiting for some “expert” to point out day 0 for 2013 was only minus 18 C instead of the average minus 30 C – obvious proof of runaway global warming and unprecedented ice melt !
Wait for it ….
Correct, zero days into 2013 (what day was that?) and the temperatures skyrocketed above normal, and so proving that all the CO2 is, …is …is
Forget it!
🙂
That would be deep, blood red on an anomaly graph. 🙂
There’s a pretty clear phase shift between the green and the red of about 1 week. Am I the only guy who sees this?
A leap year that leaped extra hard??
Has Summit had its two hours above freezing yet this summer?
Reblogged this on the WeatherAction Blog.
Has the temperature data plotted on the graph been adjusted?
…yes, and the gap on the little blue line is getting smaller and smaller
Damn, there goes my tropical Polar vacation.
It’s not rotten ice at all. It’s like green banana ice. We are going to have a whole lot of ice. Get the champagne ready.