
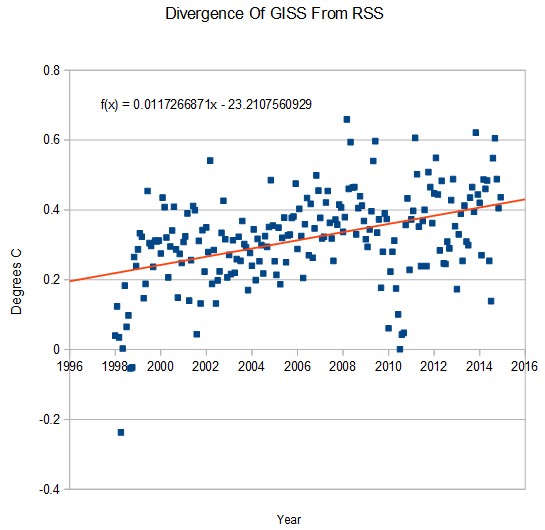
Global warming theory tells us that mid-troposphere temperatures should rise faster than surface temperatures. We are seeing the exact opposite.
Disrupting the Borg is expensive and time consuming!

Google Search
-
Recent Posts
- One Atomic Bomb Per Hour
- New Video : Analyzing Oil And Gas
- Is Antarctica Melting?
- High Speed Analysis And Visualization
- El Nino To The Rescue?
- Fake News Update
- Growth Of Antarctic Sea Ice
- 65 Years Of Progress!
- El Nino To The Rescue?
- Worst March Drought On Record
- ChartGL Process Control Demo
- The Biggest Money Laundering Scam
- Drought In The Headwaters Of Lake Powell
- Unrealistic Expectations Of Water Availability
- Did Bill Gates Do This?
- Worst March Drought On Record In The US
- The Real Hockey Stick Graph
- Analyzing The Western Water Crisis
- Gaslighting 1924
- “Why Do You Resist?”
- Climate Attribution Model
- Fact Checking NASA
- Fact Checking Grok
- Fact Checking The New York Times
- New Visitech Features
Recent Comments
- Bob G on One Atomic Bomb Per Hour
- Bob G on One Atomic Bomb Per Hour
- Bob G on One Atomic Bomb Per Hour
- Jack the Insider on One Atomic Bomb Per Hour
- arn on One Atomic Bomb Per Hour
- Bob G on One Atomic Bomb Per Hour
- Bob G on One Atomic Bomb Per Hour
- Bob G on One Atomic Bomb Per Hour
- Hank Phillips on One Atomic Bomb Per Hour
- Hank Phillips on One Atomic Bomb Per Hour
Shouldn’t you be taking the time to research your data?
http://www.skepticalscience.com/satellite-measurements-warming-troposphere.htm
Link to this page
What the science says…
Select a level… Basic Intermediate Advanced
The most recent satellite data show that the earth as a whole is warming.
Climate Myth…
Satellites show no warming in the troposphere
“Satellite measurements indicate an absence of significant global warming since 1979, the very period that human carbon dioxide emissions have been increasing rapidly. The satellite data signal not only the absence of substantial human-induced warming but also provide an empirical test of the greenhouse hypothesis – a test that the hypothesis fails.” (Bob Carter)
John Christy and Roy Spencer of the University of Alabama published a series of papers starting about 1990 that implied the troposphere was warming at a much slower rate than the surface temperature record and climate models indicated Spencer and Christy (1992). One early version of their data even showed a cooling trend (Christy et al. 1995).
Several groups of scientists began looking closely at this discrepancy. With so many other pieces of evidence indicating warming, it seemed unlikely that the troposphere would not be warming. Errors were discovered in the methods the UAH group used to adjust the data.
To understand what was wrong: The satellites must pass over the same spot on Earth at the same time each day to get a temperature average. In reality the time the satellite passes drifts slightly as the orbit slowly decays. To compensate for this and other orbital changes a series of adjustments must be applied to the data.
Temperature trends of the troposphere now match well with the surface based trend.
The MSU satellite data is collected from a number of satellites orbiting & providing daily coverage of some 80% of the Earth’s surface. Each day the orbits shift and 100% coverage is achieved every 3-4 days. The microwave sensors on the satellites do not directly measure temperature, but rather radiation given off by oxygen in the Earth’s atmosphere. The intensity of this radiation is directly proportional to the temperature of the air and is therefore used to estimate global temperatures.
There are also differences between the sensors that were onboard each satellite and merging this data to one continuous record is not easily done. It was nearly 13 years after the orginal papers that the adjustments that Christy and Spencer originally applied were found to be incorrect. Mears et al. (2003) and Mears et al. (2005).
When the correct adjustments to the data were applied the data matched much more closely the trends expected by climate models. It was also more consistent with the historical record of troposphere temperatures obtained from weather balloons. As better methods to adjust for biases in instruments and orbital changes have been developed, the differences between the surface temperature record and the troposphere have steadily decreased.
Skeptical Science?!?
ROTFLMAO!
Try posting comments that says something they don’t like and see how fast you will be banned. Of course that is AFTER they edit the comment to make you look like a fool first.
And Cook? RIIiiight. He put up a ‘pee – reviewed’ paper showing the bogus 97% crap again.
The paper looks at 12,000 papers (quicky look at abstracts by his buddies at SkS) written in the last 25 years and scraps about 8,000 papers because they don’t take a position. This was a quicky look at abstracts only by his buddies at SkS. Authors often hide the finds that are opposed to the Politically correct position on Global Warming in the body of the paper.
They put the papers that ‘agree’ into three different bins.
1. – 1.6% that explicitly endorse global warming with numbers.
2. – 23% that explicitly endorse global warming without numbers.
3. – 74% that cook says “implicitly endorses” global warming because they’re looking at other issues in conjuntion with global warming and therefore that means the writer(s) must they agree with human-caused global warming. This completely ignores the fact that if you do not use the CAGW get out of peer -review pass card in your grant and paper you do not get the grant money much less get the paper into a journal.
Notice, that *nobody* said anything about *dangerous* global warming; this meme simply got attached afterwards!
Only problem for cook is several scientists raised hell about having their papers tossed in to the pro-CAGW bin.
Richard Tol, an IPCC lead author tried to replicate cook’s study and it turns out he has done pretty much everything wrong. AND he won’t release the data so anyone else can check it. To any real scientist that means it is NOT SCIENCE! In my field we expect the study to be replicated in at least TWO (not one) independent labs before we would begin to say the information is valid.
Tol’swas so irrate he wrote a letter to the Peter Høj, University of Queensland: “the main finding of the paper is incorrect, invalid and unrepresentative.”
The letter is here:
http://richardtol.blogspot.com/2013/08/open-letter-to-vice-chancellor-of.html
Modern recognition of the pause in Satellite data occurred after that older issue was corrected.
In short, it has no bearing on this argument. Station data is diverging from Satellite data.
My Favorite demonstration of the get out of peer-review free card used by those who actually thing it is B.S.
“Correct adjustments”? So the result matches THEIR preconceived idea on what “correct” ought to be? How is merging different sources of data, of using adjustments for orbital changes, any different than CAGW alarmists/”scientists” making adjustments for UHI, of ship readings that only measure at a single point in time (not multiple days), from multiple proxies, etc.?
Oh right. In the CAGW debate, only the alarmists can be correct when “adjusting” data and only THEIR ridiculous methodologies are acceptable. To that hypocrisy, I give the one-finger salute, sir.
They use weather balloon data to cross check the satellite data
Remote Sensing Systems (RSS satellite data)
http://www.remss.com/measurements/upper-air-temperature
Baconboy, are you daft The graph above in the head post shows the anomaly after all the adjustments you quoted! Therefore your post is not relevant at all.
The simple fact is that the troposphere was supposed to warm more then the surface, and the surface is diverging not only from the troposphere, but the warming in the surface is ever more from ever more use of adjusted data. The raw surface data is much closer to RSS, and the increase in sea ice and NH snow coverage support the RSS readings as well as the unadjusted surface readings.
In any and ALL cases, the warming, even after all the questionable adjustments, is well below the theory. There is no CAGW period.
“When the correct adjustments to the data were applied the data matched much more closely the trends expected by climate models.”
You’re funny!
In no other branch of science is it considered permissible to adjust the observational data to match the output from the computer games.
Here’s a pretty picture for your delectation.
https://wattsupwiththat.files.wordpress.com/2014/12/oco2-global-2014.jpg
Think about the implications of THAT, little pause denier.
Thank you for vividly demonstrating again that John Cook is completely FOS
And of course if Baconboy was anything but a fly by type here he would have read this already: Why 2014 Won’t Be the Warmest Year on Record
October 21st, 2014 by Roy W. Spencer, Ph. D.
http://www.drroyspencer.com/2014/10/why-2014-wont-be-the-warmest-year-on-record/
Regretfully, Baconboy, Steven Goddard is now far more credible than the armies of consensus “scientists” who have hidden, manipulated and misrepresented the best experimental data on Earth’s heat source – the Sun – for seven decades.
Just as BaconBoy says: If the data does not show warming it must be adjusted!
It’s so warm, that the Great Lakes are 13% more covered with ice then the same time last year with it’s record setting second highest ice coverage on record.
http://www.washingtonpost.com/blogs/capital-weather-gang/wp/2015/01/16/great-lakes-ice-makes-a-leap-after-january-cold-snap/
Steven, do you have the “reported” USA data Gavin used in his calculations.
If so how does it match to the USHCN data.
http://www.ncdc.noaa.gov/temp-and-precip/national-temperature-index/time-series?datasets%5B%5D=uscrn&datasets%5B%5D=cmbushcn¶meter=anom-tavg&time_scale=p12&begyear=2005&endyear=2014&month=12
Baconboy has me thinking about posting my Gore Pigs parody, but would I offend? 🙂
MAN BEAR PIG…!!!!!!!!