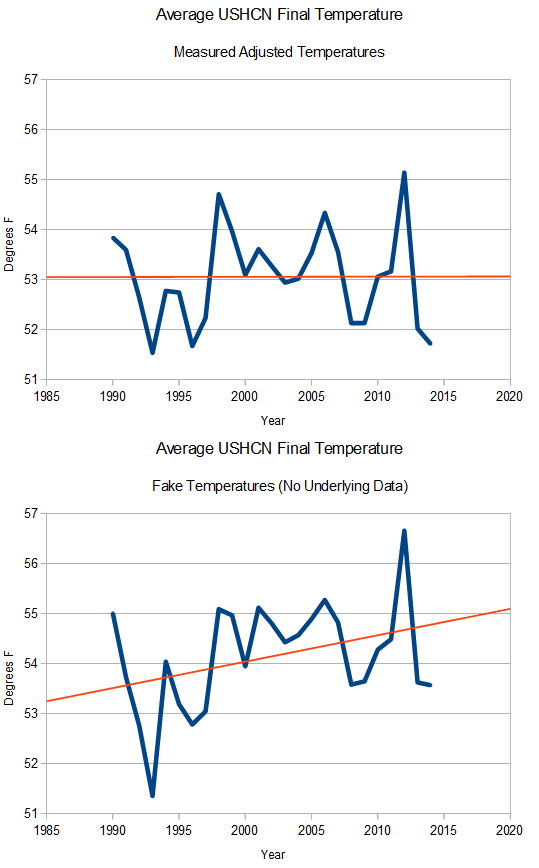
The animation below flashes between the average of measured adjusted USHCN temperatures, and the estimated (infilled) ones – which are marked with an “E”
As you can see, all US warming since 1990 is due to infilling fake data. And even the measured zero warming temperatures have been tampered with using various other adjustments.
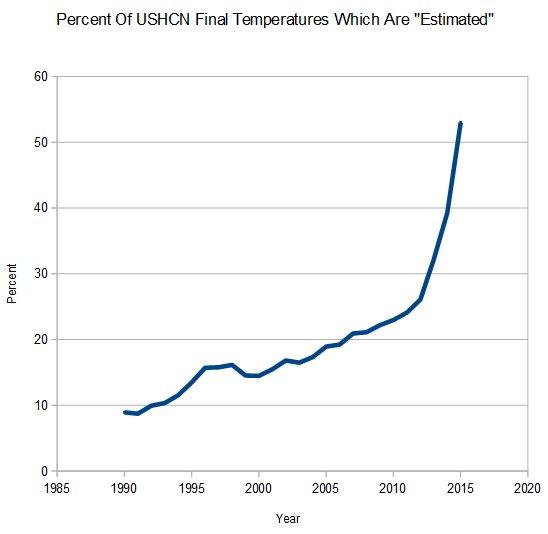
USHCN is losing data at a spectacular rate over the last three years, with more than 50% of the 2015 data marked as estimated, and nearly 40% of the 2014 data marked as estimated.
Temperature analysis reported by NCDC to 0.01 degrees are scientific malfeasance. They probably aren’t accurate within 1.0 degrees.


if you pay someone to prove A+B=C, C will always be the answer you get.
The IPCC charter…
“… to assess on a comprehensive, objective, open and transparent basis the scientific, technical and socio-economic information relevant to understanding the scientific basis of risk of human-induced climate change, its potential impacts and options for adaptation and mitigation. IPCC reports should be neutral with respect to policy.“
Sooner or later the deception will be exposed. It cannot be sustained. The only questions are when and how the masses will wake up to it.
You can not fool all of the people all of the time, but you can fool progressive fools 97% of the time.
The progressive fool pool leaks but it is constantly replenished. This phenomenon is believed to function outside the laws of thermodynamics. It will run till the end of times.
They cried in the Gulags when Stalin died. To this day if you walk just behind Lenin’s tomb you can watch people laying flowers on Stalin’s ‘grave’. The deception has been exposed… but unless the masses wake up, it will always be sustained.
A LOT of Russians LOVED “Uncle Joe” (which was how many of the useful idiots referred to him). Apparently, torture was something Uncle Joe had underlings do on a LOT of “traitors” – which had a really arbitrary definition…
Uncle Joe most likely murdered more Russians than Hitler killed Jews and other “undesirables”. In fact part of the reason Barbarossa was so successful initially was because of Stalin’s purge of the Soviet military leadership that started with the Great Purge in 1939, went through a second purge targeted at the directorates of the defense industires, and suffered a final purge that went on through most of 1941.
I guess we’ll see. Or perhaps we won’t because we will have expired before it happens. But there has to come a time when the constant “adjustments” will be so anomalous to the perceived reality that even many of those with severely limited situational awareness will see the light. The only way it can be sustained in the long run is if the government takes control of all information and communications. Then you could have a situation analogous to that which Mike mentions.
Wow – that’s amazing. It occurs to me that with the 24/7 measurement of temperatures everywhere since the 1950s, there should be a way to check the “infilled” temperatures synthesized by the NCDC and NOAA with actual measured temperatures at nearby locations.
Actually continuous measurement were done at some stations since ~ 1900!!!
Meteorology: A Text-book on the Weather, the Causes of Its Changes, and Weather Forecasting By Willis Isbister Milham 1918
I thought it quite interesting that Willis Isbister Milham was talking about 20 years of hourly data in 1918.
On page 68 he says a thermometer in a Stevenson screen is correct to within a half degree. It is most in error on still days, hot or cold. “In both cases the indications of the sheltered thermometers are two conservative.”
on Page 70 he says, “The Ventilated thermometer which is the best instrument for determining the real air temperature, was invented by Assman at Berlin in 1887…will determine the real air temperature correctly to a tenth of a degree.”
An Instruction Manual was written and given out to the observers in 1882. There were two thermometers, one max (mercury) and one min (alcohol). Milham states these were used because they were more accurate than the Six Min/Max thermometer.
For the maximum thermometer the Instruction Manual states:
“…When a maximum thermometer is not read for several hours after the highest temperature has occurred and the air in the meantime has cooled down 15° or 20°, the highest temperature indicated by the top of the detached thread of mercury may be too low by half a degree from the contraction of the thread….”
That would indicate the max thermometer should be read just after the heat of the day and any adjustment for reading at the wrong time of day should RAISE the maximum temperature not lower it!
In otherwords the various reasons for ‘adjustments’ are based on the need to cause the temperature to warm and NOT because the old data was not acurate to well defined limits!
It gets even more interesting.
Zeke Hausefeather did a hatchet job on Steve in his article @ Judith Curry’s Understanding Adjustments to Temperature Data. The Mosh pup is there defending BEST. Zeke and Mosher are defending the TOBS adjustments that Steve (and I) say are bogus.
Zeke Hausfeather states:
So in addition to the TOBS ‘adjustment’ they do another 0.5 C colder adjustment to the older liquid in glass thermometers. However that adjustment is just as bogus, actually more so than the TOBS adjustment.
So that ‘adjustment’ just like the TOBS adjustment is also in the WRONG direction giving up to a 1.5°C warming bias!
And then there is the question of whether or not the BEST data was actually raw data to begin with.
Zeke says, “In the Berkeley approach every attempt is made to use first reports. We avoid the term “raw” data because one can never know that data that purports to be “raw” is in fact “raw.” ~ http://judithcurry.com/2012/07/29/a-new-release-from-berkeley-earth-surface-temperature/
Turns out that statement too is ‘economical’ with the truth.
Ben says over at Jo Nova’s on January 20, 2014 at 8:53 am
Re Malfeasance. I would imagine the charges would be very similar to that of the Libor case, so I thought it would be interesting to see what they were charged with:-
“Three former brokers at ICAP, the interdealer broker, pleaded not guilty on Friday to criminal charges that they attempted to manipulate the Libor interbank benchmark rate.
Colin Goodman, Darrell Read and Danny Wilkinson all entered their not-guilty pleas to a packed courtroom at Southwark Crown Court on Friday to charges of conspiracy to defraud brought by the UK’s Serious Fraud Office.
…
All six brokers are accused of conspiring to manipulate the yen-denominated Libor rate to benefit a trader who worked at UBS and then at Citibank.” (http://www.ft.com/cms/s/0/e463cdc4-7c77-11e4-9a86-00144feabdc0.html#axzz3QnMaThIz)
We certainly have “conspiracy to manipulate” a rate. So that test seems to have been passed. But the other part of a charge for fraud requires them to do it for financial or other benefit.
Might I suggest that Hansen got a lot of personal wealth as a result of global warming. I would imagine that this could be directly attributed to manipulating the global temperature rate. I’m sure there will also be grant applications made by individuals involved in compiling these datasets using words to the effect of “we should get this grant because of the temperature change rate”.
Or am I missing something?
“As it waits for the resolution of its Freedom of Information Act lawsuit against the National Aeronautics and Space Administration (NASA), which seeks the outside employment permission records of global warming activist Dr. James Hansen, American Tradition Institute’s Environmental Law Center has received the belatedly filed 2010 public financial disclosure of the renowned director of the NASA’s Goddard Institute for Space Studies.
ATI obtained Dr. Hansen’s Form SF 278, which is required to be filed annually, also under the Freedom of Information Act. The disclosure revealed that Dr. Hansen received between $236,000 and $1,232,500 in outside income in 2010 relating to his taxpayer-funded employment, which included:
• Between $26,008 and $72,500 in honoraria for speeches
• Between $150,001 and $1.1 million in prizes
• Just under $60,000 in the form of in-kind income for travel to his many outside-income generating activities
http://junkscience.com/2011/10/03/first-millionaire-bureaucrat-nasas-james-hansen-earns-up-to-1-2-million-in-2010/
Gavin’s whole job, the existence of everything he is and believes in, is tied to there being warming.
Without his work, the whole warming agenda collapses in a heap !!
I meant to add..
Imagine the pressure on him to “perform” !
This is obvious evidence that the perpetrators should be defunded (at a minimum), if not prosecuted for fraud.
Hi Steven,
I’m trying to compare to this data.
http://www.ncdc.noaa.gov/temp-and-precip/national-temperature-index/time-series?datasets%5B%5D=uscrn&datasets%5B%5D=cmbushcn¶meter=anom-tavg&time_scale=12mo&begyear=2005&endyear=2014&month=12
But the flicking is too fast !
So Tony what have your detractors to the original identification come up with? After all, A. Watts posted –
NCDC needs to step up and fix this along with other problems that have been identified.
And they are, I expect some sort of a statement, and possibly a correction next week. In the meantime, let’s let them do their work and go through their methodology. It will not be helpful to ANYONE if we start beating up the people at NCDC ahead of such a statement and/or correction.
I will be among the first, if not the first to know what they are doing to fix the issues, and as soon as I know, so will all of you. Patience and restraint is what we need at the moment. I believe they are making a good faith effort, but as you all know the government moves slowly, they have to get policy wonks to review documents and all that. So, we’ll likely hear something early next week.
http://wattsupwiththat.com/2014/06/28/the-scientific-method-is-at-work-on-the-ushcn-temperature-data-set/
Never did read about any corrections and from the above now 50% (up 10%) still fake they are only making more.
Yes, Gavin stepped right up increased the amount of fraud and then announced that 2014 was the WARMIST YEAR EVAH! Just in time for Obummers State of the Union address.
So much for ” let’s let them do their work and go through their methodology. It will not be helpful to ANYONE if we start beating up the people at NCDC ahead of such a statement and/or correction.”
Yes let’s let them continue to get away with LYING to the US public in aid of the destruction of our contry.
source(s)?