
Yesterday I showed how 100% of US warming since 1990 is due to NCDC filling in fake temperatures for missing data. The actual measured data shows no warming
The next step is to look at the correlation between how much infilling is being done vs. the divergence between estimated temperatures and measured.
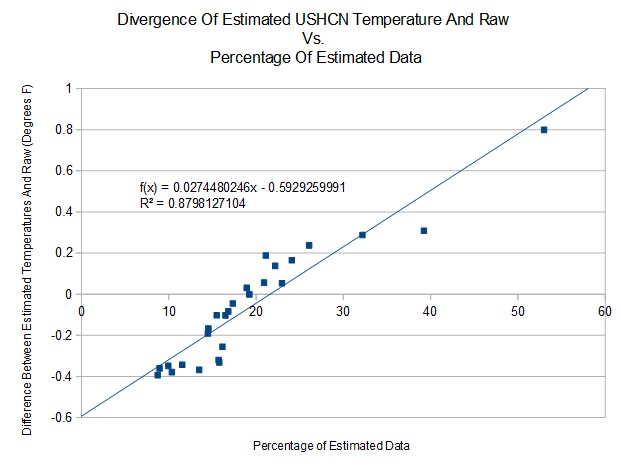
There is a very good correlation between infilling and inflated temperatures. The more fake data they generate, the larger the divergence in temperature vs. measured. This is likely due to loss of data at rural stations, which are now being doubly contaminated by gridded and infilled urban temperatures.

Ouch! Tony, that third graph, the divergence vs percentage estimated is a killer. Between that and your graph showing the near linear correlation of adjustments vs CO2, I cannot see any honorable explanation for them.
Great work!
It strikes me that there must be a linear correlation (in three dimensions) between CO2, percent of data made up, and divergence from raw data. Other than conscious fraud, I cannot see any way to explain a 3D linear relationship between those variables.
If we had a court system that actually worked we would be able to put 100s if not thousands of these liars in jail and confiscate their wealth. Heck we could probably pay off most of the US federal debt!
http://www.antiwarsongs.org/img/upl/rn_neon_deadline_025-copy.jpg
Chain gangs. Now there is something we could use more of. Unfortunatly they seem to be a thing of the past in most of the US. Saw one working down near Carville, LA a few years back though.
When more than half of your data is estimated, your data set is essentially useless.
When your infilled (estimated) data changes the trend of the data set and gives a completely different picture, you are committing fraud.
When you use that data set to calculate a global average temperature to .002 degrees of accuracy, you are bat shit crazy.
How do these graphs look for minimum/maximum temperatures?
If this is really contamination of rural temperatures by infilling with UHI-affected stations, the minimum temps should be responsible for most if not all of the rise of the fake data.
Since the stations were dropped several people have looked at the data.
Two articles from several:
https://diggingintheclay.wordpress.com/2010/04/11/canada-top-of-the-hockey-league-part-1/
https://diggingintheclay.wordpress.com/2010/01/23/temperature-stations-how-many-have-data-adjusted/
One article from several:
https://chiefio.wordpress.com/2009/11/06/gistemp-for-tonyb-and-step2-selection-bias/
http://wattsupwiththat.com/2014/01/06/the-original-temperatures-project/#comment-1526859
Website: http://www.hidethedecline.eu/
(That website seems to have just gone off line)
The internet archive (wayback machine) can be your friend. Surf on over to
https://web.archive.org/web/20150109190930/http://hidethedecline.eu/
They’re desperate; Kuroda’s Secret Foiled UN’s Plans to rule by deceit.
For fifty-seven years, from 1945 until 2002, world leaders did not know who had secret plans for building atomic bombs [1].
The nuclear geochemist that had the atomic bomb secrets, Professor Paul Kazuo Kuroda, was not interested in building atomic bombs.
In 1960 Kuroda assigned a research project that would reveal the greater “Top Secret” world leaders hid from the public after WWII: >i>“The Origin of the Solar System and Its Elements.”
The current AGW scam promoted by the UN’s IPCC illustrates UN’s plans for controlling the world.
Kuroda’s “Top Secret” is explained on page 3 of a recent paper [2]: The atomic nuclear structure inverts at ~150 amu (atomic mass units).
1. The nucleus of atoms lighter than ~150 amu has a core of n-p pairs with extra neutrons on the nuclear surface.
2 . The nucleus of atoms heavier than ~150 amu has a core of neutrons and n-p pairs are on the nuclear surface.
That is why atoms heavier than 150 amu emit pairs of n-p pairs (alpha particles) from the surface.
Neutron repulsion causes cores of heavy atoms to become increasingly likely to fission as mass increases.
Neutron repulsion causes the cores of planets like Jupiter, ordinary stars like the Sun, galaxies and the cosmos to emit neutrons and/or fission [2].
Earth is located exactly 1 AU from the pulsar that made our elements, birthed the solar system, sustained the origin and evolution of life, and maintains contact with every atom, life and world in the solar system . . .
Controlling the climate of a volume of space greater than the volume of 10,000,000,000,000,000,000 Earth’s.
Society’s challenge now is to retain benefits from seventy years of UN’s planning and to eliminate deceptive tyranny in UN’s implementation of Agenda 21 [3].
– Oliver K. Manuel
References:
1. BBC News, “Atomic plans returned to Japan,” News Front Page, World Edition (3 Aug 2002) http://news.bbc.co.uk/2/hi/asia-pacific/2170881.stm
2. “Solar energy,” Adv. Astronomy (submitted for on-line review, 6 JAN 2015): See page 3. https://dl.dropboxusercontent.com/u/10640850/Solar_Energy_For_Review.pdf
3. “United Nations Agenda 21? (1972) http://habitat.igc.org/agenda21/index.htm
Now imagine the absurdity of the human species, living 1 AU from a pulsar, paying taxes to politicians that hire pseudo-scientists to scare the public about dangers of a gas (CO2) designed by our Creator to allow plants and animals to live in mutually beneficial harmony: CO2 is in fact
1. The essential food of plant life
2. The waste product of animal life
What an excellent point Omanuel!
1 AU from a Pulsar? Our sun is a Pulsar? A Pulsar is a Neutron star (The remnant of a Supernova that spins very rapidly emitting radio waves pulses known for the super regularity of their pulses.)
One au by which I assume you are meaning “Astronomical Unit” is a distance measurement based on the mean distance between the earth and the sun.
I don’t get it omanuel?
Yes, the core of the Sun is the pulsar remnant of the supernova that made our elements and birthed the solar system five billion years (5 Ga) ago.
Please scan the document, study page 3 on the inversion of nuclear structure at ~150 amu, and then look at the nine pages of experimental data and the conclusion:
https://dl.dropboxusercontent.com/u/10640850/Solar_Energy_For_Review.pdf
Let me know if you have a better explanation for the measurements and observations.