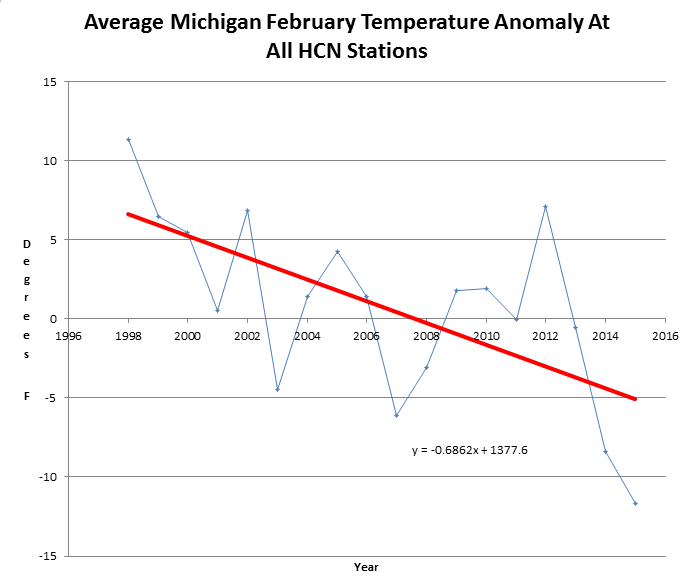
Heidi Cullen says that global warming is making winters around the Great Lakes red hot.
The Great Lakes have all-time record ice cover, with most of the last 13 years normal or above normal ice cover. Apparently Heidi believes that the freezing point of water has changed.
Michigan February temperatures are falling at 69 degrees per century.


Since there are no weather stations on the lakes themselves, they must extrapolate temperatures from nearby locations like Dallas, Miami, and Phoenix. And then of course they must adjust for TOBS and station moves. But really, you have to wait at least a few decades to find out what the temperatures really were/are.
You mean, from Death Valley and only in summer. 🙂
This is how low they are going
http://arctic.atmos.uiuc.edu/cryosphere/IMAGES/seasonal.extent.1900-2010.png
Finishes at 2010!!!!! They are really NON_SCIENTISTS. Maybe its time you took these guys on re NOAA, NASA, ect Cryosphere today UNi of ILLinois me thinks
Hey Eliza! I wonder how accurate the graph is. Have they “adjusted” the sea ice history as well? We know that 1979 was a maximum in NH ice and we also know that the 1940s saw many reports of melting Arctic ice — but I do not see those in the chart.
It looks like someone is pushing an inverted hockey stick, but I find the long straight handle hard to believe.
Dead right, Jason
Just ask anybody in Iceland, who lived through the sea ice years of the 1960’s and 70’s, when much of the coast was ice bound even in Spring, for the first time since 1888.
HH Lamb uses this chart to show these variations.
https://notalotofpeopleknowthat.wordpress.com/2014/10/08/hh-lamb-cooling-in-the-arctic/
There was no way to measure ice extent accurately in 1960, much less 1900. This whole chart is an obvious fraud. Only in the satellite era could that be done. The 1900 error bars would have to be the + or – the extent of the ice.
Eliza: In fairness to the University of Illinois/Cryosphere Today, it should be noted that the chart you posted that finishes at 2010 is listed under “Older Products.” The current version, which appears to go through January, 2015, is included at the top of their home page and can be viewed here : http://arctic.atmos.uiuc.edu/cryosphere/IMAGES/seaice.anomaly.arctic.png
The first images caption reads “Average winter temperatures have been rising in every state since 1970.” Yet if you look at Nevada and the legend, it shows that even by their own likely false information, that Nevada is down by -0.1 degree per decade. With such internal inconsistencies, how could you possibly believe anything they write?
I live north of Iron River, MI a simple way to judge the temp would be plant a half dozen royal palms. And each spring you know about July check and see if they made it through the previous year. That should at least indicate if it is still cold here. By the way the temp here in bright sunlight around 7-8am was around -15f this morning.
Heidi Cullen is either not too bright, or not too honest.
http://www.ncdc.noaa.gov/cag/time-series/us/102/00/tavg/3/02/1895-2015?base_prd=true&firstbaseyear=1901&lastbaseyear=2000&trend=true&trend_base=10&firsttrendyear=1997&lasttrendyear=2014
Detroit wishes it was warmer. But as reality has it, tomorrow this will be the coldest February recorded since 1875 in Detroit.
Nice one on Joe’s site.
http://joannenova.com.au/2015/02/australian-bom-under-fire-questions-about-adjusted-temperatures-exploding-around-the-world/
Climate scientists can lie, but the Great Lakes apparently can’t do so.
Look at IPCC AR5 Figure 1.9 table of projections. Pretty much a total bust.