
I ran another test of TOBS-resistant data.
Any day which has a higher maximum than the previous day can not be due to TOBS double counting. The graph below shows the percent of days over 90 degrees, which were also hotter than the previous day. Once again we see that the 1930s were much hotter. This can’t be blamed on TOBS.
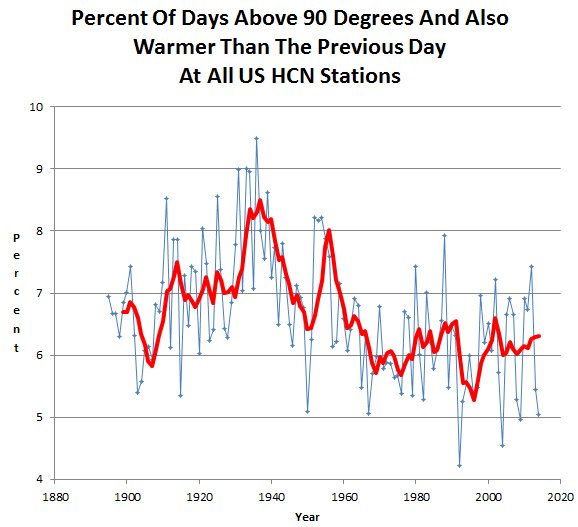
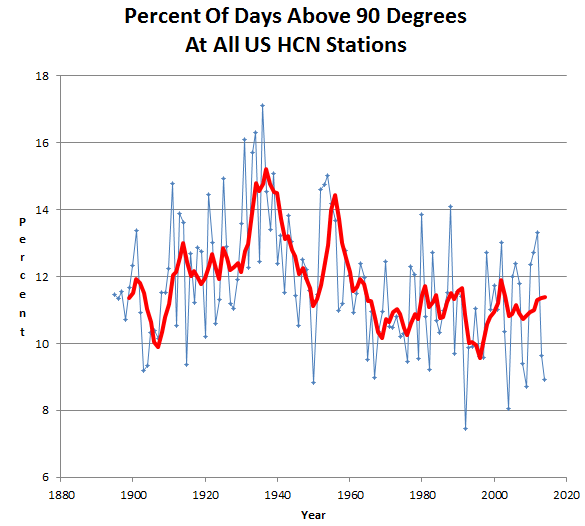
The pattern is essentially identical to the pattern for all days. TOBS has little or no impact on the US temperature record.
Zeke and Mosher never discuss any actual testing like this on the real data, choosing instead to hide behind models and peer-reviewed junk science.

Excellent. I expect Mosher and Zeke to come along any time now and fess up. NOT
“Zeke and Mosher never discuss any actual testing like this on the real data, choosing instead to hide behind models and peer-reviewed junk science.”
The real data does not say what the CAGW scammers want it to say — so they make up plausible sounding reasons for why they need to change what was measured into what they want it to have been.
Both Zeke and Mosher will end up like Judith Curry and be hounded by the global warmist gang.
For poor data analysis skills? They’re more likely to receive praise.
Zeke and Mosher are agents of the global warmist gang. Remember they work
forwith Muller whose puppet master is Marlan Downey, ‘ Former’ President of the international subsidiary of Shell Oil.The company president of the company I worked for in Taxachusetts crossed Shell Oil when he snatched Husky Oil out from under their nose. They used WWF to take him down. (The polystyrene scare in the 1980s)
Zeke has claimed that he took UHCRN data and choose a time point to “reset”, then took the max in the closed interval from reset to reset, and then from that reset converted UHCRN data to single day measurements of Tmin/Tmax. He then compared it to the actual Tmin/Tmax from the UHCRN data and says the TOBS adjustment conincides with what they have been doing at NOAA. I am seriously going to look at his argument and see if the USHCRN data supports his contention. It is good data to look at to see if TOBS bias can be spotted.
+1 I too would like to see his data.
Don’t throw your pearls to the pigs!
Maybe just do a search for any two days running that are exactly the same maximum temperature… work out what percentage of the data we are looking at. I’d guess it does not happen often.
I have been thinking about that very thing.
ISTM the claim is this: when TOBS was in the “afternoon” — that is, after noon, meaning not in the morning — two days, the latter of which had a lower maximum temperature than the former, could have been reported erroneously as having the same maximum temperature.
That is the claim, right?
There’s an additional claim: afternoon readings were more common before the early 1960s, after which time readings became more standardized in the morning because of encouragement from NWS or AMS or whoever to do morning TOBS.
That is the additional claim, right?
There’s another additional claim: the reverse effect can happen with morning TOBS: two days, the former of which had a lower minimum temperature than the latter, could be reported erroneously as having the same minimum temperature.
That’s another claim, right?
It ought to be possible to verify whether that change in the 1960s made any significant difference in “double” readings. That is, in each year, what percentage of stations with TOBS after noon reported two consecutive days with the same maximum temperature? Additionally, how many such occurrences? And is there any significant difference in the percentages, and number of occurrences, before 1960 and after 1960? Likewise, mutatis mutandis, for stations with morning TOBS for low temperatures.
ISTM that one could build on the logic and code employed to generate the first graph on this page.
P.S. While figuring out how to put my thoughts into words, it occurred to me that the likelihood of double counting maximum temperatures at a station with afternoon TOBS wouldn’t be much different than triple counting; that is, a series of three days with the maximum temperature of the first day being the highest. (I should think a triple occurrence would be more likely in late summer or early fall, in the USA, when the maximum temperatures start to drop.) According to the TOBS-bias theory, all three days would be reported as having had the same max temp. Such an occurrence would stand out even more than a “double”, like a sore thumb or a red flag or a flashing light or whatever analogy you like; that is, it would be unavoidably noticeable to the observer. And anybody with even half a brain would realize he hadn’t been doing the observation/reset correctly, and would adjust his behavior accordingly.
There is no reason to expect that double counting would produce exact duplicates. The thermometer might have been reset half an hour after the peak.
Thank you.
But then it would not be a double count. IF the day is defined as reset to reset, the length of day varies but averages out to a day. The prior days Tmax would not match the next days Tmax nor is it a duplicate. So why would someone call it a dup?
I would like to see the same long term graph reversed as percent of days at all HCN stations below a certain temperature level as opposed to above (percent low night-time temps low as opposed to percent high day time temps high) and if the same graph reversed. Prefer some basis too filtering out UHI effect, dropped stations, and filled in data, unfortunately radiosonde and RSS do not go back that far .
If it is too cold tonight due to record lows in Baltimore, will understand delay, my water meter outside froze and busted here after two decades, not even UHI effect is enough to protect me from cold, maybe could go ice skating close to March, unfortunately do not use fossil fuels to contribute to “warming” and heat house with wood, or does global warming cause global cooling?- wait crap, they say renewable resources worse than coal or oil due to carbon?? I need a high efficiency wood stove at $500 bucks more by gov regulation, maybe go to gas instead if shut down.
People keep thinking there are no decent records. There are records going back to at least 1900 where continuous Richard Freres thermograph records were made
Willis Isbister Milham in 1918 states:
“….The observations of temperature taken at a regular station are the real air temperature at 8am and 8pm, the highest and lowest temperatures of the preceding 12 hours, and a continuous thermograph record…. (Richard Freres thermograph) ….these instruments are located in a thermometer shelter which is ordinarily placed 6 to 10 feet above the roof of some high building in the city. At a Cooperative station the highest and lowest temperatures during a day are determined, and also the reading of the maximum thermometer just after it has been set…..”
He also states there are 180 to 200 ‘regular weather’ stations ordinarily in the larger cities, 3600 to 4000 coop stations and 300 to 500 special stations that took reads of rain, humidity, wind and other parameters. He also mentions taking twenty year or more Richard Freres thermograph records and doing calculations for monthly and yearly data.
In other words there is ZERO reason for computerized guessing games except laziness on the part of the ClimAstrologists.
I would think that it would be harder to define TOBS in early data where mercury/alcohol thermometers were being used and the uncertainty was in whole degrees as compared to today’s MMS devices which probably read out in tenths of degrees. I’m not sure what the accuracy of the readings are in either case, but would assume that the newer recorders are more accurate, and therefore less likely for anyone to claim any TOBS. To explain; if you were using an early thermometer and getting a reading of 100 degrees and the next day the reading was 100 degrees, there might be a claim of TOBS, but with the newer MMS devices the readout might be 100.0 degrees today and 100.1 degrees tomorrow. The first case is open to argument for TOBS but the second is not.
Would it not be more informing to truncate all high accuracy data to the accuracy of the early data and then compare the number of double readings between the early and current temperature readings. TOBS should not exist when using MMS devices. If the number of double readings between the two temperature histories is similar then it says that natural randomness of day to day temperature readings produces a given number of double readings. If the number of double readings between the thirties and 2000’s are the same then TOBS does not exist.
Actually the MMTS equipment is far less accurate than the old thermometers because they are too sensitive and react to transient spikes which we do not notice and the old thermometers are too slow to pick up.
Exactly AC. MMTS equipment is +/-0.5°F [+/-0.3°C] according to NOAA.
http://www.srh.noaa.gov/srh/dad/coop/specs-1.html
The only thing morning vs. evening TOBS does is slide the window for min/max back and forth a few hours and as long as it’s consistently ~24 hours between resets… who cares. As I’ve said before, the ONLY way they could make a valid case for adjustments was if they had continuous temp data for that specific station on the specific day they wished to adjust it… then they wouldn’t need to adjust. If it was absolutely critical that min/max readings were day/date dependent, they should be reset at 12 midnight. It’s another bogus, pretend science arm waving excuse to manipulate the data.
“….I would think that it would be harder to define TOBS in early data where mercury/alcohol thermometers were being used and the uncertainty was in whole degrees….”
>>>>>>>>>>>>>>>>>>
Again there are records. The accuracy was 0.5F for the mercury and no better than 0.6F for the alcohol.
Checking of Boulder hourly for a year reveals the effect is real on real measurements taken each hour, and then taking the max over 24 hours periods with different reset times.
The higest average change by the reset time was 0.8C for a change from 6 morning to 14 afternoon. I have not figured out why exactly, but the effect is amazingly real.
If the thermometers are reset only in the afternoon, you will double count high temperatures. if the thermometers are reset only in the morning, you will double count low temperatures.
Any responsible observer will reset twice per day, or near midnight.
Now add up all the days per month.
Now divide by 28,29,30 or 31 to get the monthly change.
Now count how many stations were measured at 6 & 14.
I think you are missing the idea behind the posting. Tony is showing that the thirties were warmer than what we are experiencing currently. That being true, there is a problem with the way the agencies are correcting for TOBS and UHI.
It is called a sanity check and the adjustments FLUNK big time.
Have you seen their posts at juddith curry’s site?? Apparently they have looked and looked, but can not find any UHI.
Depends on where you look.
http://www.drroyspencer.com/2010/03/global-urban-heat-island-effect-study-an-update/
http://www.drroyspencer.com/2014/06/las-vegas-poster-child-for-the-urban-heat-island-effect-updated-corrected/
http://www.drroyspencer.com/wp-content/uploads/ISH-UHI-warming-global-by-year.jpg
http://www.drroyspencer.com/wp-content/uploads/ISH-UHI-US-vs-nonUS-2000-2009.jpg
You would thing you could find an almost two degree signal if you are claiming to be able to find a 1/2 degree signal for TOBS with your computer prestidigitation now wouldn’t you?
Simply elegant, Tony.